By Vlad Nadymov 21 min read
Data as of
Rerun this study with live data: the agent prompt
An agent can rerun the core counts of this study. The prompt below tells it how to get access to the selltostate.com API, which codes and words find works on public buildings, which false matches to drop, and which measures to report. The country table at the end of the article gives the counts of this snapshot.
Rerun the selltostate.com study "Who wins public construction contracts" with current data.
The article is at https://www.selltostate.com/blog/how-governments-buy-construction/.

1. Get access to the selltostate.com API.
   - If I give you an API key, use it in the header x-api-key: <key> and go to step 3.
   - If not, sign up as an agent: POST https://app.selltostate.com/api/oidc/register
     with the JSON body {"client_name": "<your name> for <my name>"}.
     Keep client_id and payment_link from the answer.
2. Pay for access. The price is at GET https://app.selltostate.com/api/v1/price.
   - Show me the price and the payment_link. Wait for my yes.
   - I pay on the payment_link. Then use the header Authorization: Bearer client:<client_id>.
3. Check access: GET https://app.selltostate.com/api/v1/whoami must show "active": true.
   Keep the key and the client_id private.
4. For these countries: [your countries, or every live market], find the awards and tenders for works on public buildings.
   Use the building code where the source has one (CPV 4521, 45210000 to 45216000, or the national building code).
   Else search the title for a construction word and a building in the language of the country: "construction of",
   "construcción de", "construção de", "Neubau", "budowa", "будівництво", "ujenzi wa", with school, hospital, clinic,
   health centre, classroom, housing, office, town hall, fire station, police station, court, sports hall, library,
   kindergarten. Keep a record only when the thing built is a building. Drop the false matches that the article lists:
   roads, bridges, water and sewer networks, fences, parks, sports pitches, supplies, design, supervision, survey and
   legal services, and framework agreements. Leave out a source that publishes a spend category in place of a title.
5. Split each record by kind: new building, extension, renovation. The article counts new buildings and extensions.
   Count one procurement per buyer and title. Give each country the same weight when you report a mix of types.
6. For each country, report the building procurements, the mix of building types, the winners (names as published;
   do not merge groups without proof), the share of winners that won once, the share of the money won by the top 10%
   of winners, and the firms that won in more than one country. Where the notice states them, also report:
   - the share won by small and medium firms, overall and by contract value band (under EUR 1 million, 1 to 5,
     5 to 20, 20 and more), by count and by value;
   - the bids per lot or per tender: the median and the share with one bid;
   - the share won by a firm from another country.
7. Report the median award value by country and by building type, in euro at 2025 average rates.
   Leave out framework ceilings and values under EUR 9. Read every value of EUR 250 million or more by hand.
8. Compare your results with the article. Explain the differences: newer data, other sources, and the rules
   that you did not use.
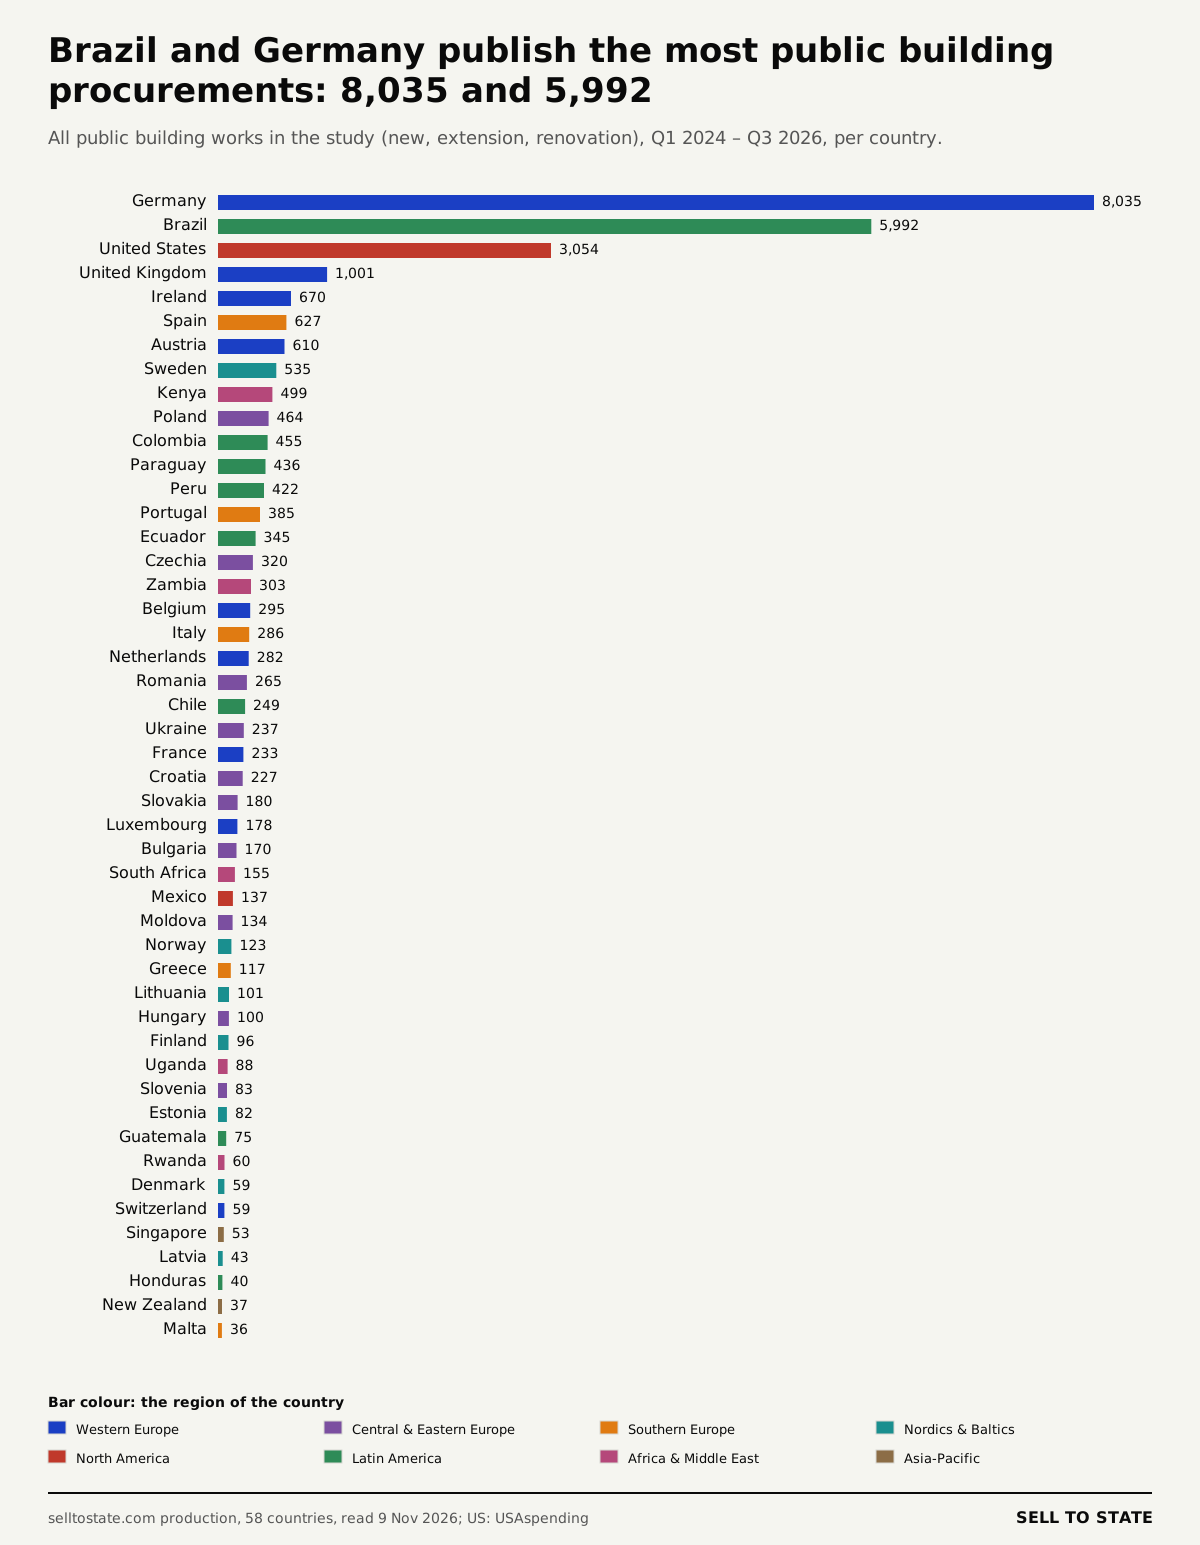
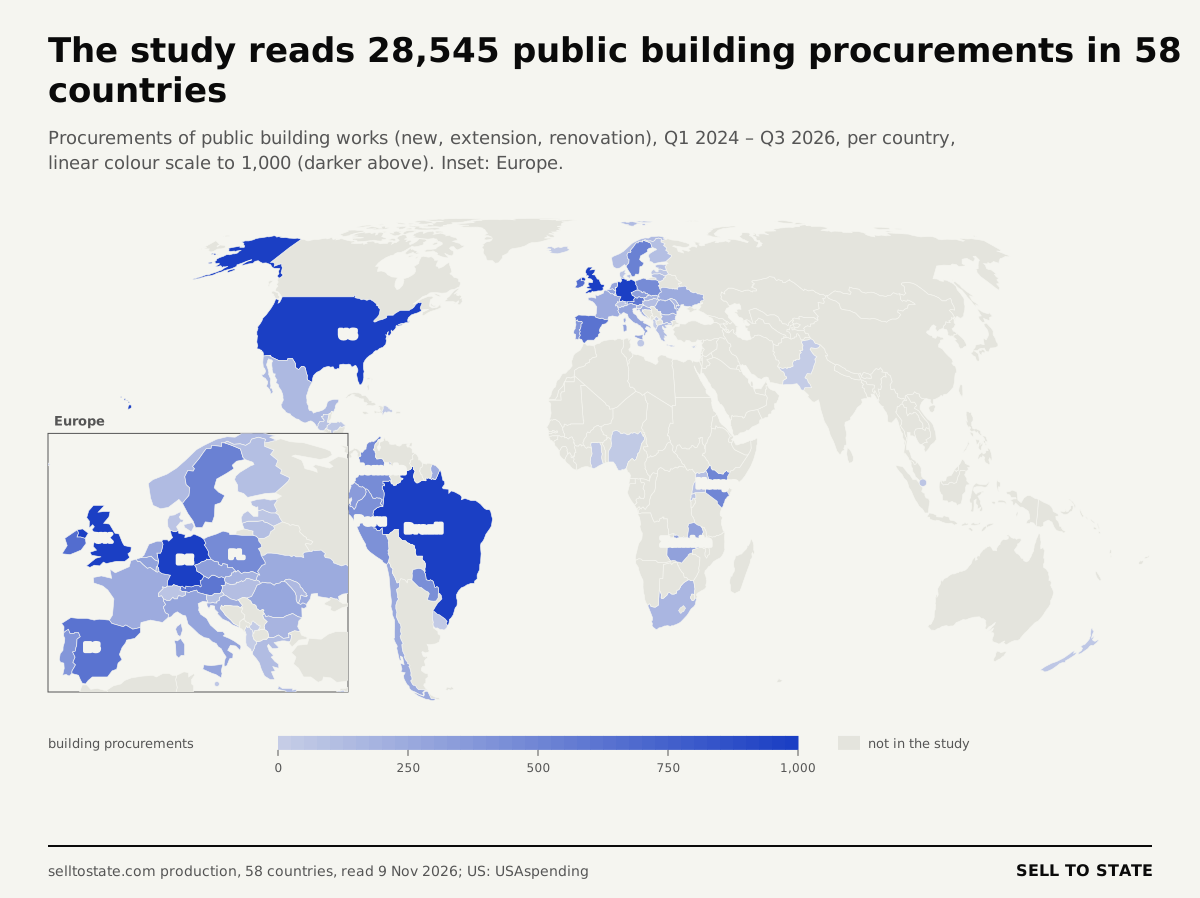
We read 28,545 public building procurements in 58 countries, from Q1 2024 to Q3 2026. They come from 61 sources in selltostate.com production: TED for the EU and EEA, and national portals from Brazil to Kenya. The United States counts through USAspending, with 3,092 federal building awards. 25,270 of the procurements are new buildings and extensions, and 3,275 are renovations.
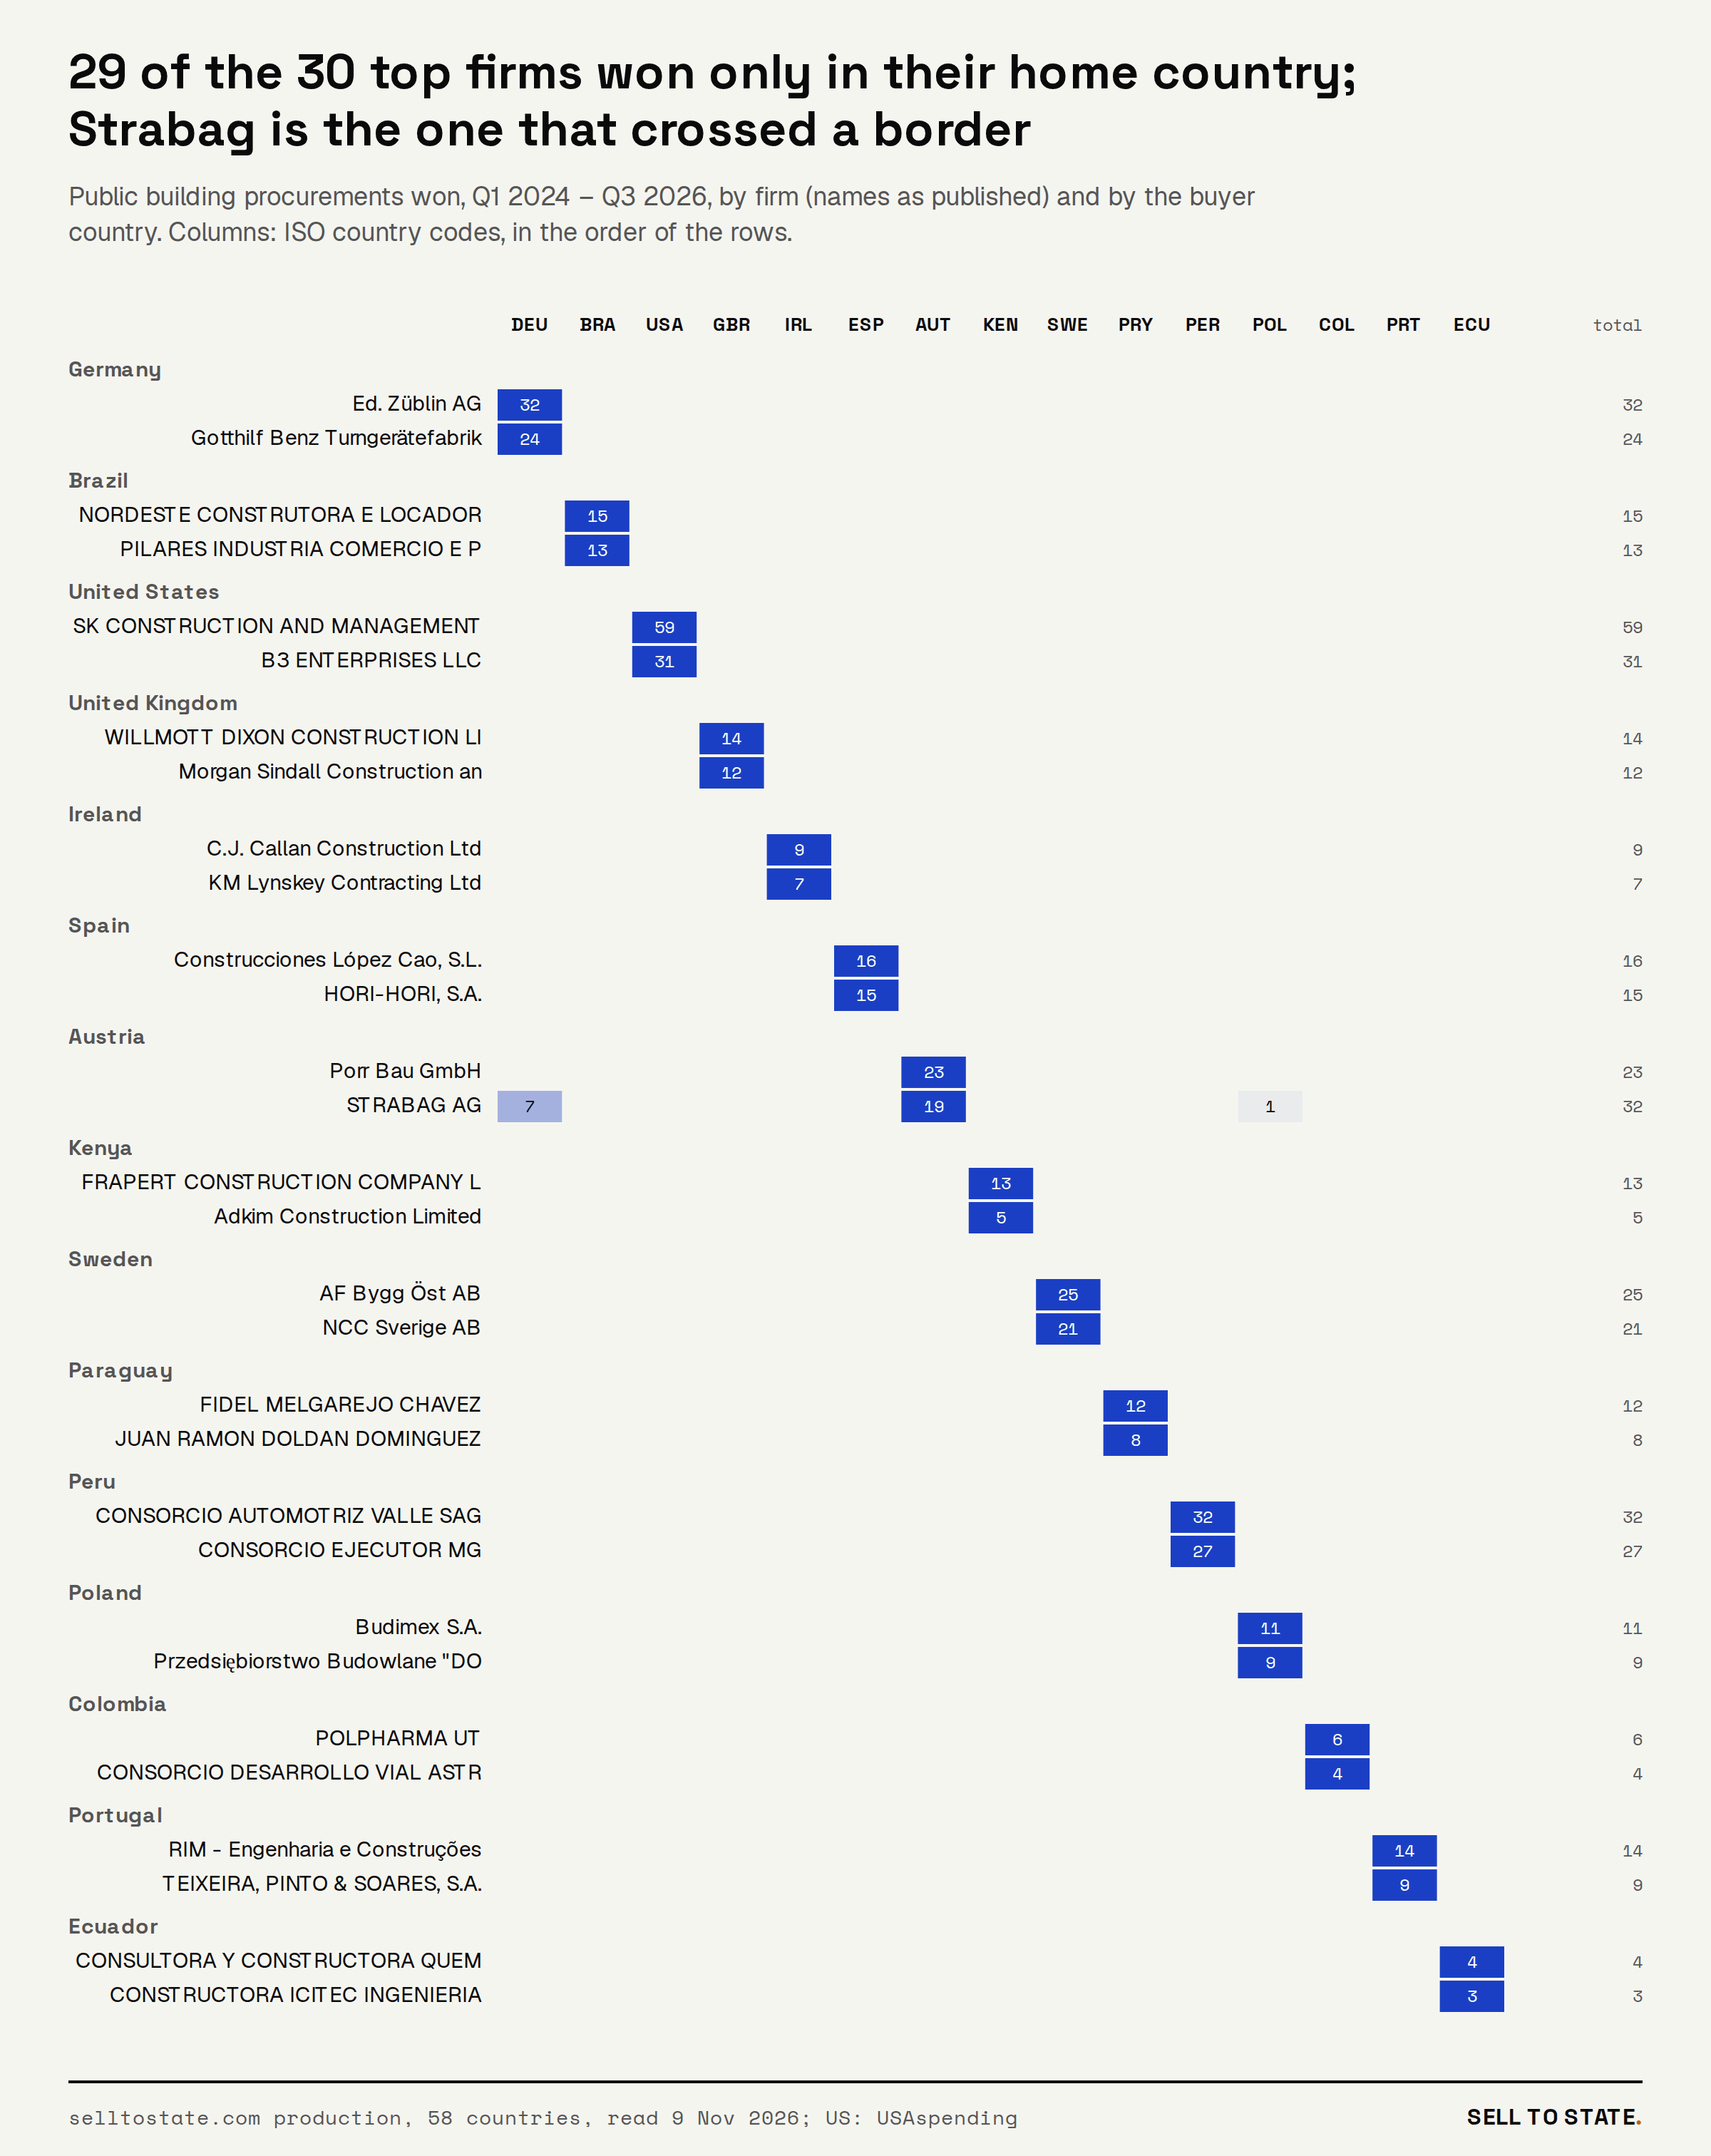
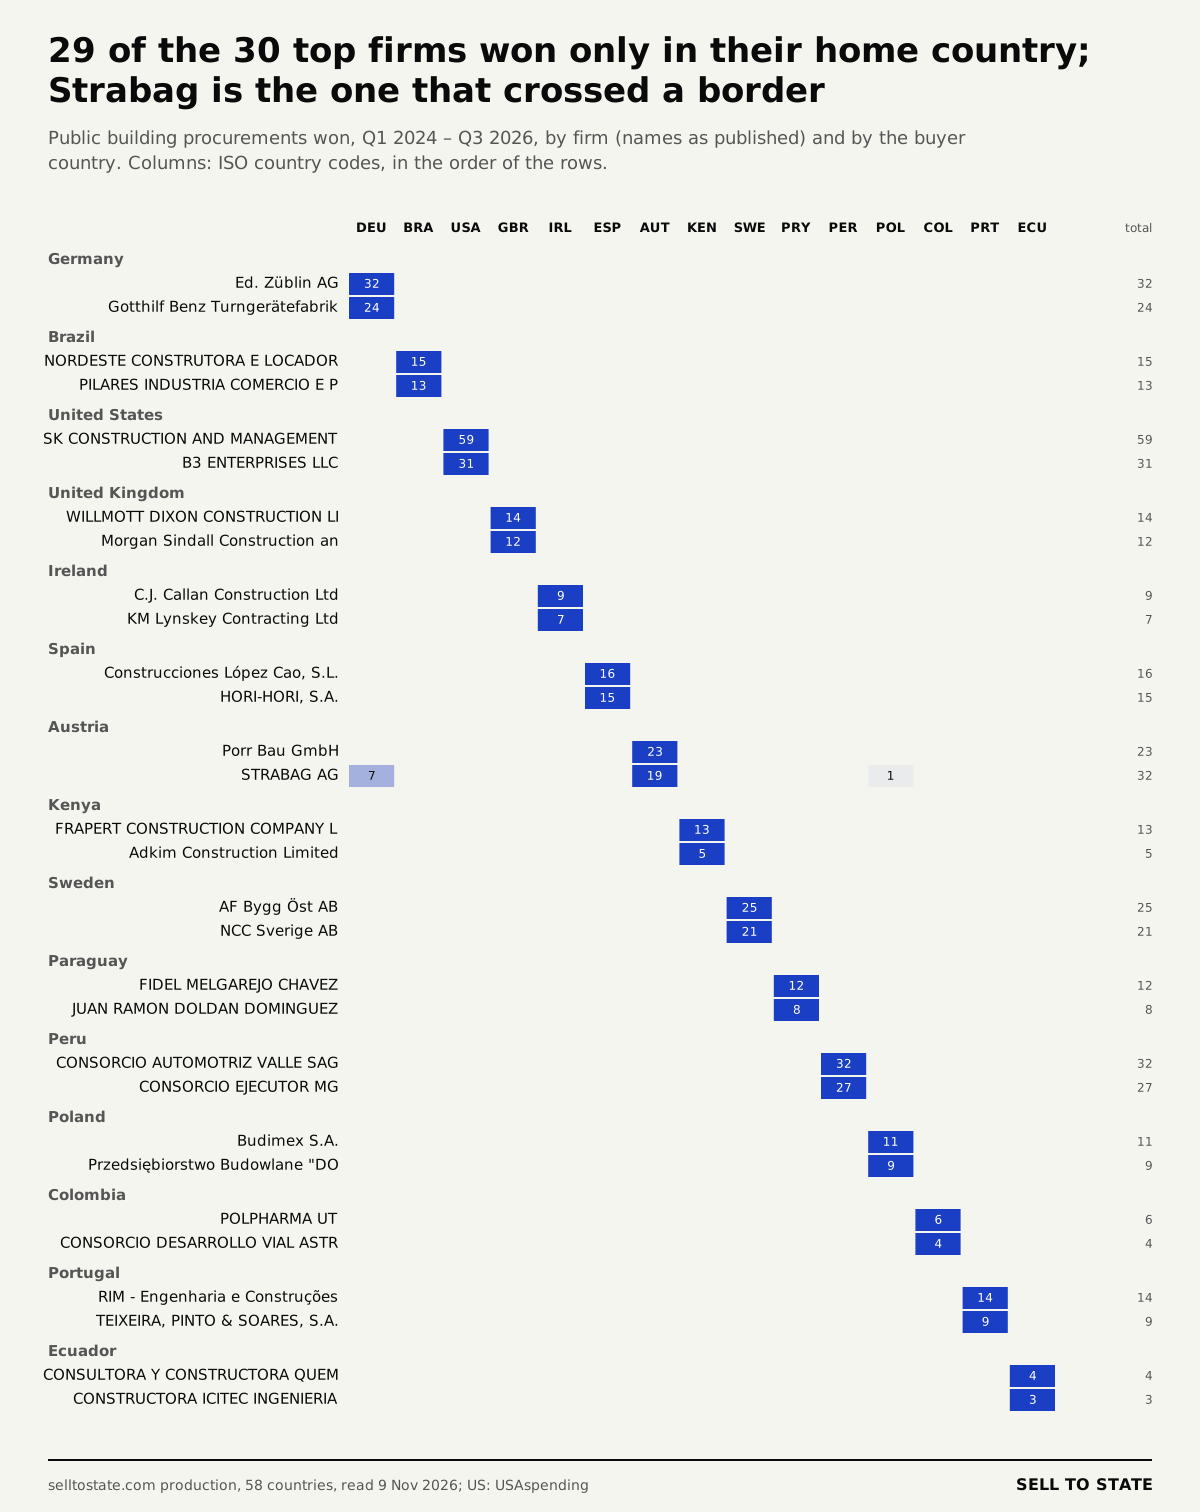
The firms that win the most public building contracts win at home. We took the two most frequent winners in each of the 15 largest countries in our data. 29 of these 30 firms never won a public building contract in another country. The exception is Strabag, the Austrian group: 19 of its 32 wins are in Austria, 7 in Germany and 1 in Poland.
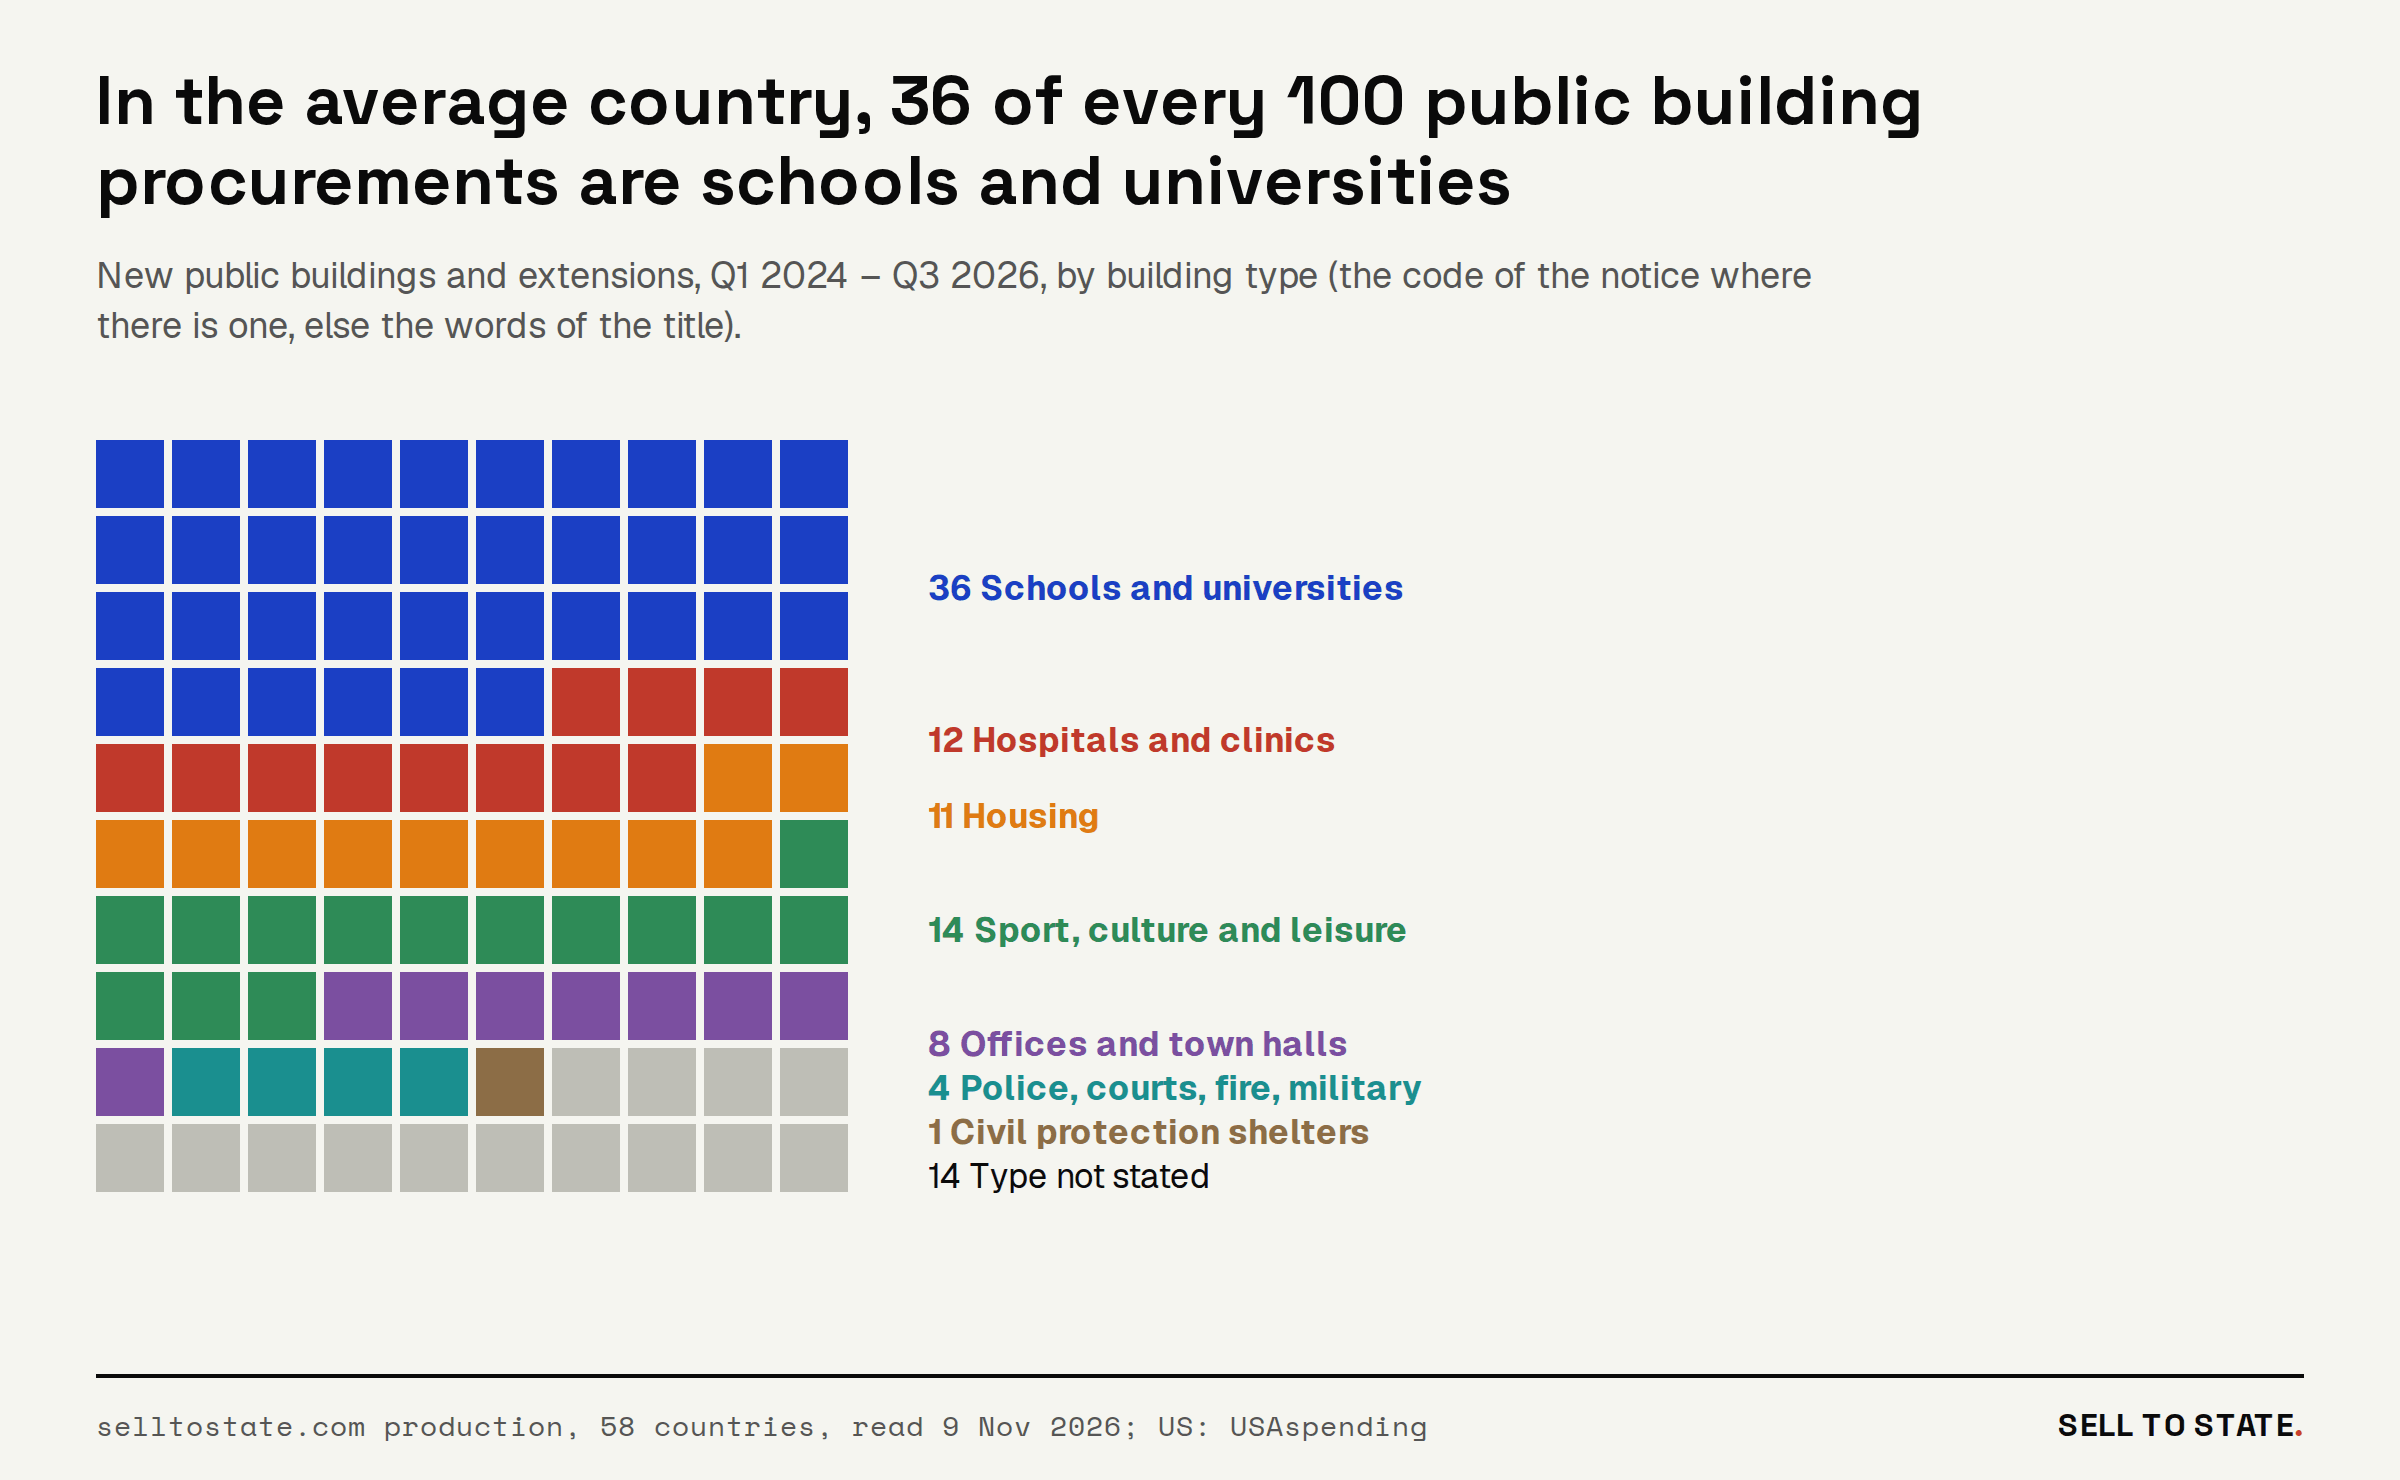
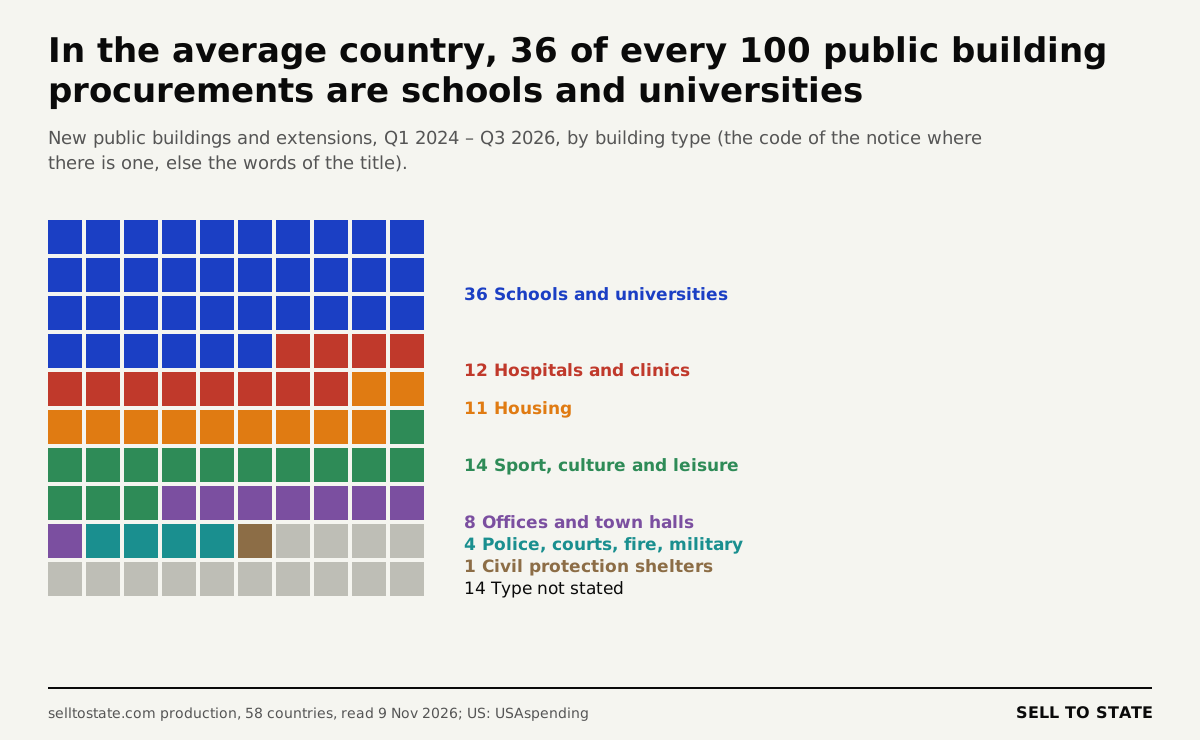
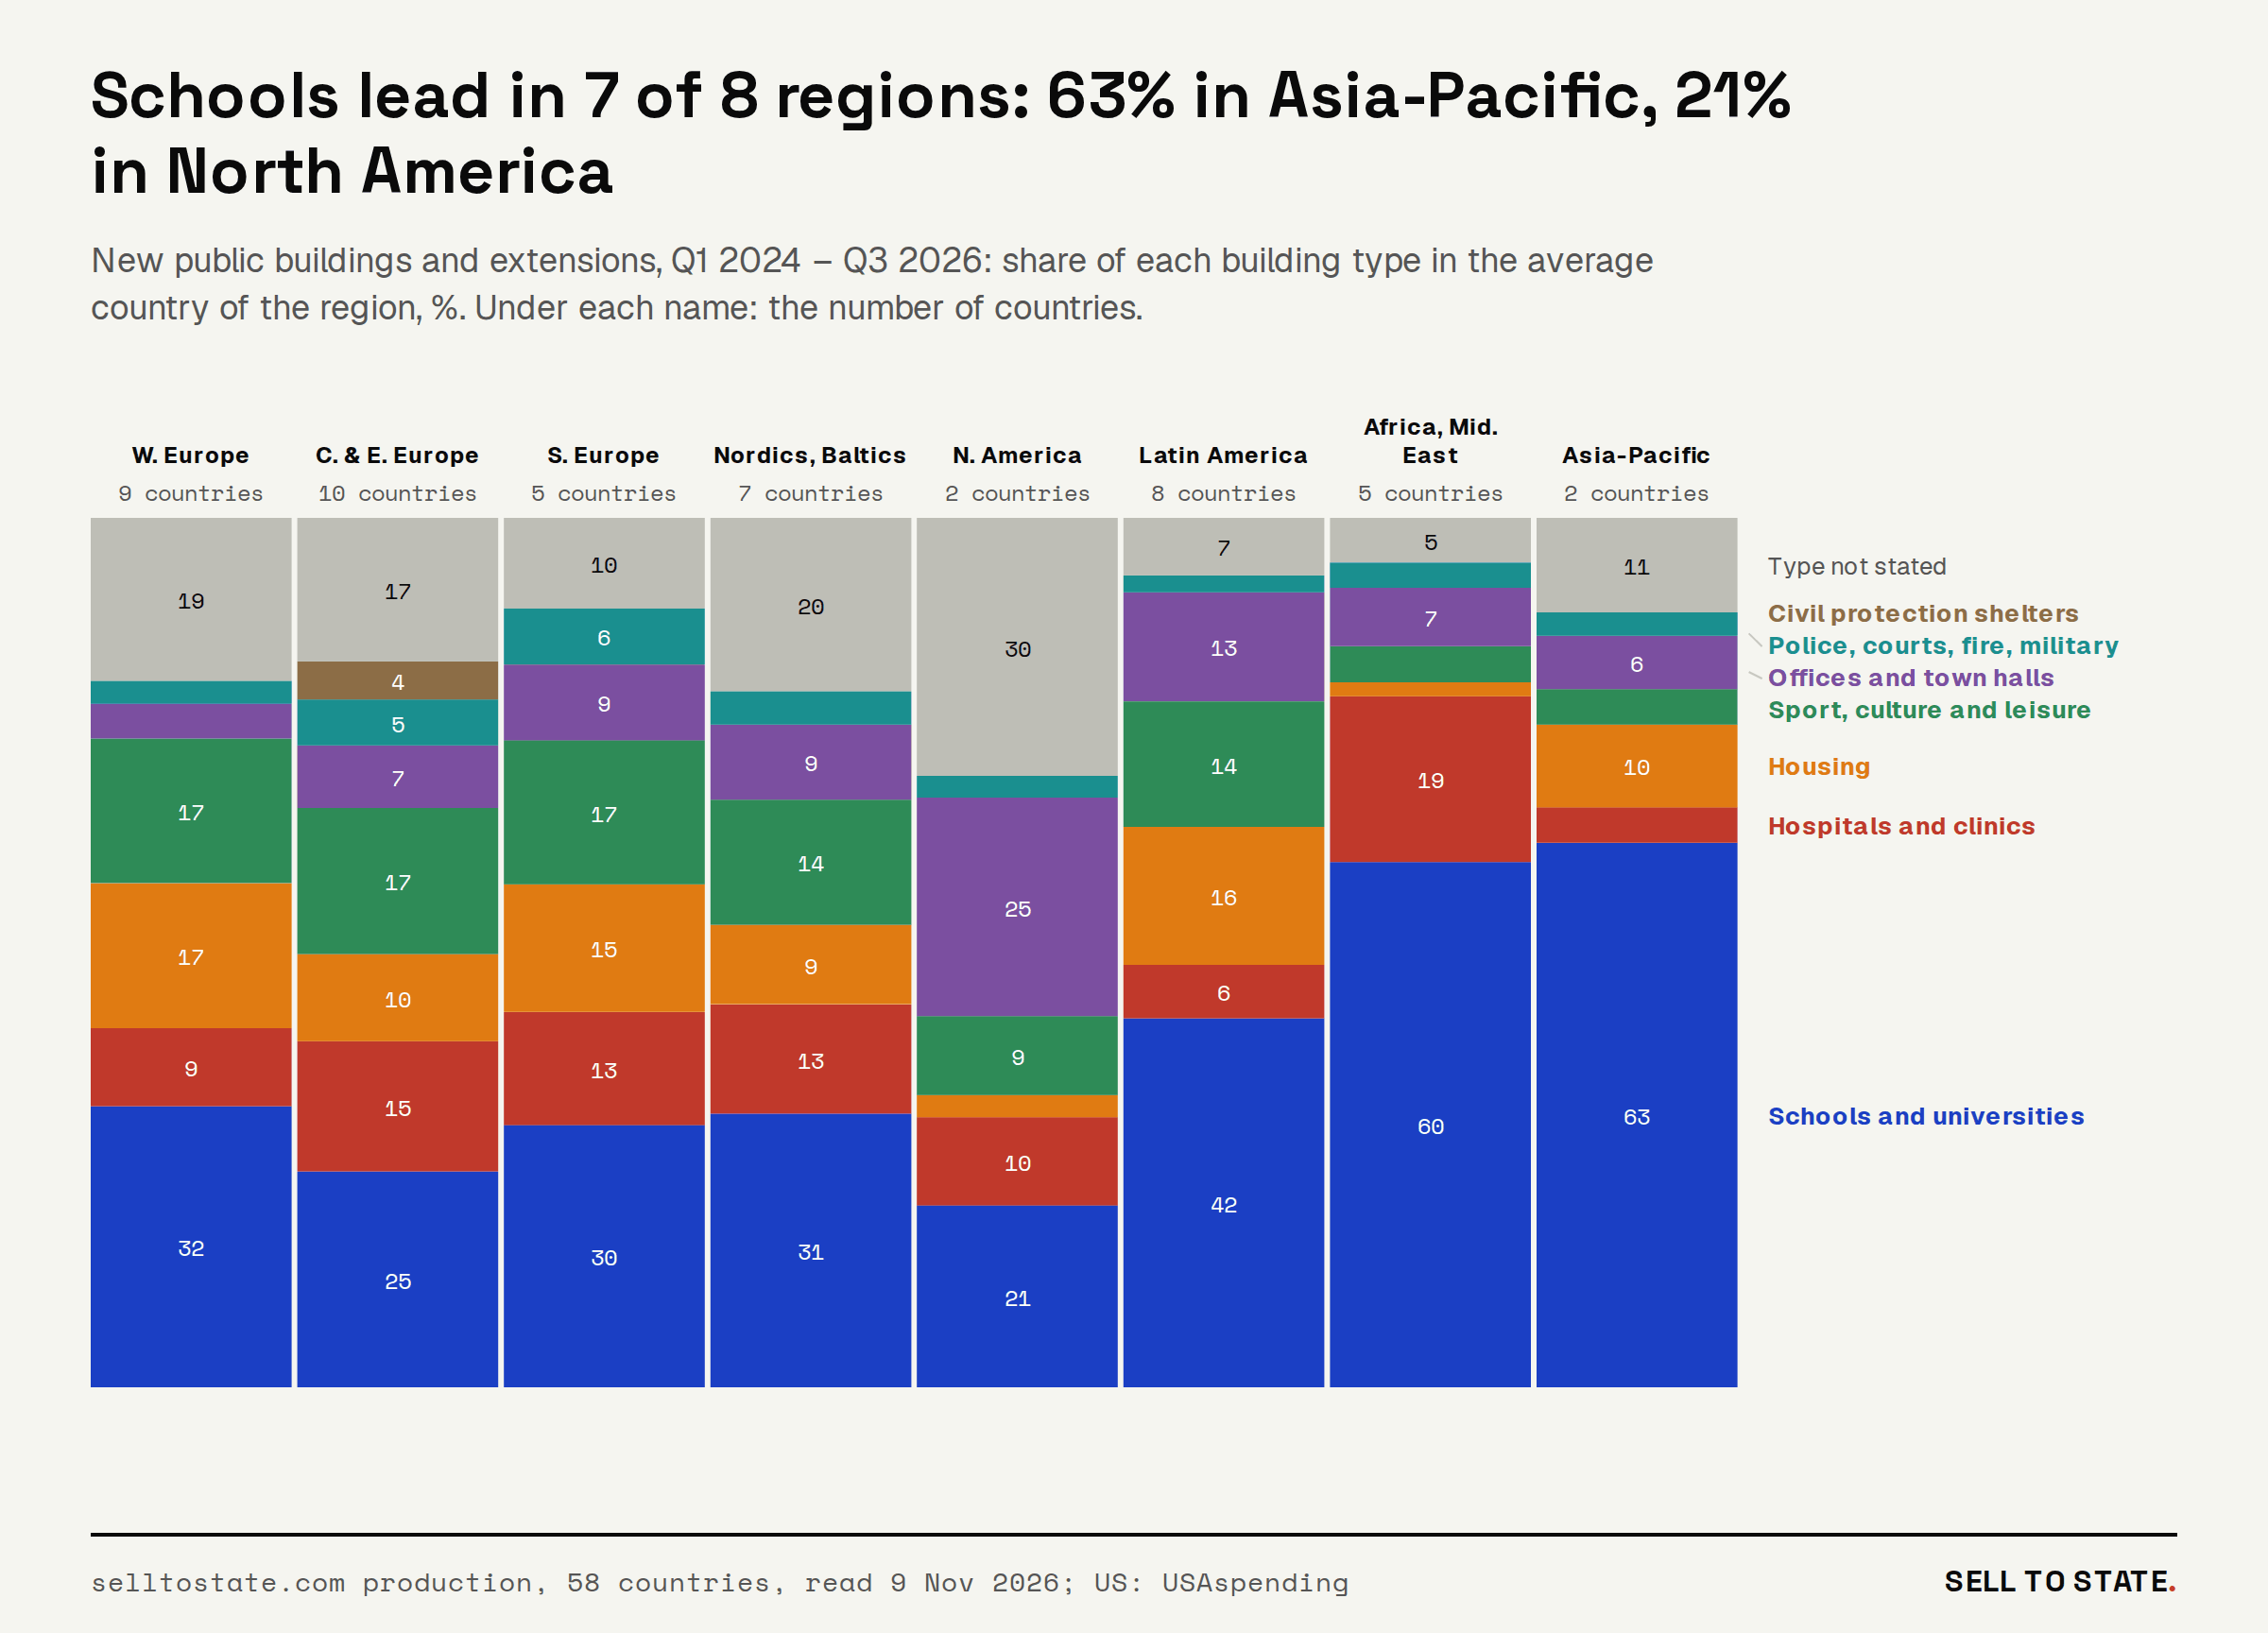
Schools are the building that governments buy most. In the average country, 36 of every 100 public building procurements are schools and universities. Schools lead in 7 of 8 regions, and in Africa they are 60.4% of public building procurements. North America is the exception: the US federal government builds offices, bases and clinics, and states build the schools.
Most public building contracts are small, and small firms win most of them where the source states the size. In Europe, small and medium firms win 73.2% of the award notices that state the winner size. In Colombia, the only country outside Europe that publishes the size, they win 39.8%.
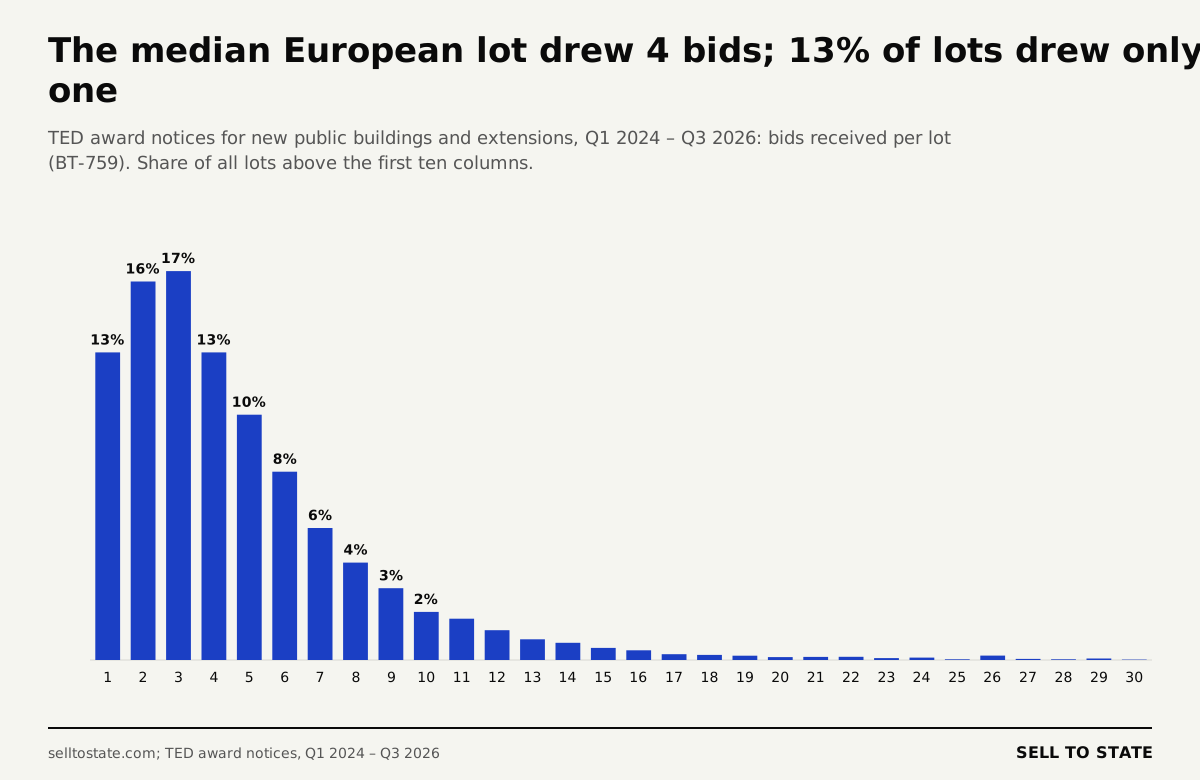
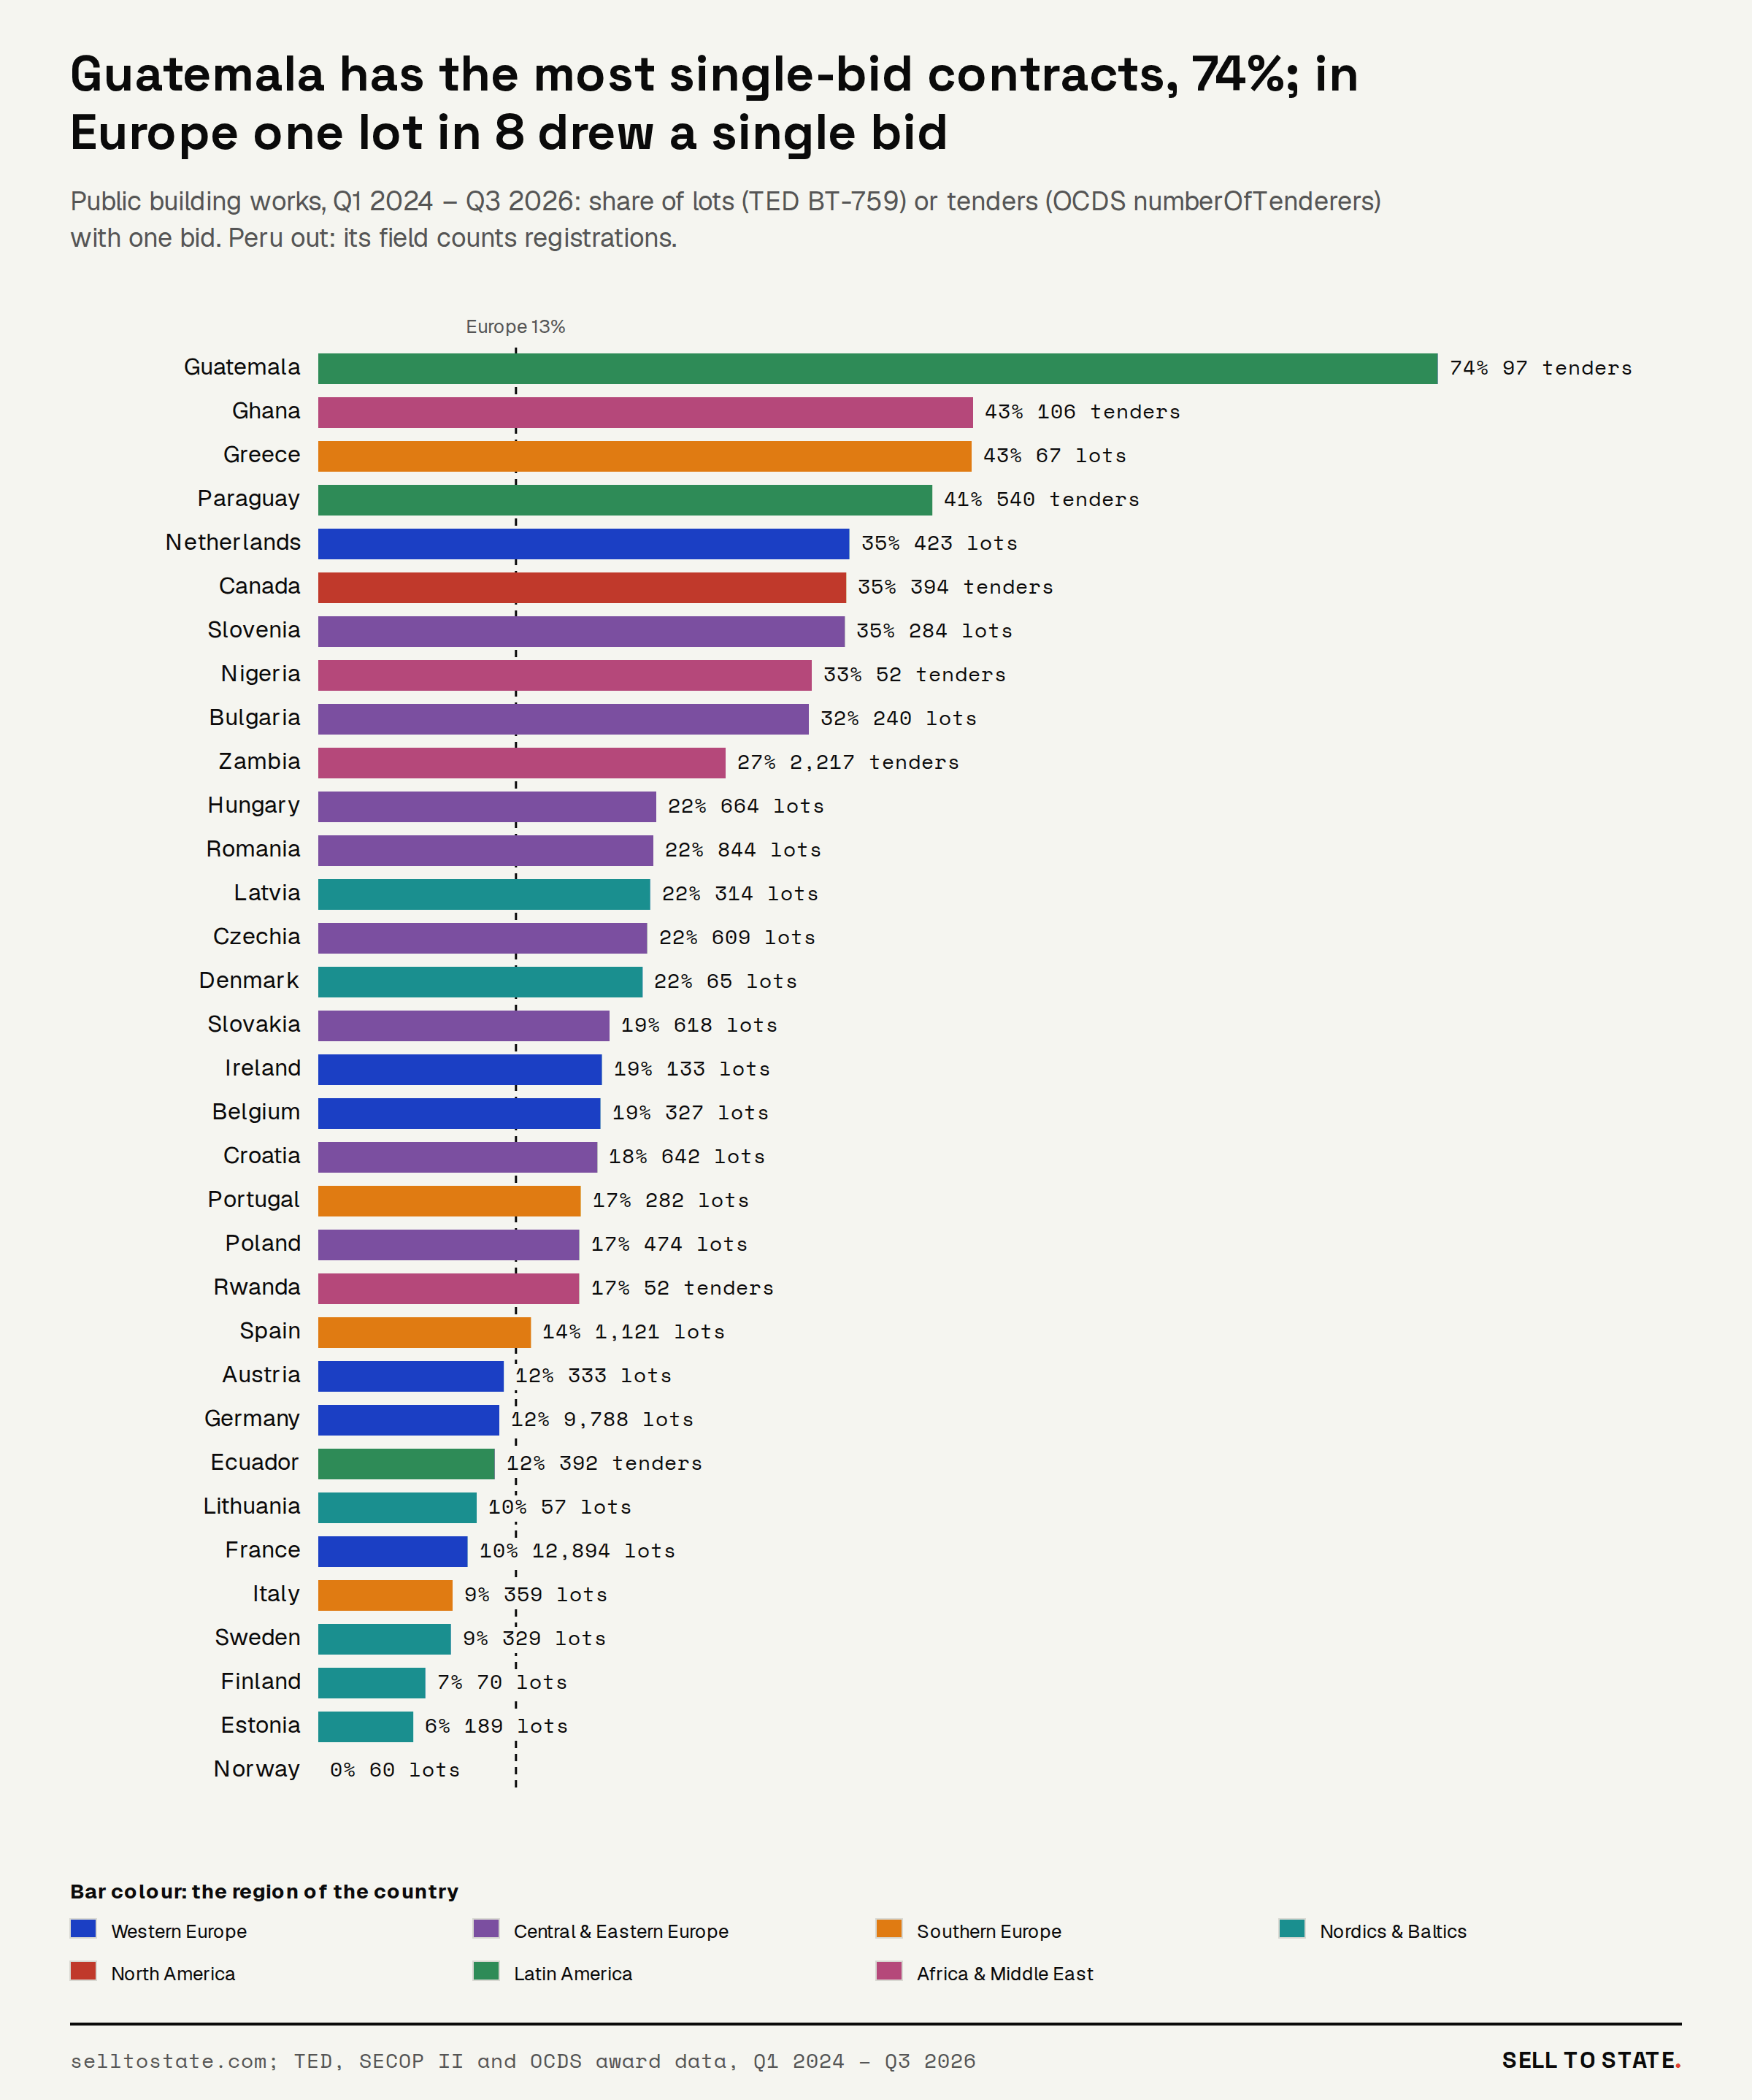
Competition is thin in some countries. The median European lot draws 4 bids, and 13.1% of lots draw a single bid. In Guatemala, 74.2% of the tenders for a public building drew one bid. In Ghana, 43.4% did.
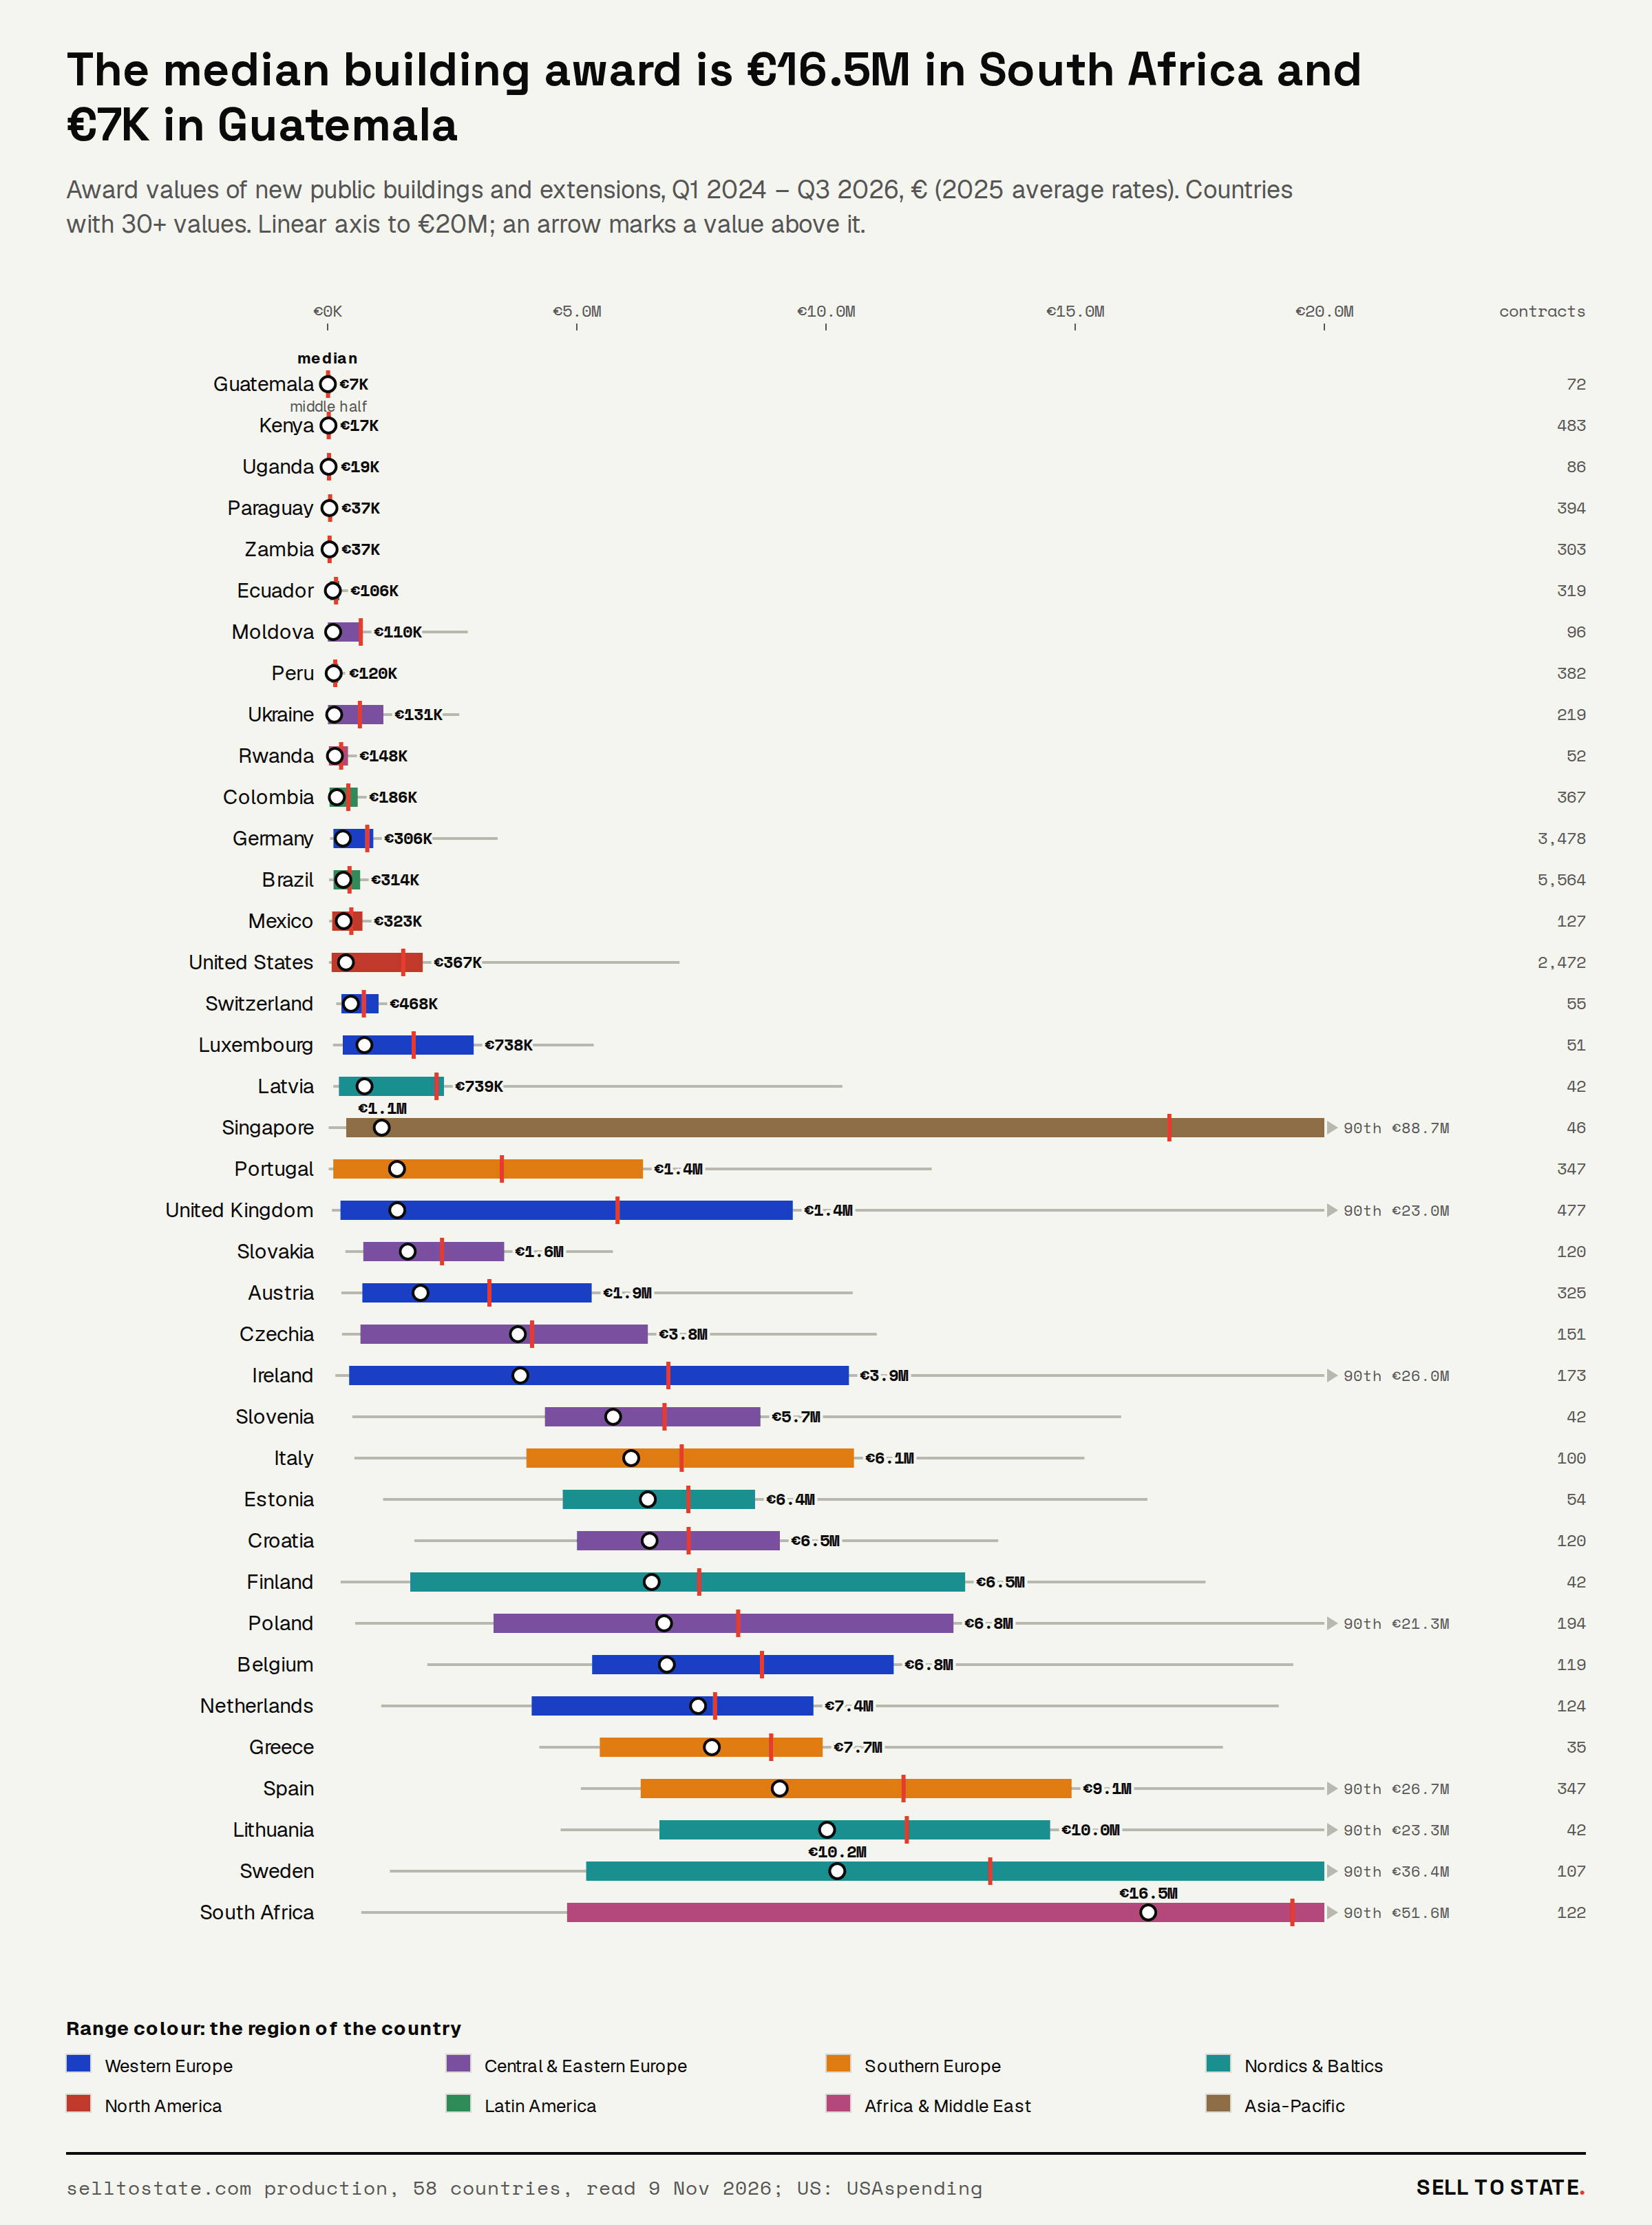
Published awards for public buildings add up to €56.9 billion, in 17,871 awards with a value in 52 countries. The median award is €16.5 million in South Africa and €6,843 in Guatemala.
Methodology: 28,545 building procurements from 61 sources in 58 countries
We took all procurements of works on public buildings from Q1 2024 to Q3 2026 from selltostate.com production, for every live market. We read production on 9 November 2026, with read-only queries. Production holds 12 US building awards, so for the United States we use our USAspending pull of 21 October 2026.
- Two layers. Layer one is every country in production: what governments build, who wins in each country, and the money. Layer two holds the fields that some sources publish: the winner size (TED, SECOP II), the bids per lot or per tender (TED, 8 OCDS publishers) and the winner country (TED). These fields come from our pulls of 21 October 2026.
- What one record is. One production procurement: the buyer and the first words of the title, the key that selltostate.com uses for its counts. A TED notice with several lots is one procurement.
- How we find building works. A building code (CPV 4521 or a national building code) or two kinds of title words: a construction word ("construction of", "construcción de", "construção de", "Neubau", "budowa", "будівництво") and a building or a building type. In the words-only group, the thing that is built must be a building. "Construction of a water system at a primary school" names the school as the place and is out.
- What is out. Roads, bridges, water and sewer networks, fences, parks, sports pitches without a roof, supplies, design and supervision services, legal and survey services, framework ceilings in the money. The production feeds of Canada (11,780 records) and Australia (517) publish a spend category in place of a title. Tanzania and Uzbekistan publish no usable titles. Chile’s records are small purchase orders, so Chile is out of the money.
- Kind of work. New building, extension or renovation, from the words of the title. A title that names a renovation, a repair or an energy upgrade without a new building is a renovation.
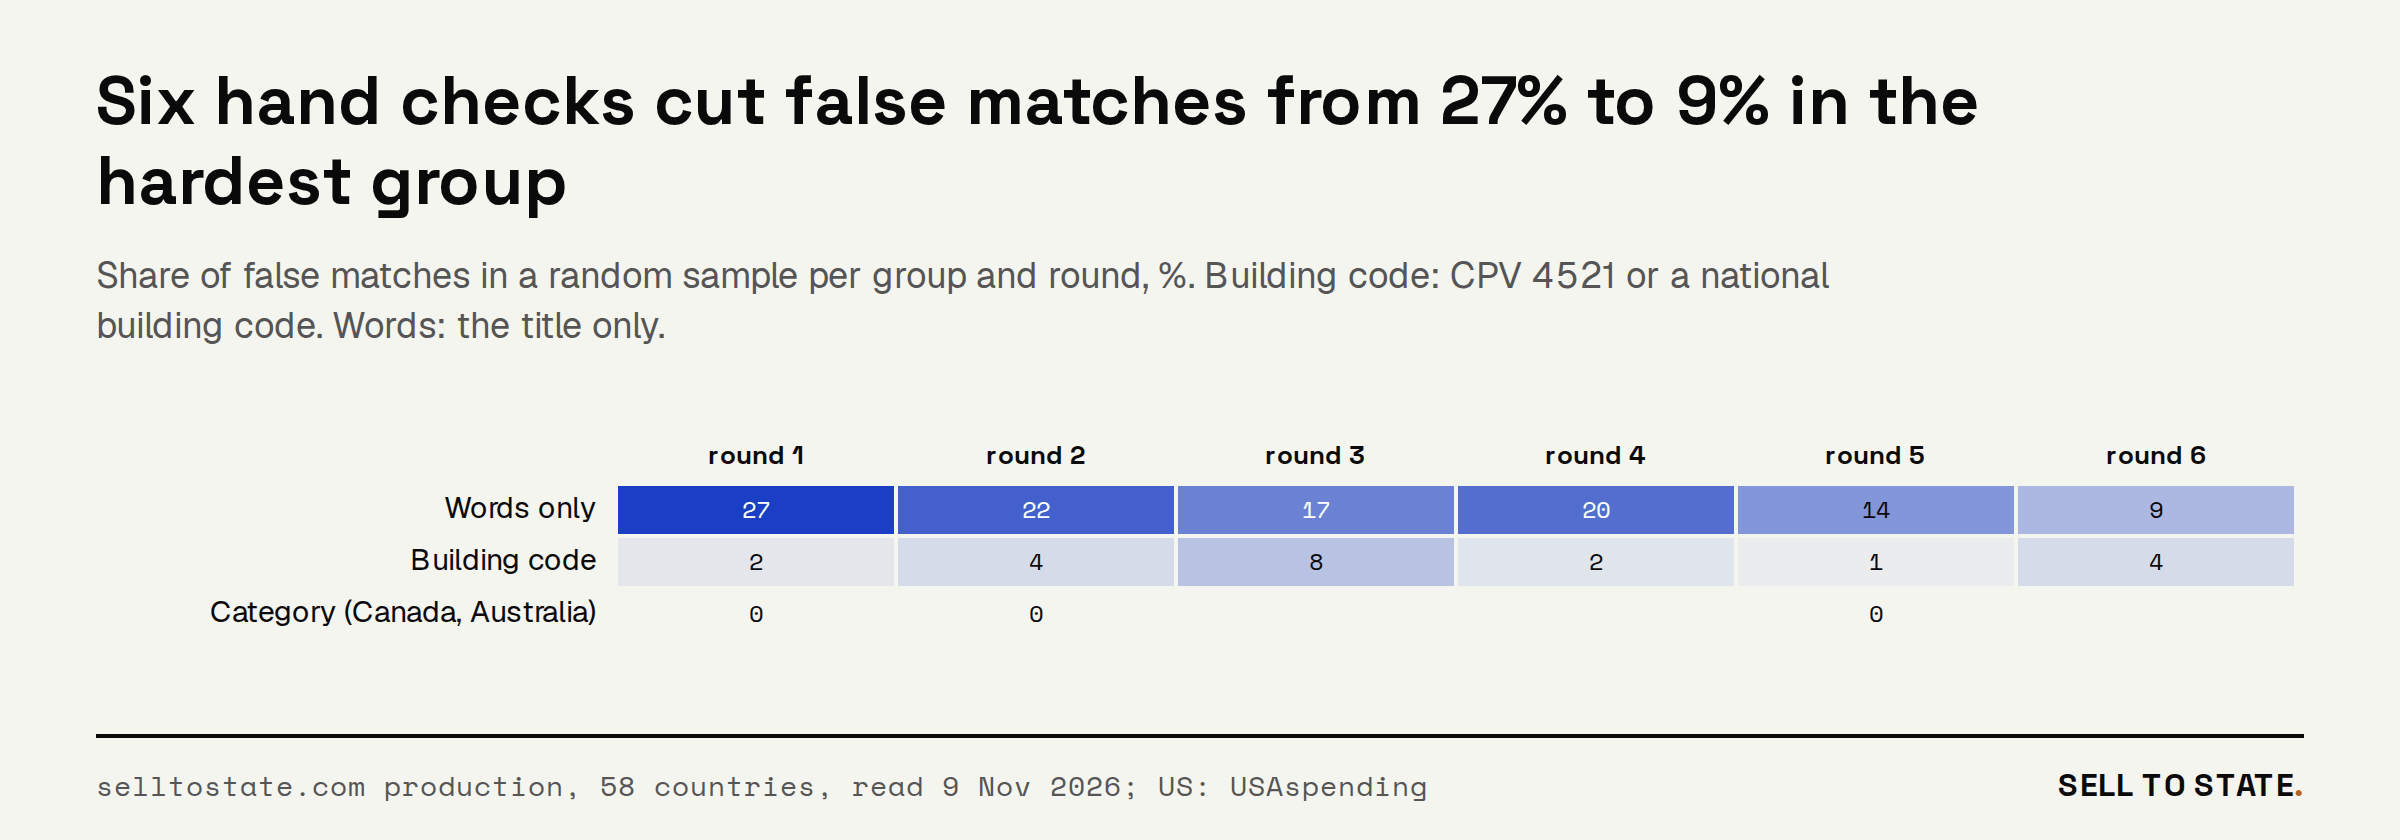
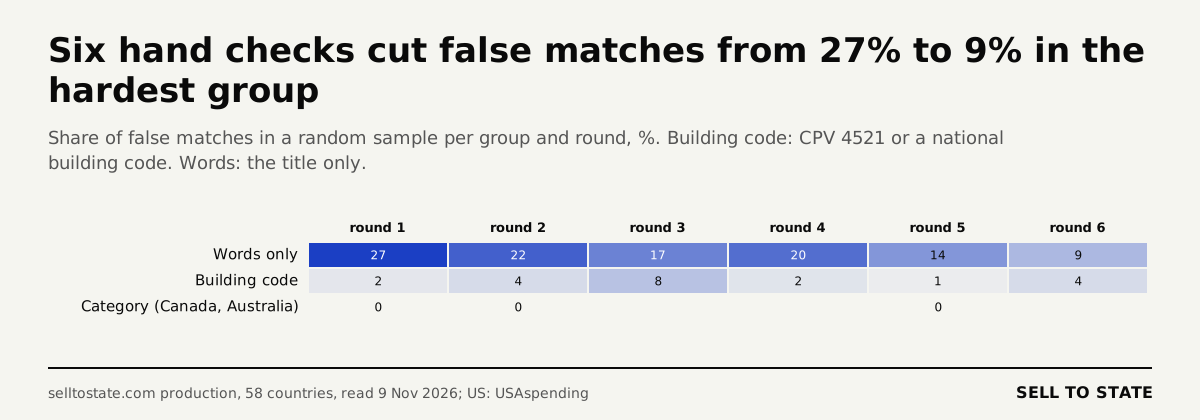
- How good the search is. We drew a random sample in each round, with at most 10 records per country, and labelled each record by hand. Round 1 found 27% false matches in the words-only group and 2.1% in the code group. After rounds 1 to 5 we added the rules that the false matches showed. Round 6 only measured: 9% false matches in the words-only group, 3.8% in the code group. TED records went through 7 rounds in our earlier pull; the last TED round found 4 false matches in 100.
- Winners. Names as published, with case, punctuation and legal forms folded. We do not merge groups or subsidiaries. In Portugal, 189 production awards carry a winner that does not match the work (a medical device firm as the builder of a housing block). We count these winners as unknown. A winner named "interventoría" in Colombia is the works supervisor, so its 38 records are out.
- Values. Euro at 2025 average rates. We leave out framework ceilings and values under €9. We read every value of €250 million and more by hand: 15 values, of which we kept 5 and dropped 10 as value errors, ceilings or contracts with years of operation in the value.
- Equal weights. A portal that publishes every small contract has many more records than TED. So the mix of building types and the value of a building type count each country the same.
- What the study does not show. The records are calls for competition and awards. They do not show payments, cost overruns, delays or subcontractors.
The limits of the data
- Sources differ. TED shows works contracts above the EU threshold. National portals in Latin America and Africa show every contract, down to one classroom. Compare a country with itself first.
- Some fields exist in some sources only. The winner size comes from TED and from SECOP II in Colombia. The number of bids comes from TED and from 8 OCDS publishers outside Europe. The winner country comes from TED only.
- Two feeds are out. The production feeds of Canada and Australia publish a spend category in place of a title, so they can not show what is built or who builds it.
- The hand check. We read 1,180 records outside TED by hand in 6 rounds. In the last round, 3.8% of the records with a building code and 9% of the records found by words were false matches.
- Values are a floor. 17,871 awards state a usable value. Many awards publish none, so every total is lower than the market.
What governments build: schools first, in every region but North America
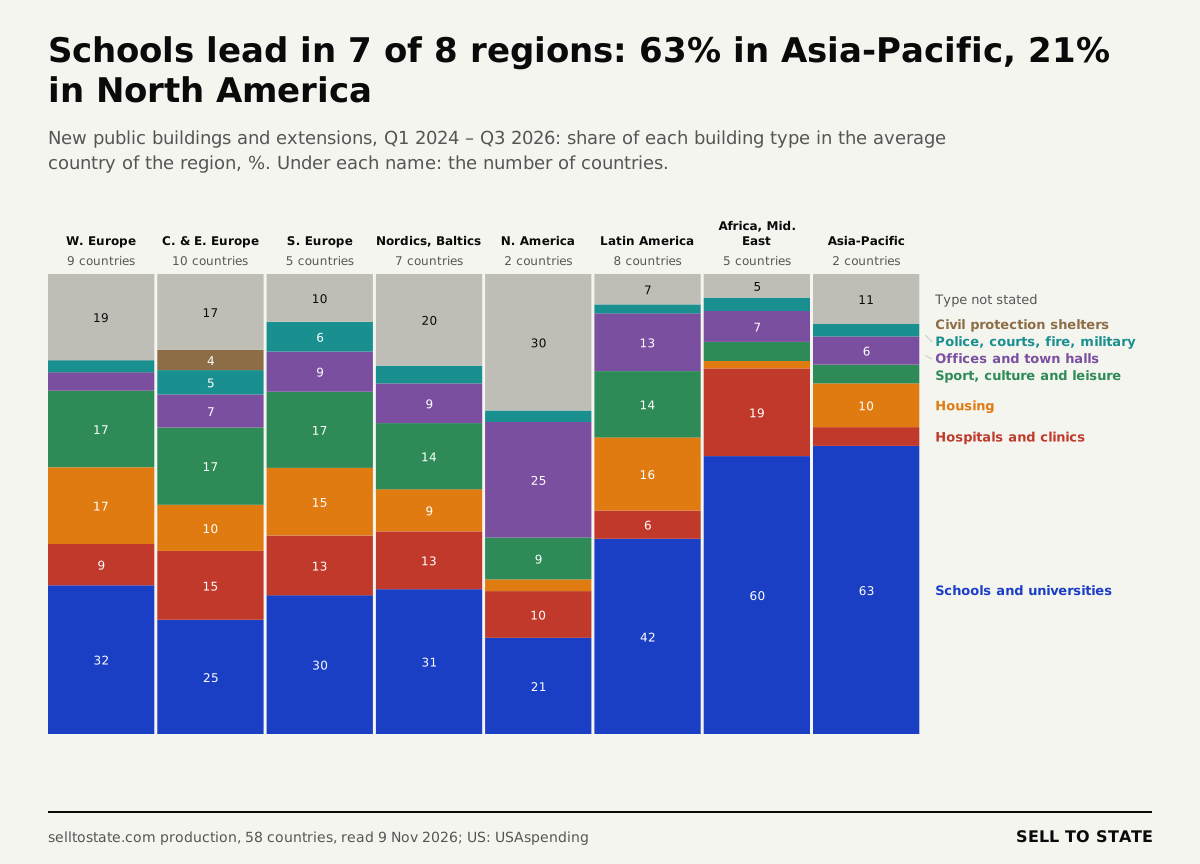
In the average country, schools and universities are 35.8% of public building procurements. Sport, culture and leisure buildings are 13.8%, hospitals and clinics 11.6%, housing 11.4% and offices and town halls 8.5%. Police stations, courts, fire stations and military buildings are 3.7%. 14.3% of the procurements name no building type. Each of the 48 countries with 30 or more building procurements counts the same.
Schools lead in 7 of 8 regions. In Africa, schools are 60.4% of public building procurements, and in Latin America 42.4%. Kenya and Zambia tender single classrooms and classroom blocks for primary schools. Paraguay tenders school kitchens and single classrooms. In North America, schools are 20.9%; offices are 25.1%, and 29.7% of the procurements name no type.
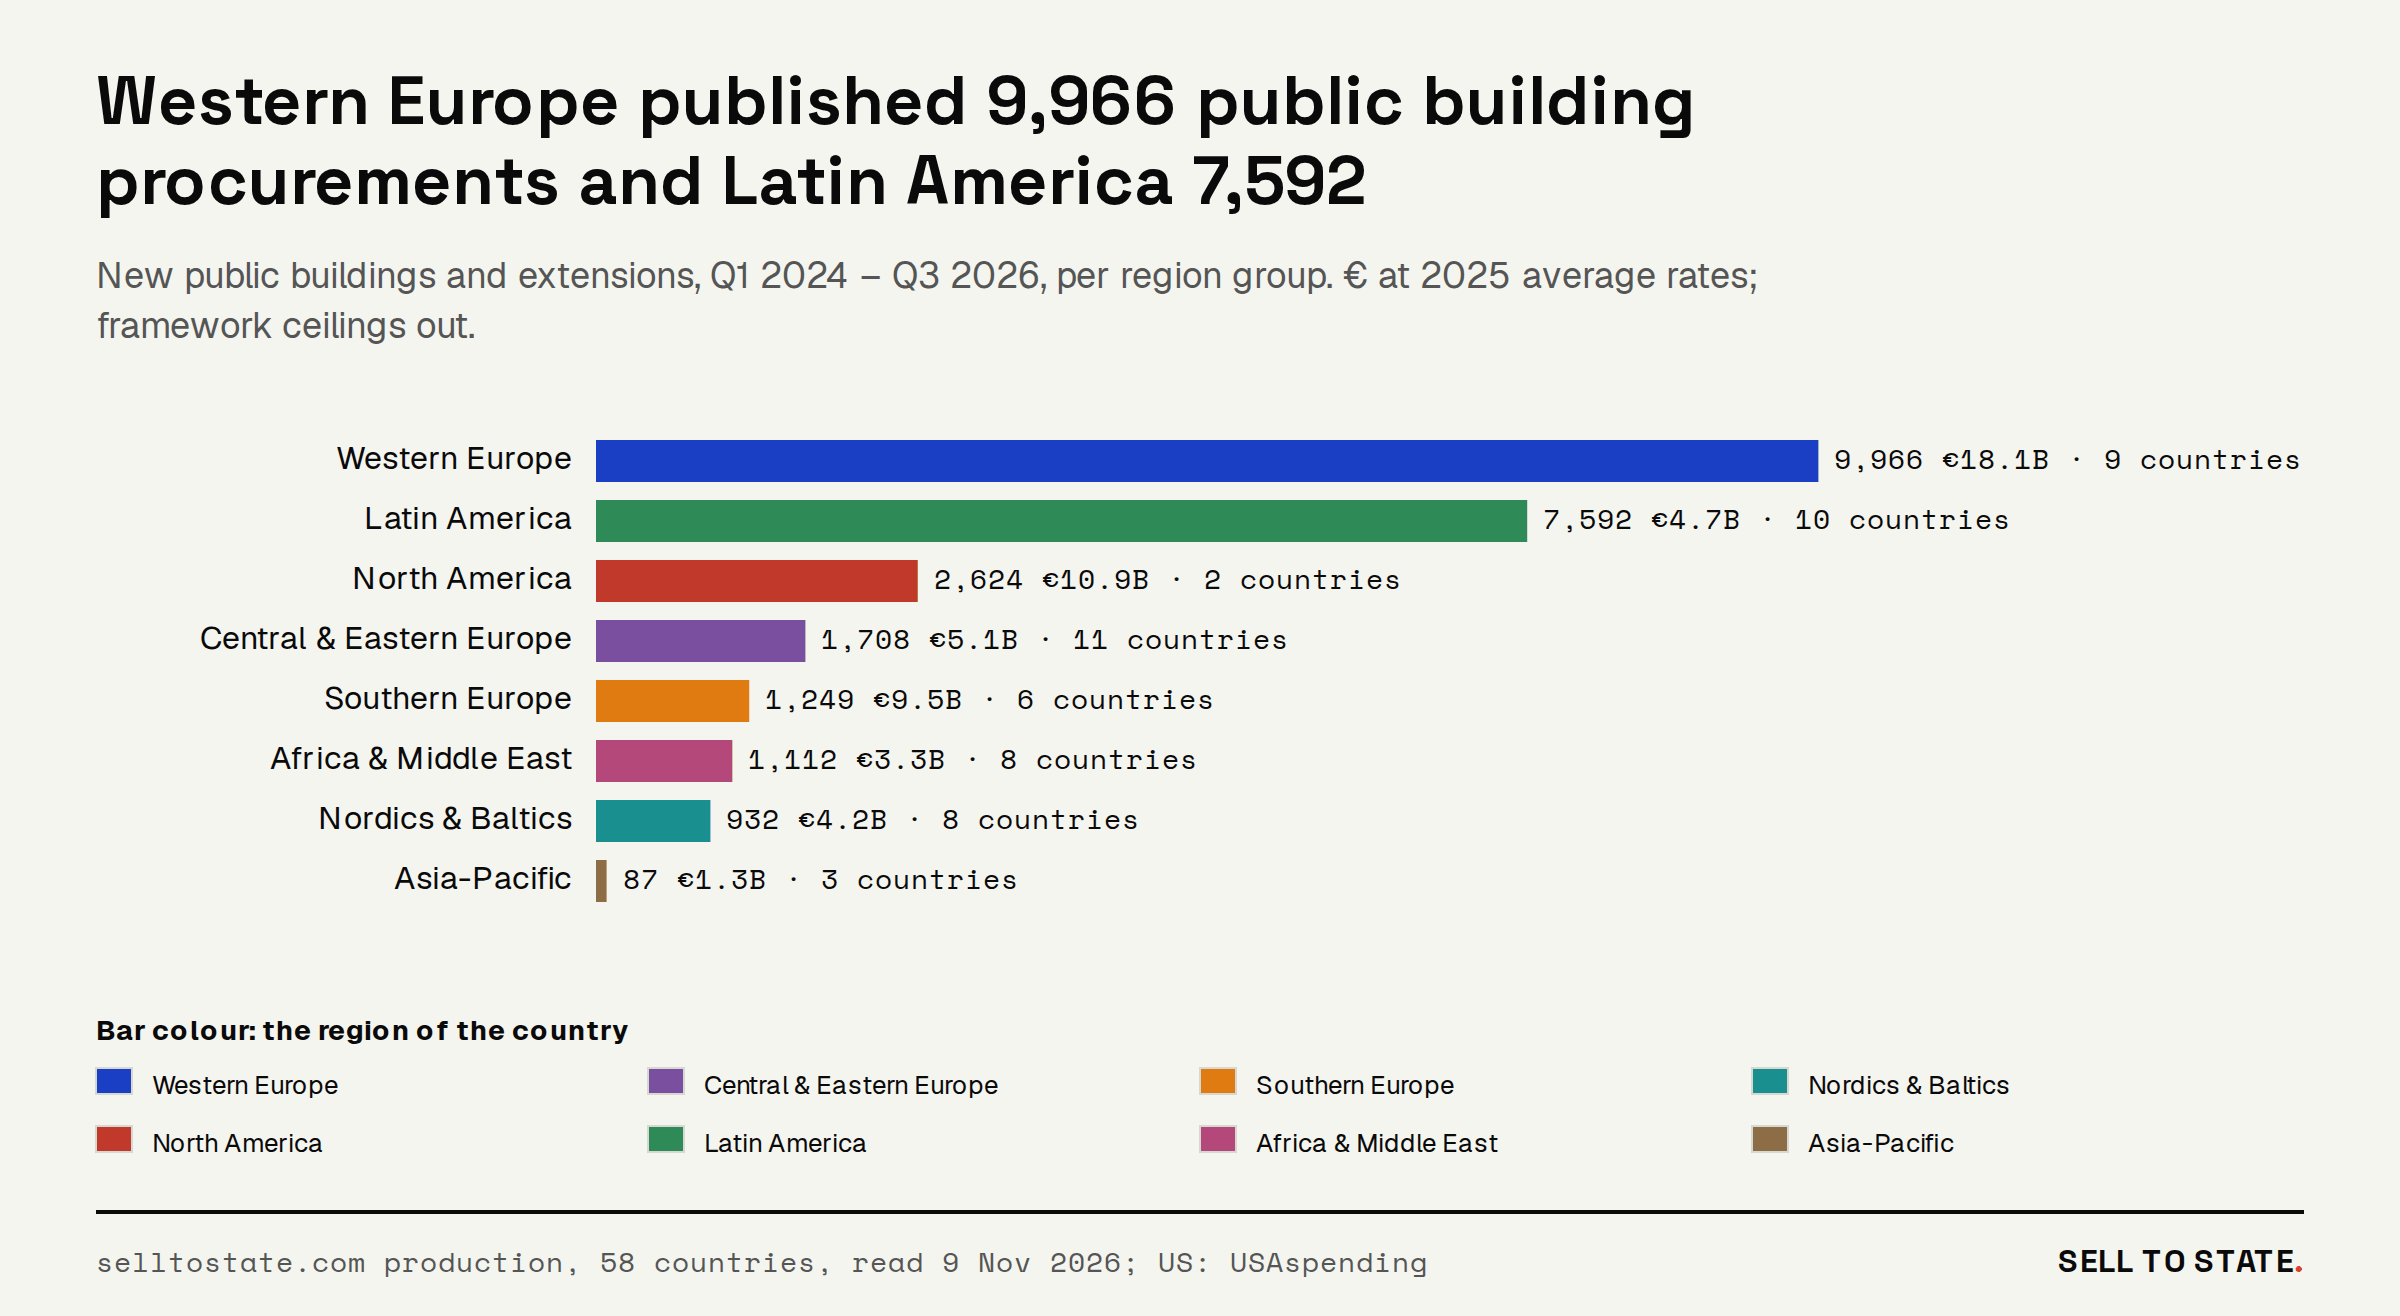
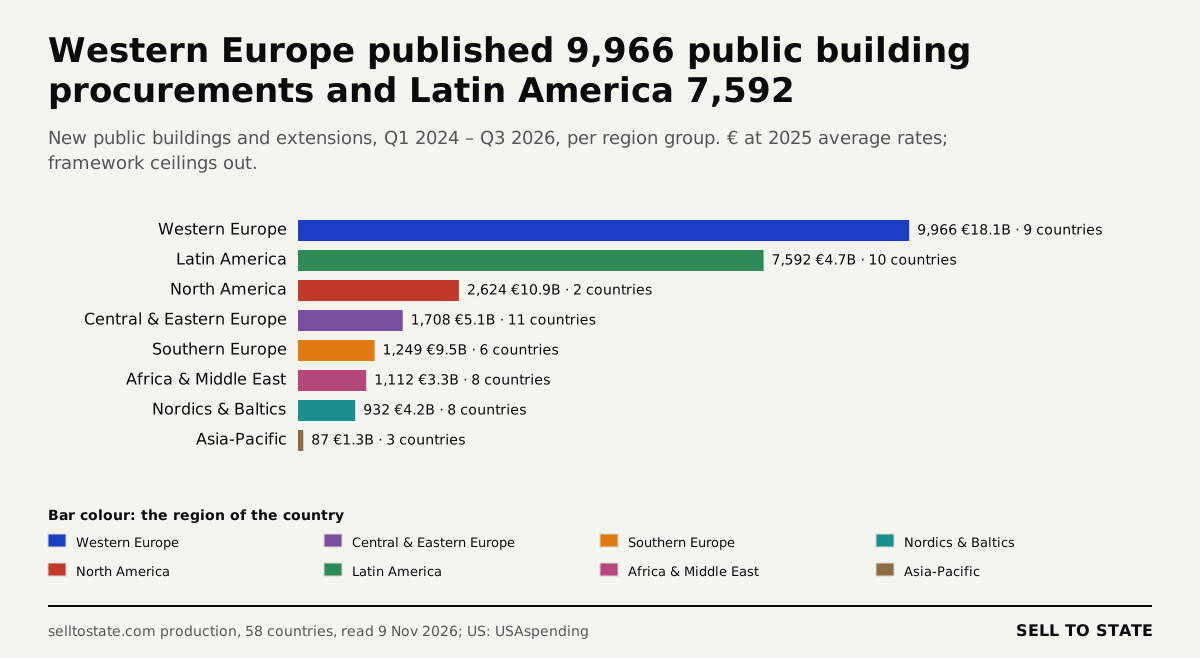
Western Europe and Latin America publish the most public building procurements. Western Europe published 9,966 for new buildings and extensions, with €18.1 billion in published award value. Latin America published 7,592, with €4.7 billion, because its portals list small contracts. North America published 2,624, worth €10.9 billion: the US federal contracts are large.
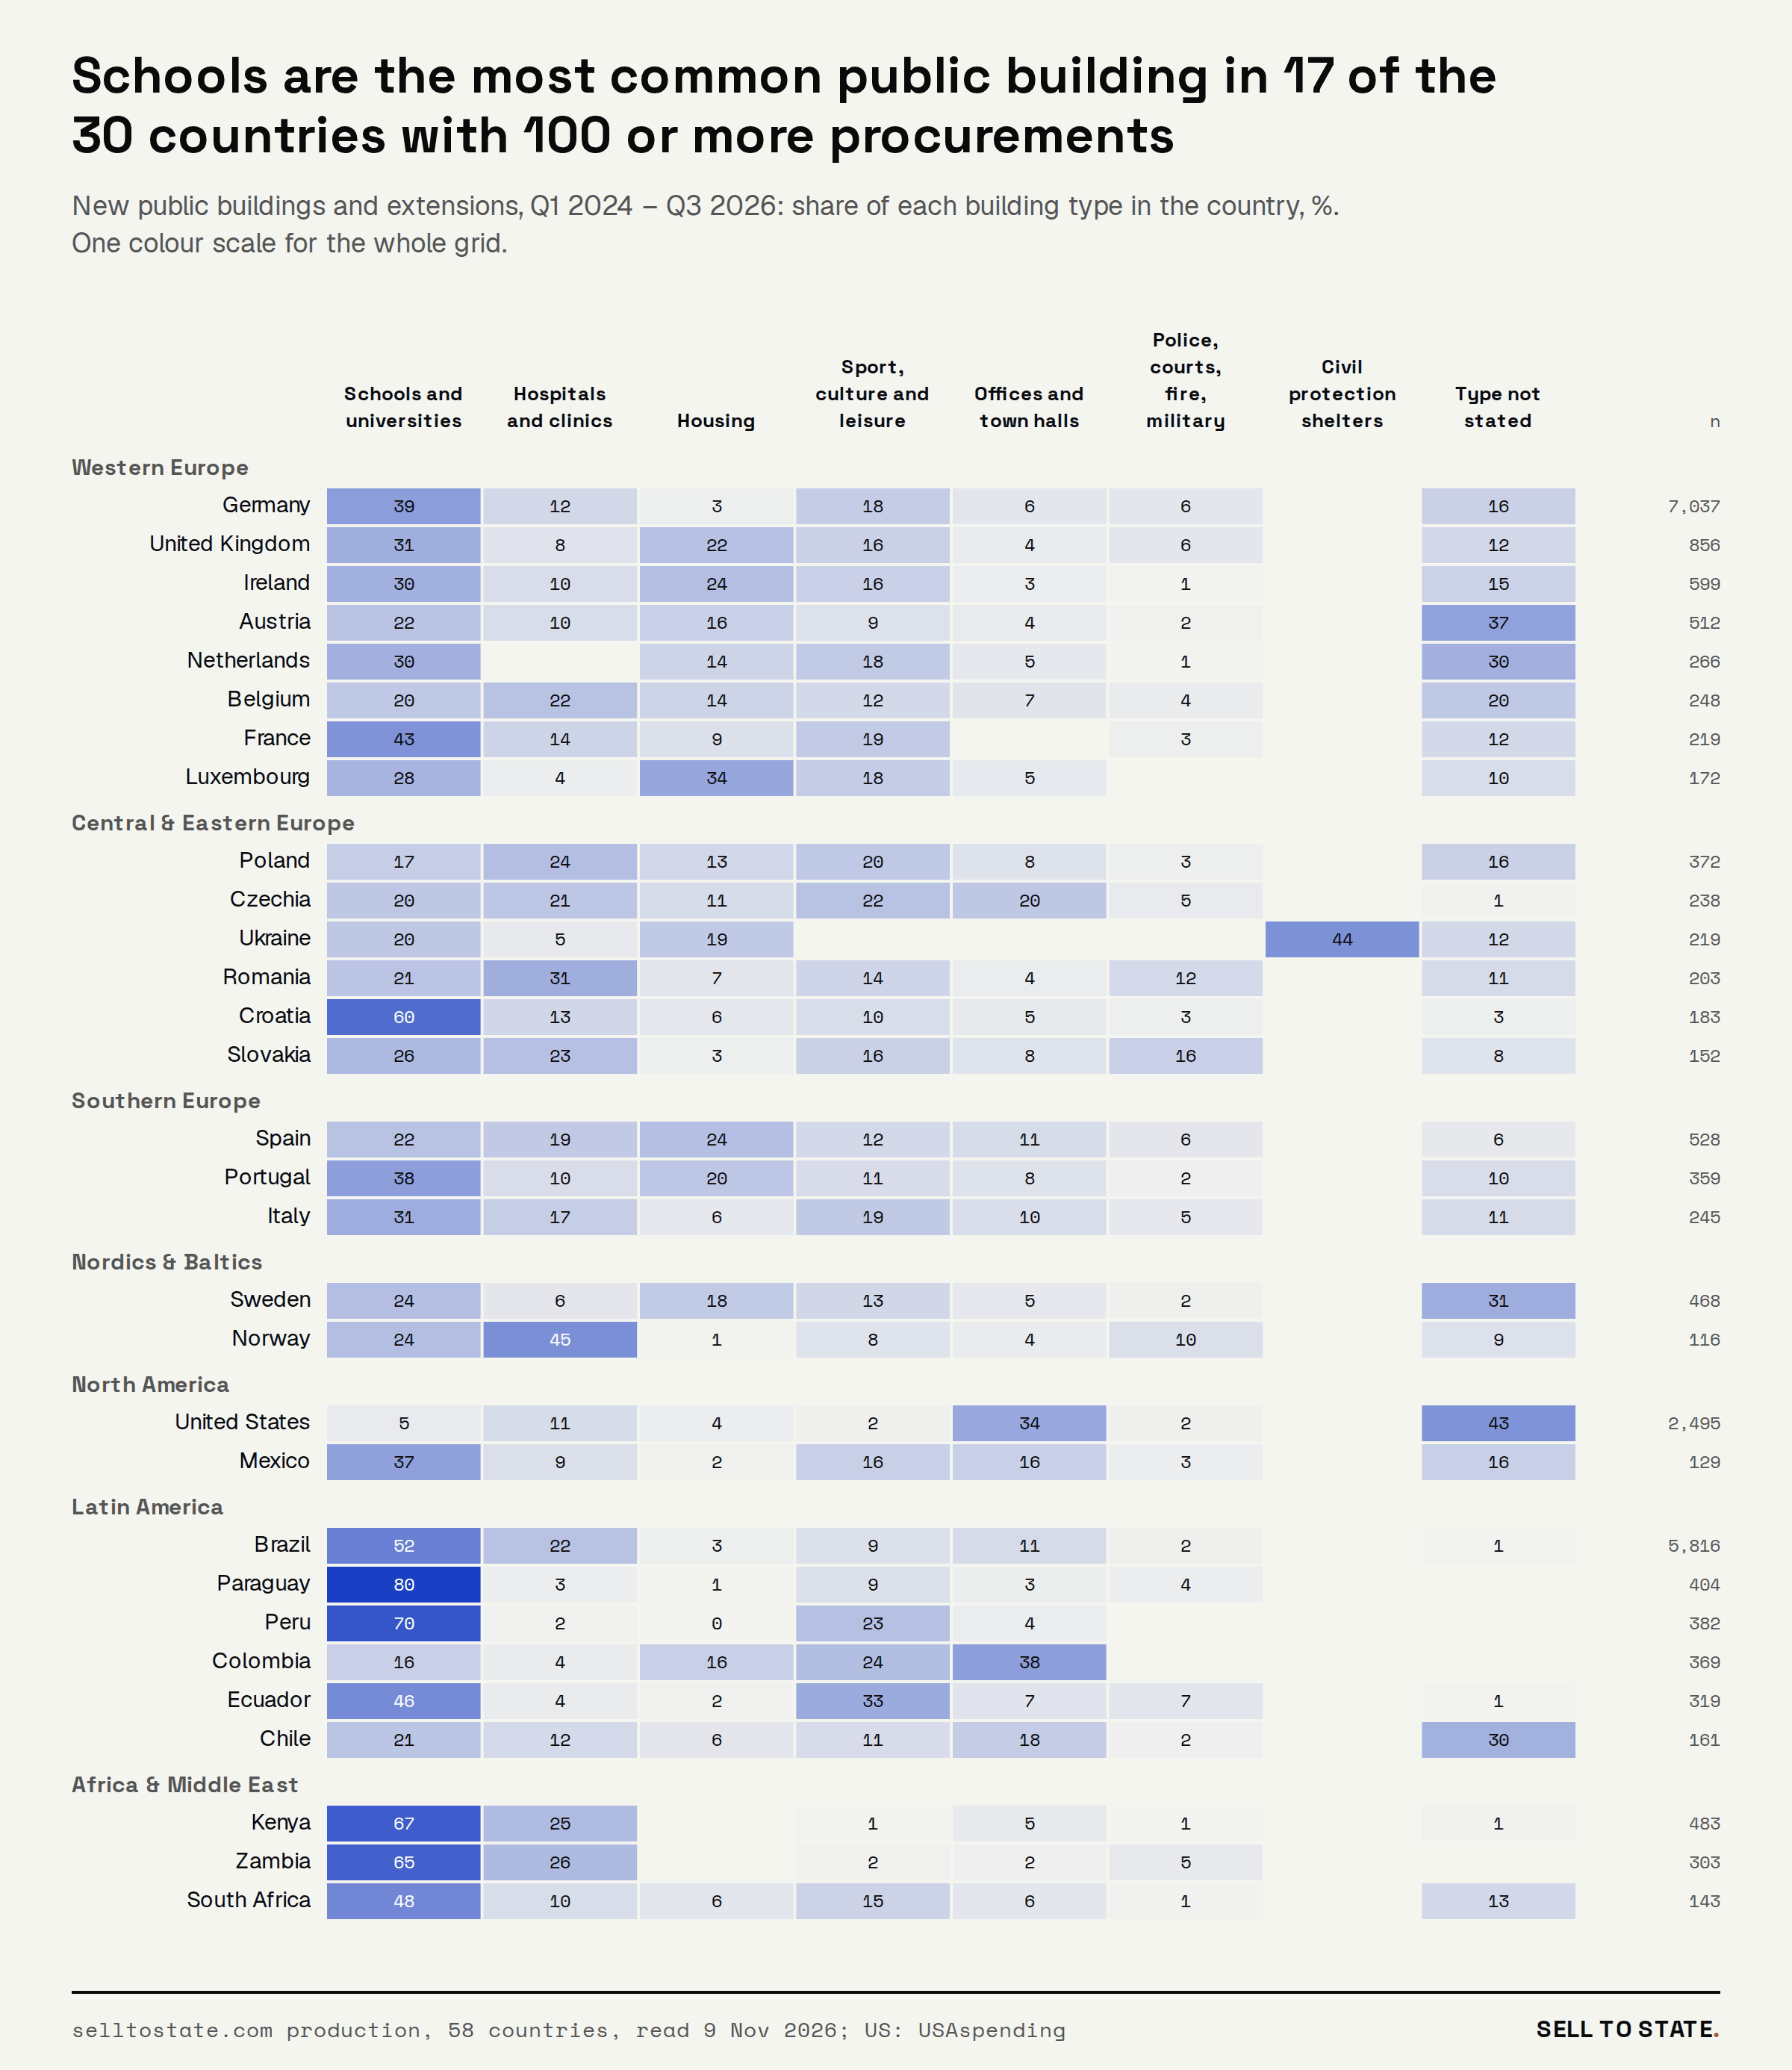
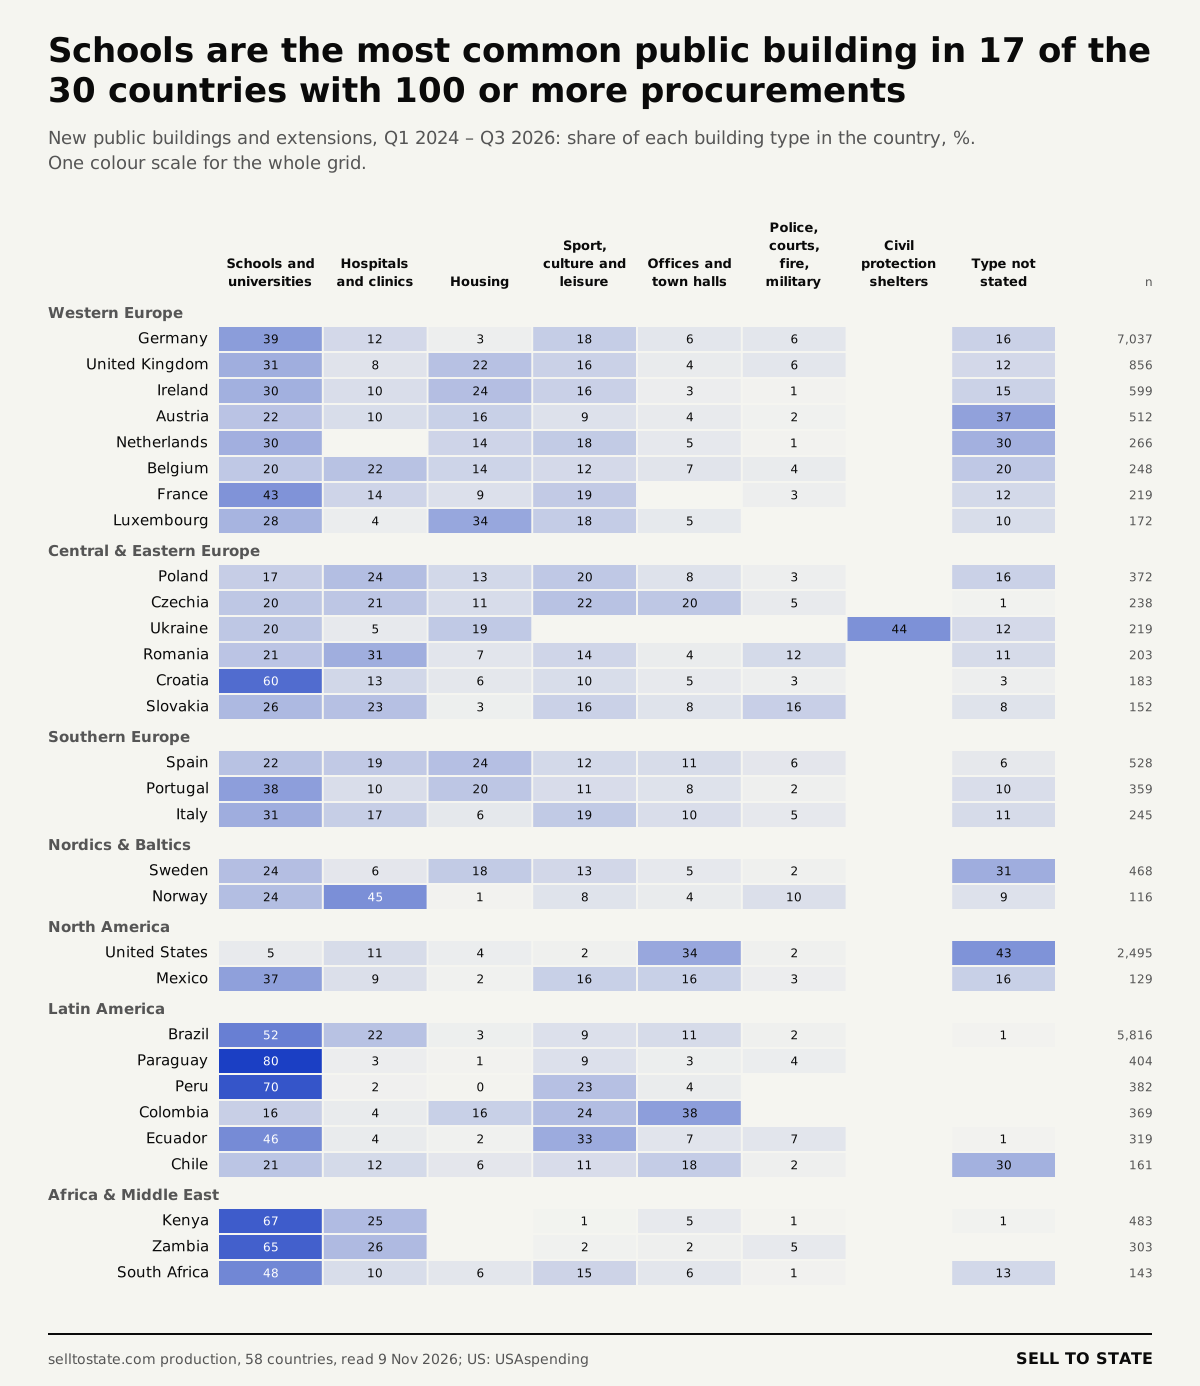
Schools are the most common public building in 17 of the 30 countries with 100 or more procurements. Paraguay is at the top, with 80.2% schools, then Kenya with 67.1% and Brazil with 51.8%. Spain and Luxembourg tender housing most often. Poland, Romania, Belgium and Norway tender hospitals and clinics most often. In Colombia, offices and town halls lead with 37.9%. In Ukraine, civil protection shelters lead.
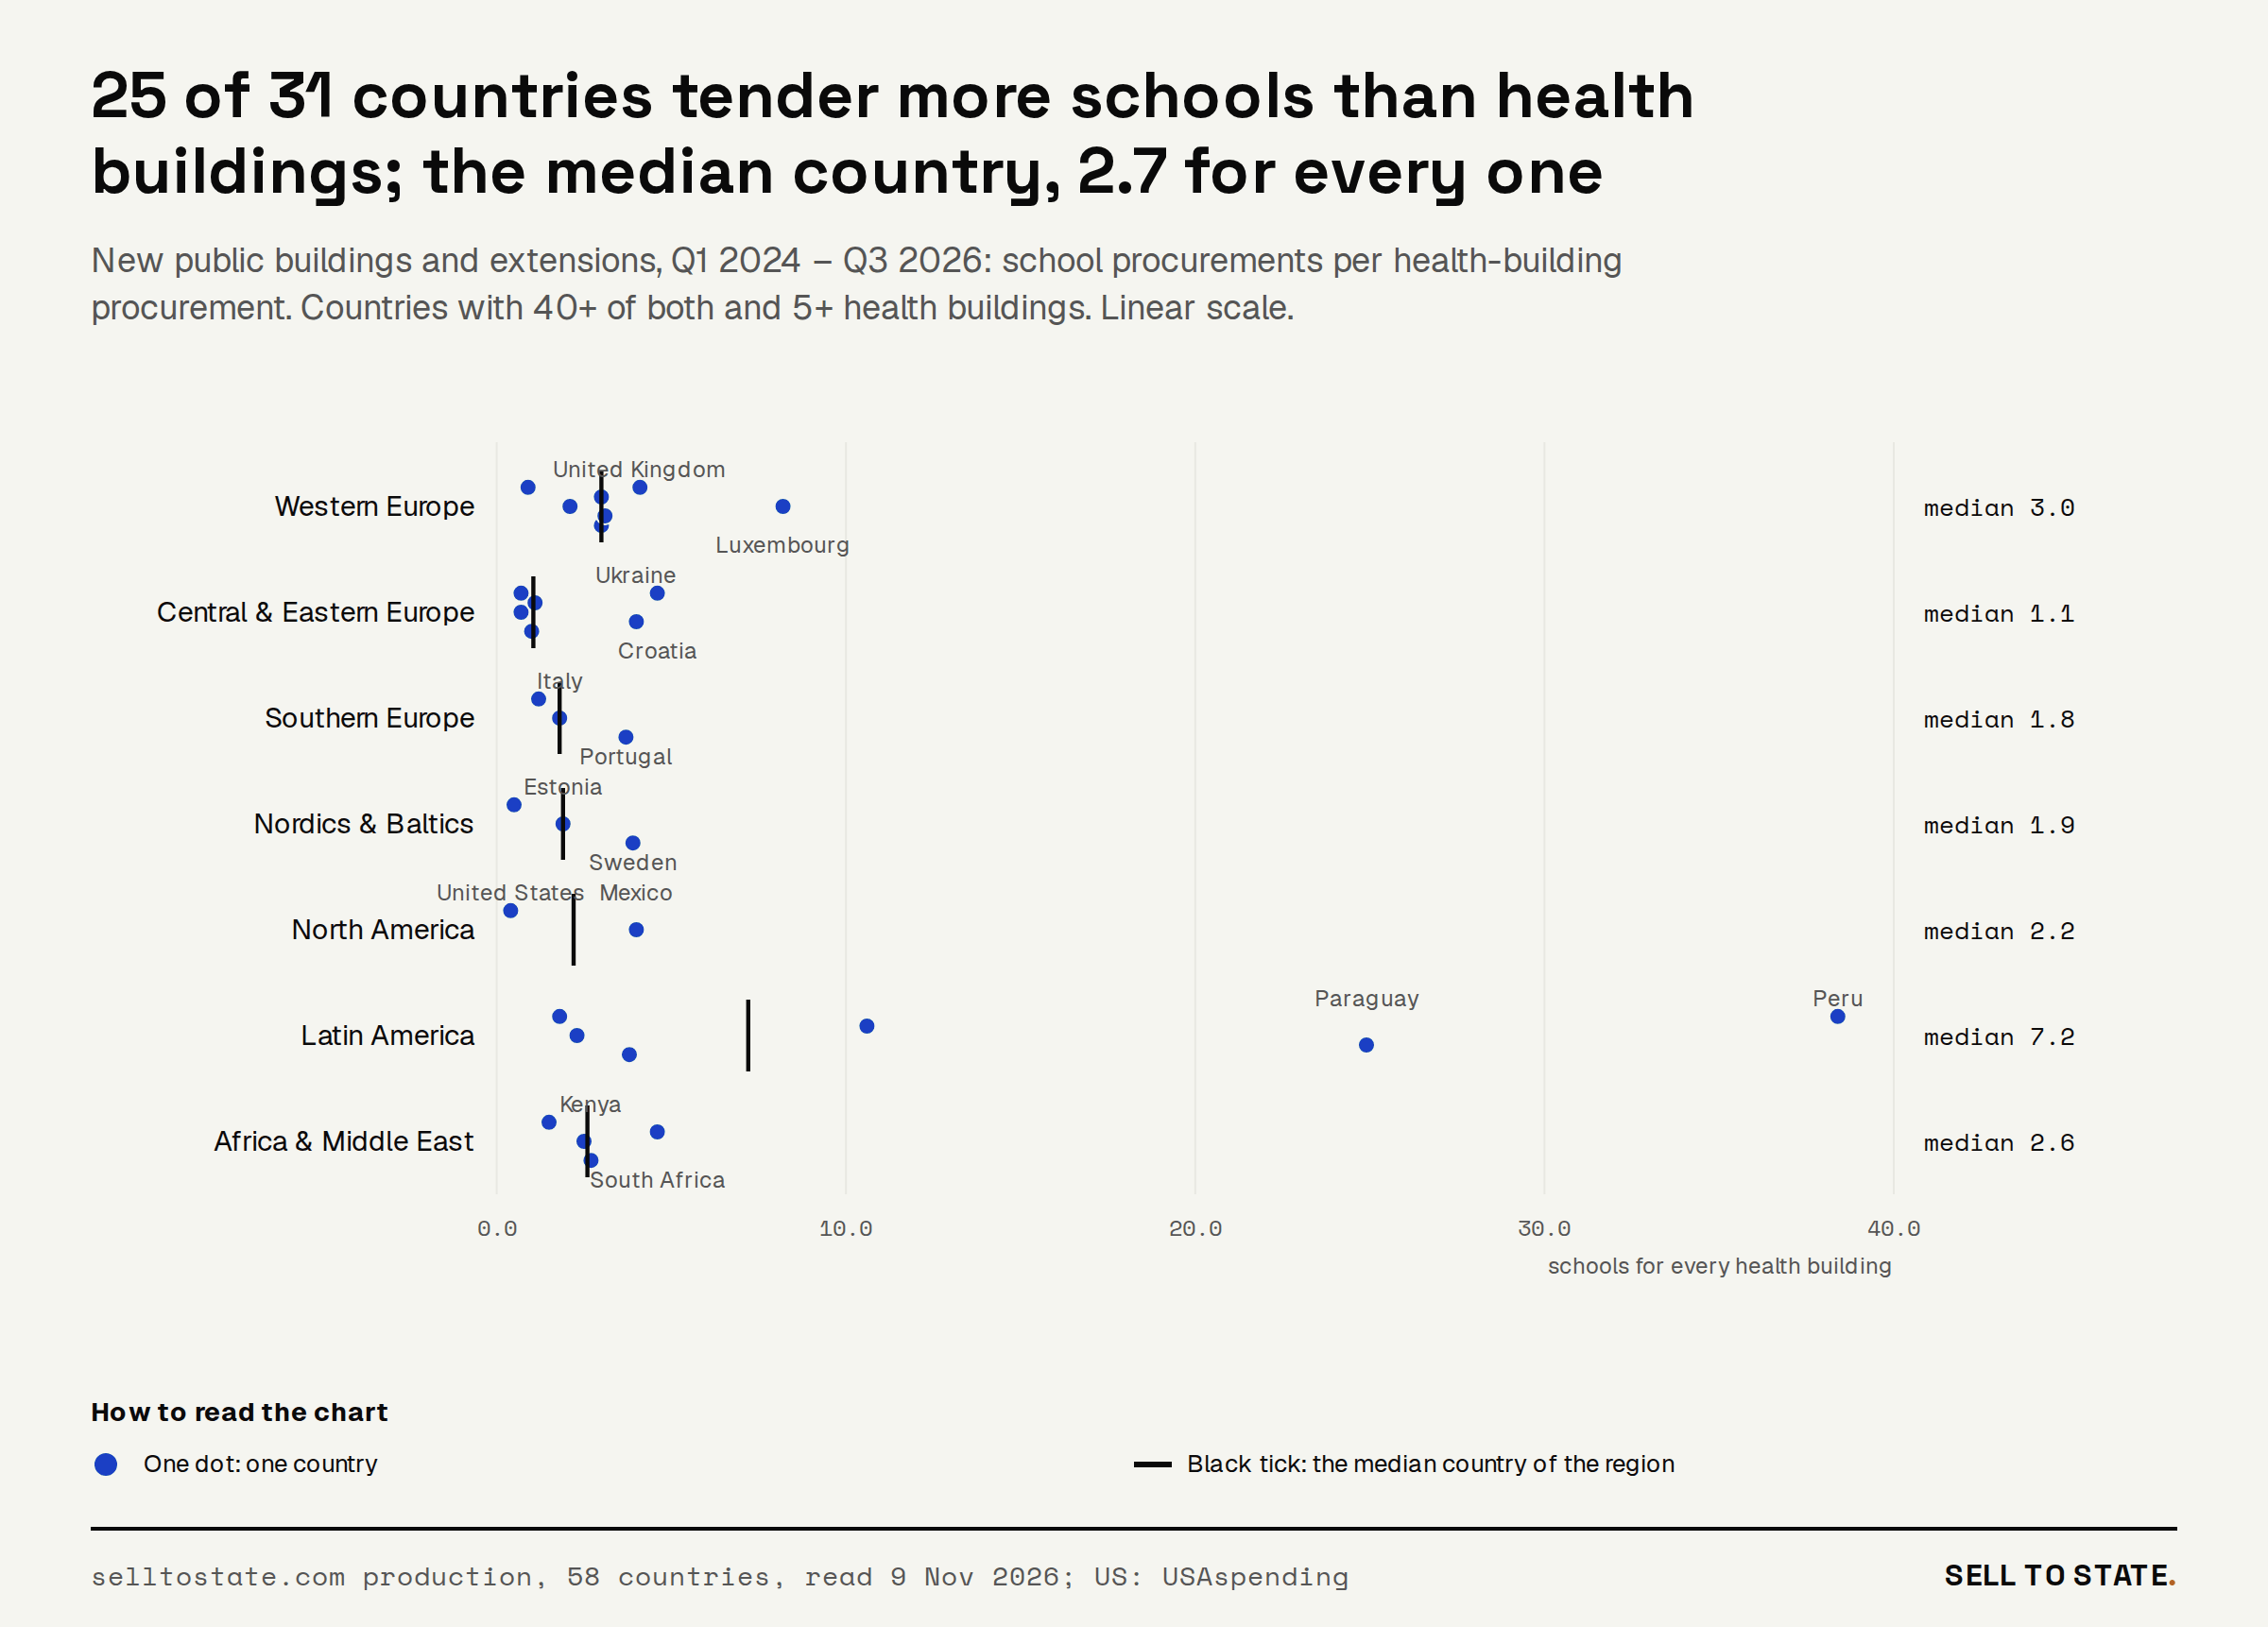
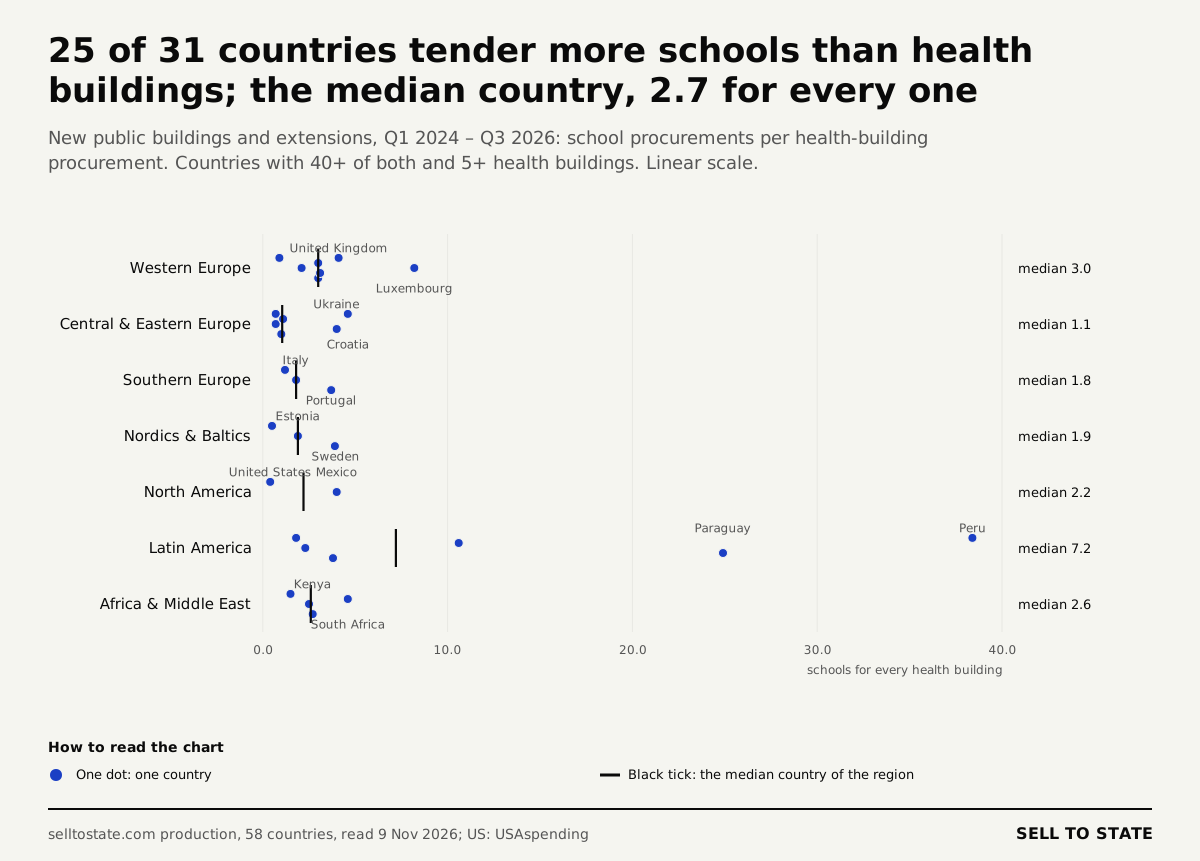
25 of 31 countries tender more schools than health buildings. The median country tenders 2.7 schools for every health building. Peru is at the top, with 38.4 schools for every health building. The United States is at the bottom, with 0.4, because USAspending covers federal contracts only, and states and school districts build the schools.
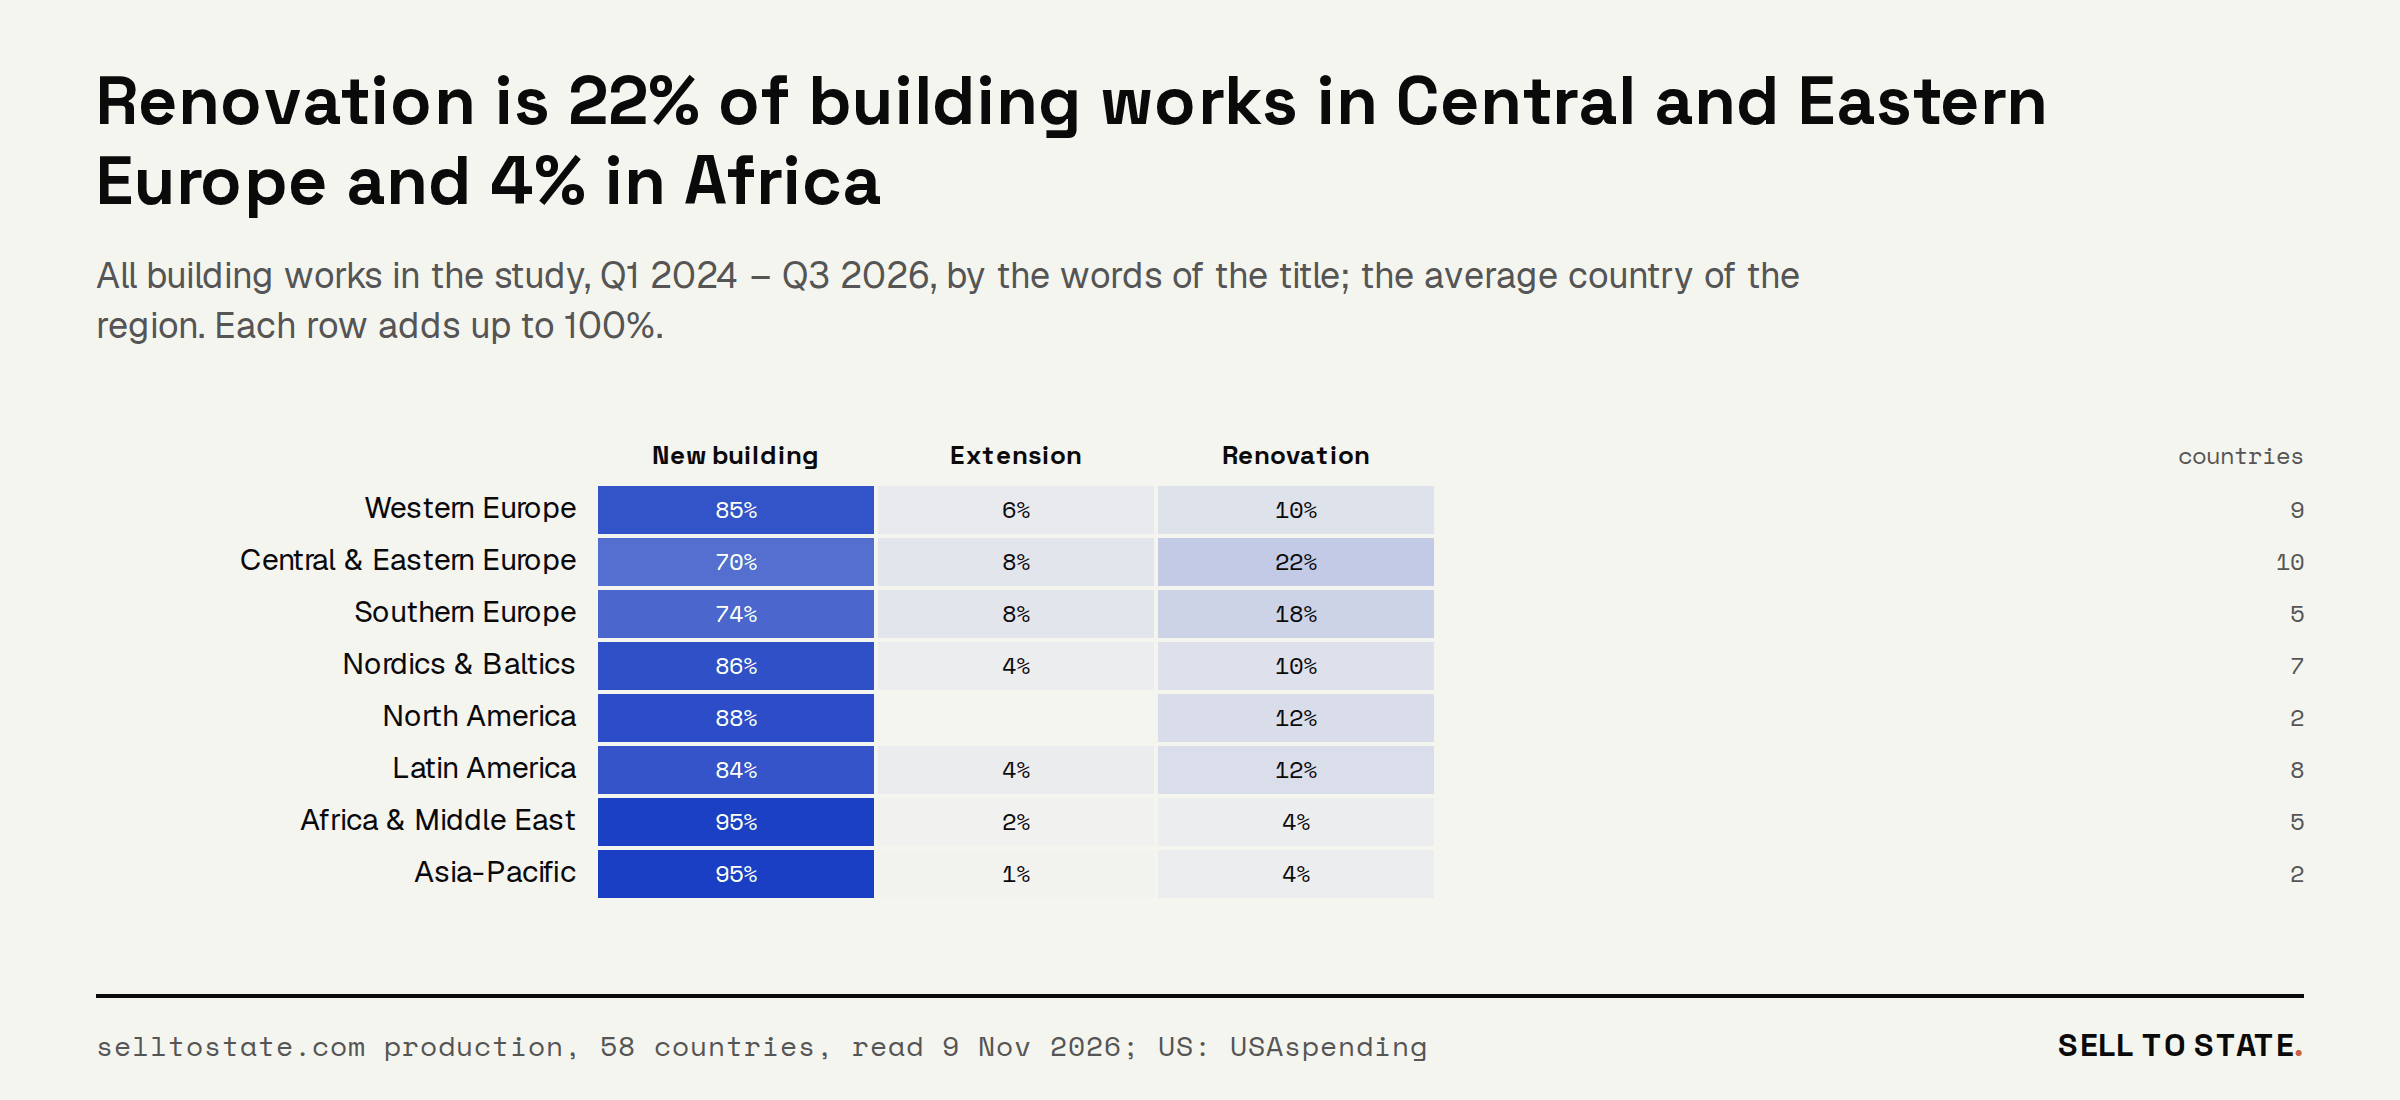
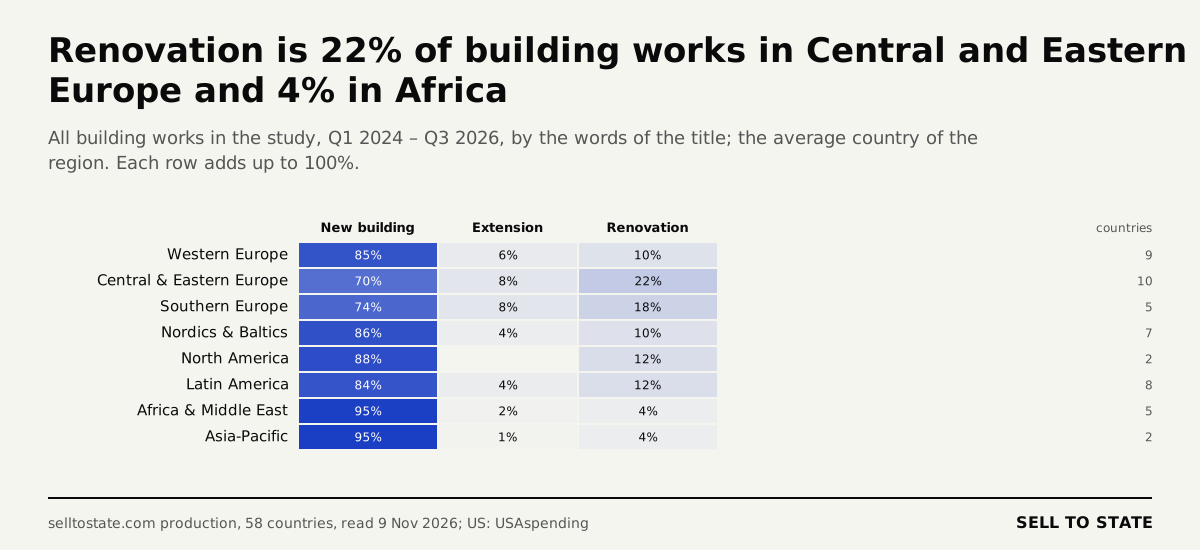
83% of public building works are new buildings, 5.5% are extensions and 11.5% are renovations. Central and Eastern Europe renovates most: in its average country, 22.1% of building works are renovations. In Africa, 4.0% are.
Ukraine: more than half of new public buildings are shelters
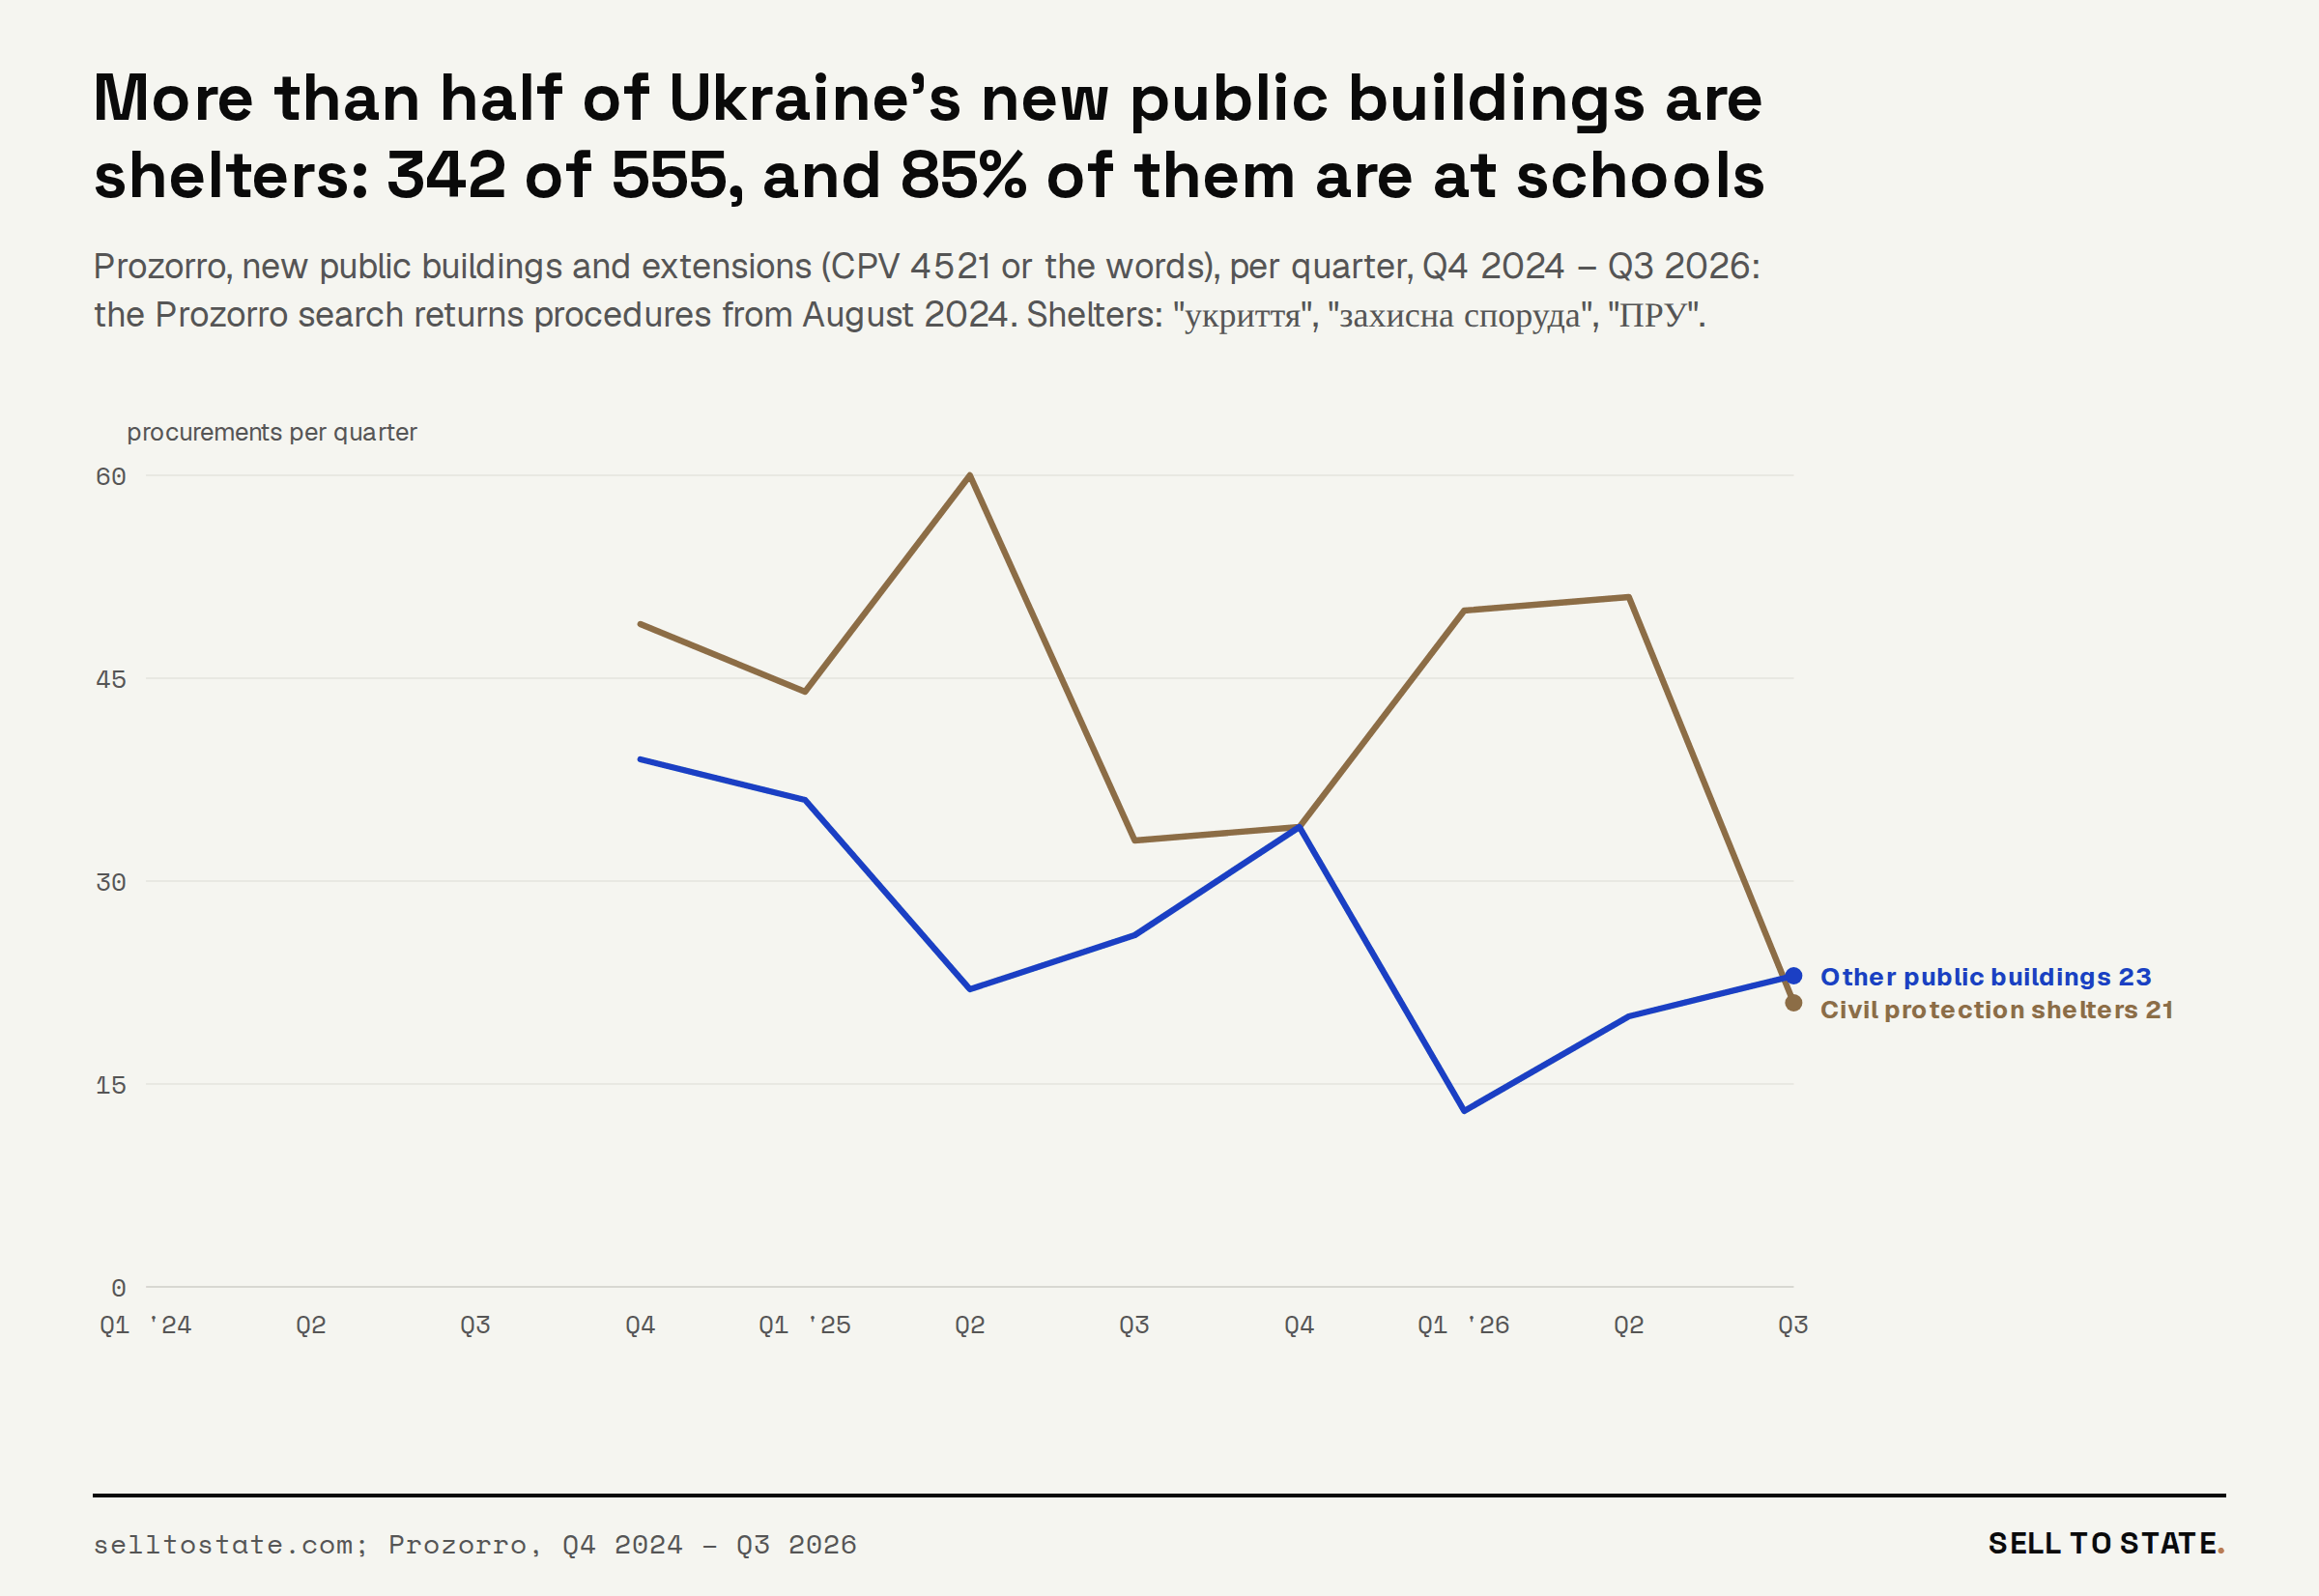
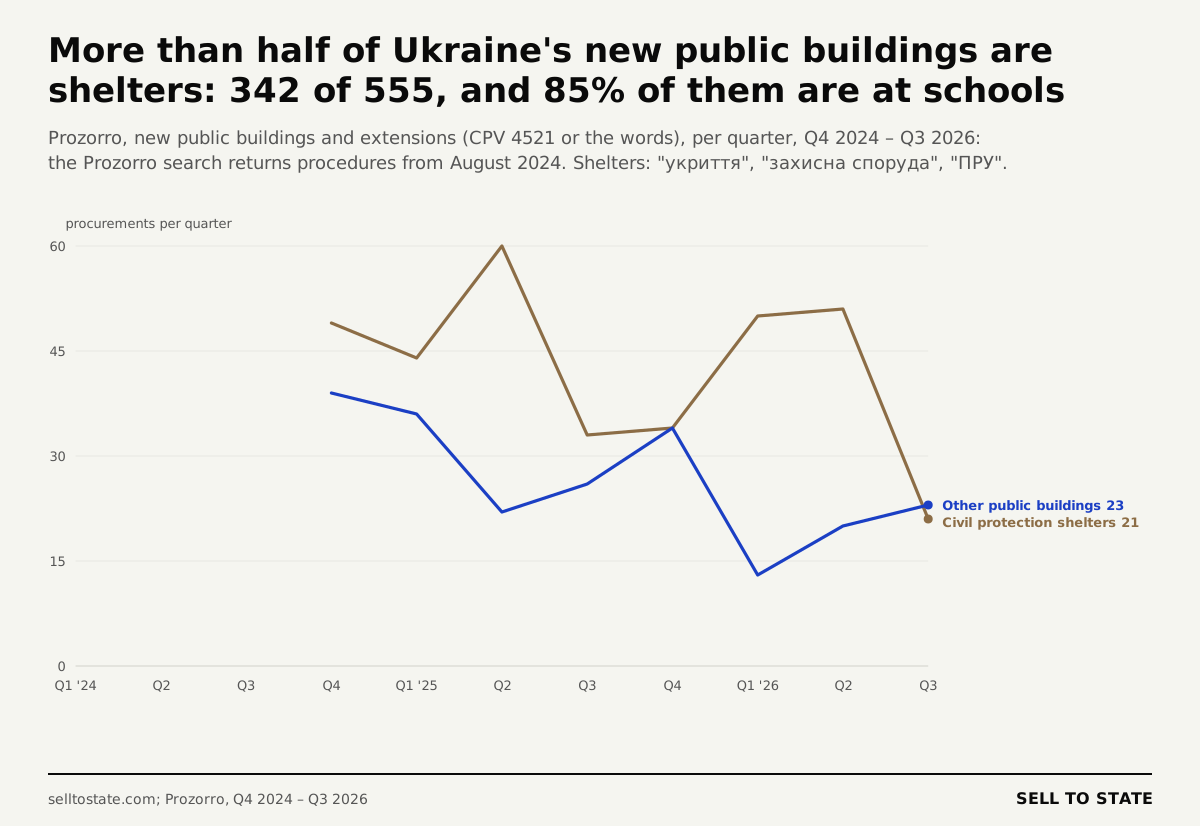
In Ukraine, 342 of 555 procurements of new public buildings were civil protection shelters: 61.6%. 84.8% of them stand at a school, a lyceum, a gymnasium or a kindergarten. The Valky education department in Kharkiv region tendered a new radiation shelter for the Sharivka lyceum at an estimated €2.7 million. The count starts in Q4 2024, because the Prozorro search returns procedures from August 2024.
Who wins: local firms
Public building contracts go to local firms. We took the two firms with the most public building procurements in each of the 15 largest countries. 29 of the 30 won only in their home country. Strabag won 32 procurements: 19 in Austria, 7 in Germany and 1 in Poland. Across all 14,795 winning firms in production, 33 won a public building contract in more than one country.
The top winners of each country are builders of one market. In Germany, Ed. Züblin leads with 32 procurements. In the United States, SK Construction and Management won 59 awards, all of them from the Department of the Army. In Peru, two consortia won 32 and 27 school and sports works. In Kenya, Frapert Construction won 13.
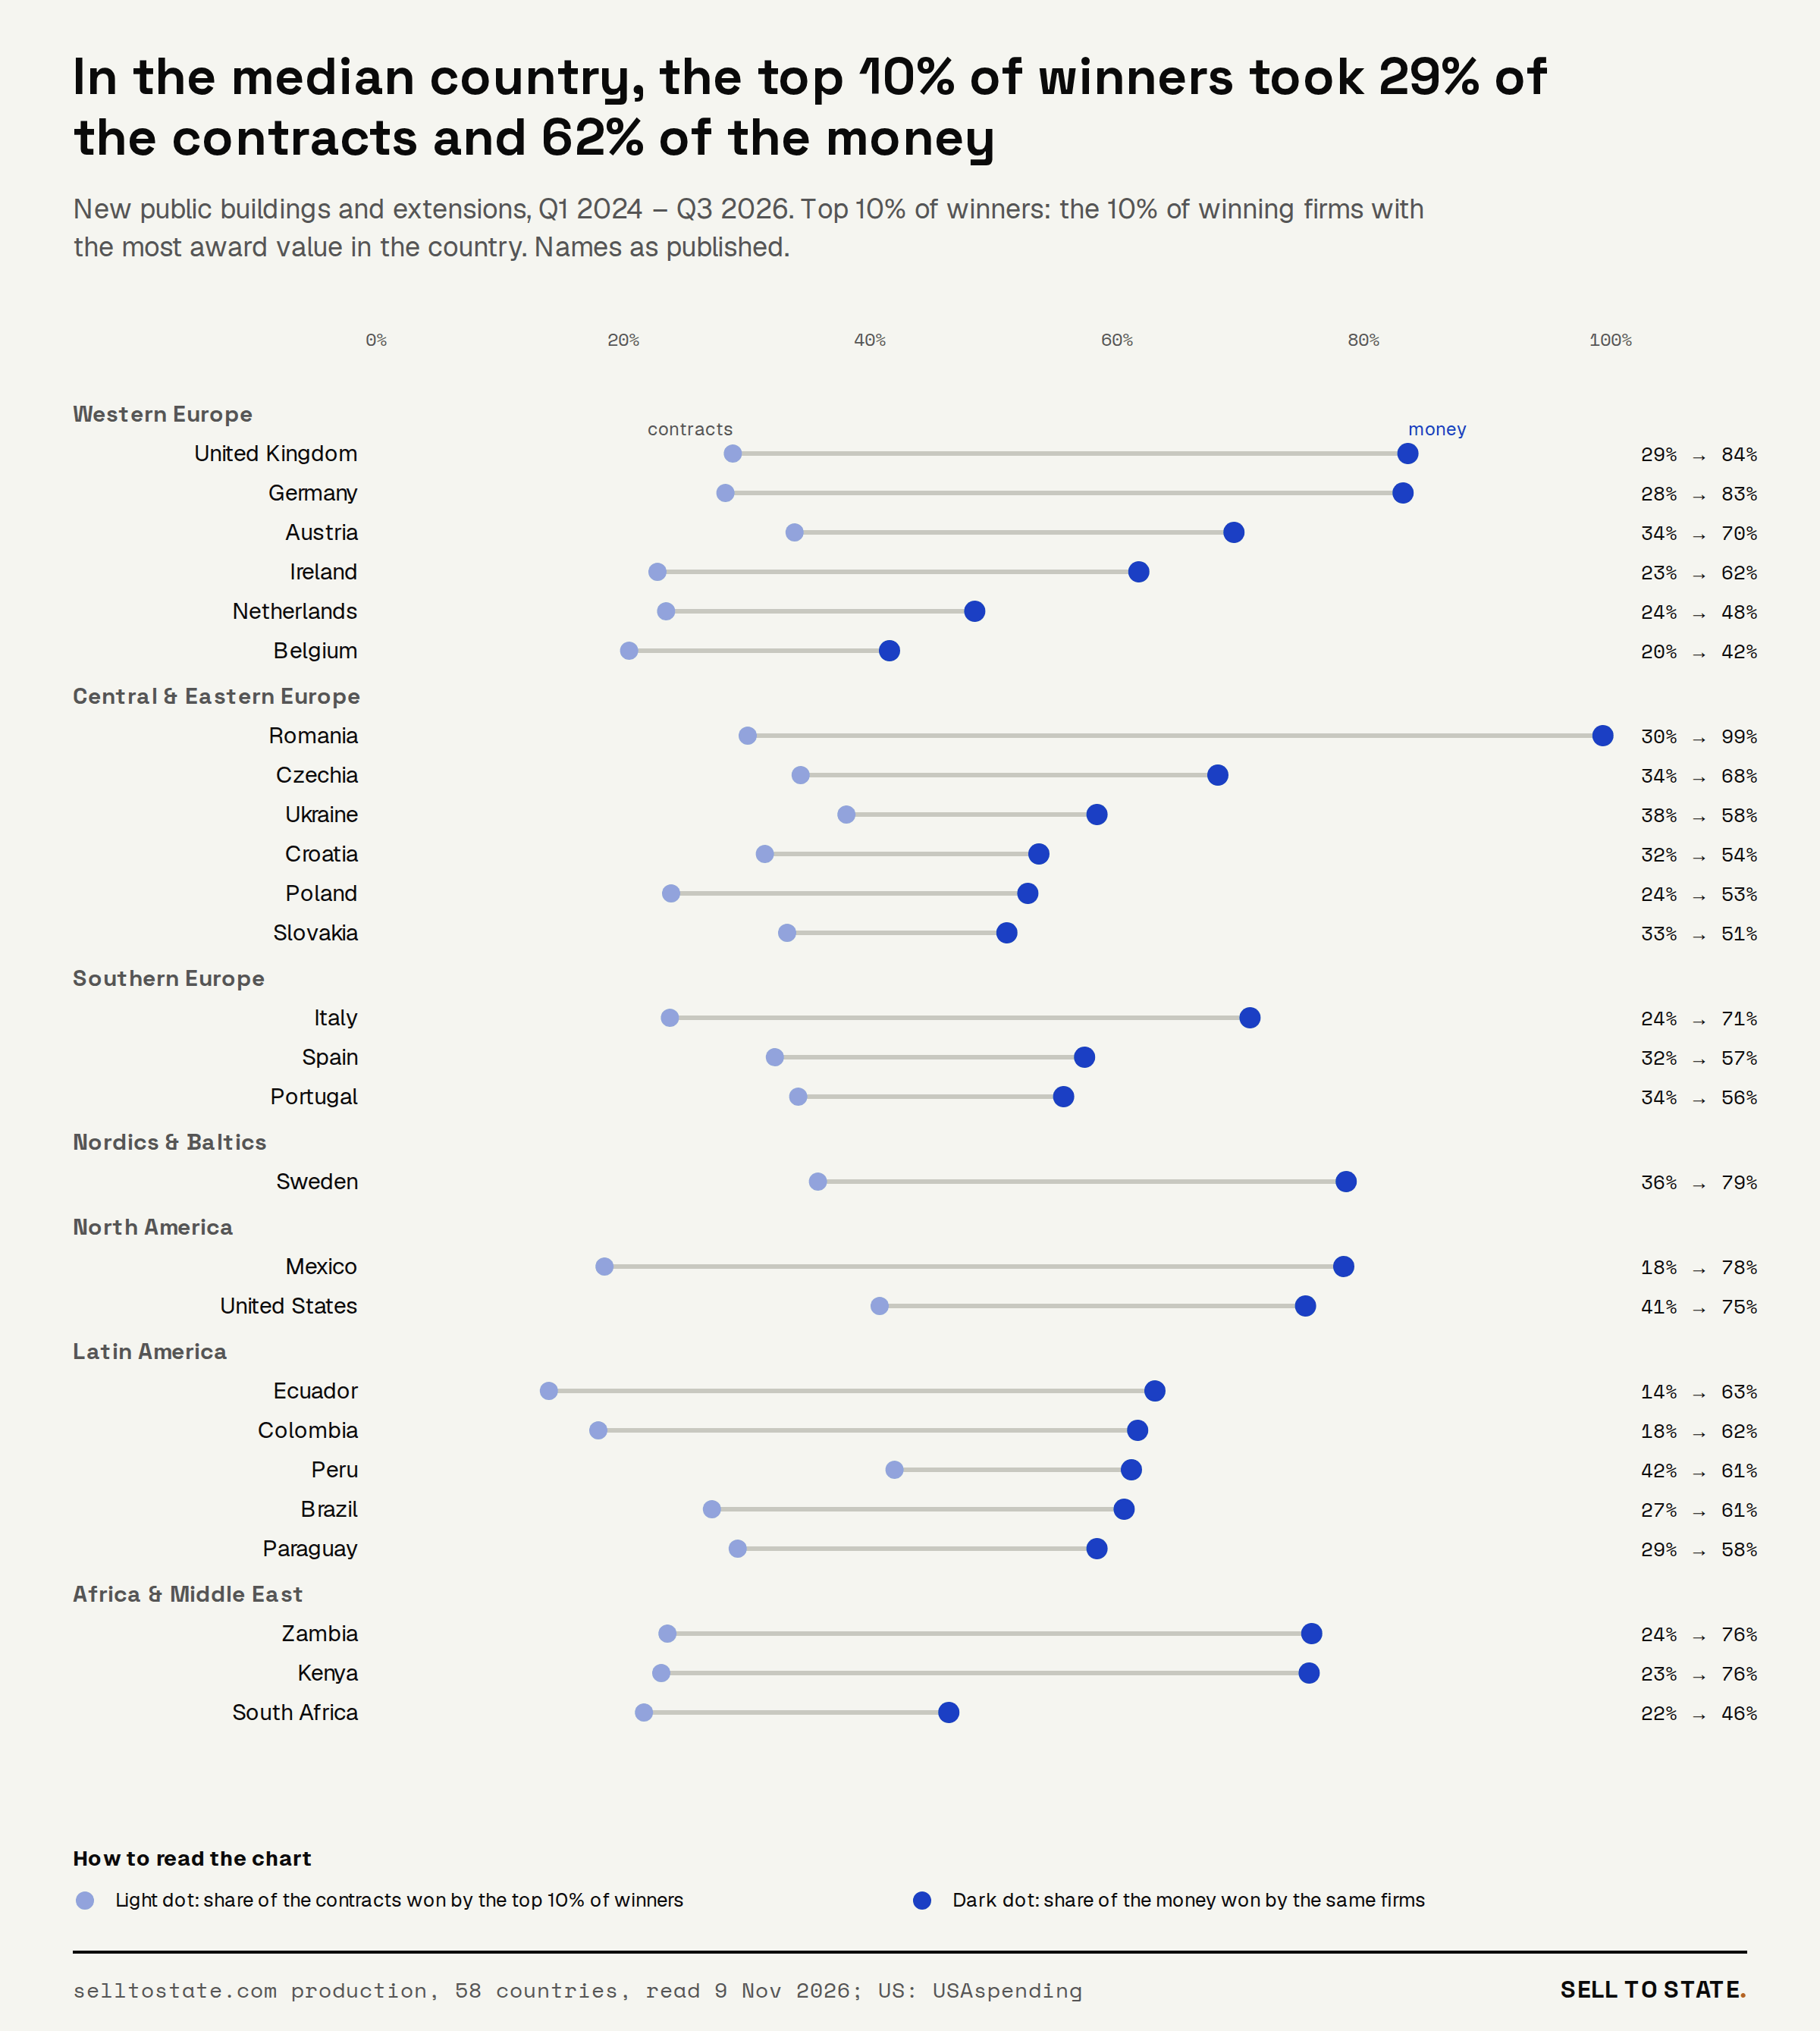
Most winners win once, and a few firms take most of the money. In the median country, 81.9% of the winning firms won one public building procurement in the 11 quarters of the study. In the median country, the top 10% of winners took 61.8% of the published award value and 28.6% of the procurements. In Germany, the top 10% took 83.2% of the value; in Belgium, 41.6%.
Buyers and winners repeat. In the median country, 15.5% of the winning firms’ contracts came from a buyer that gave them two or more.
Who wins: small and medium firms, where the source states the size
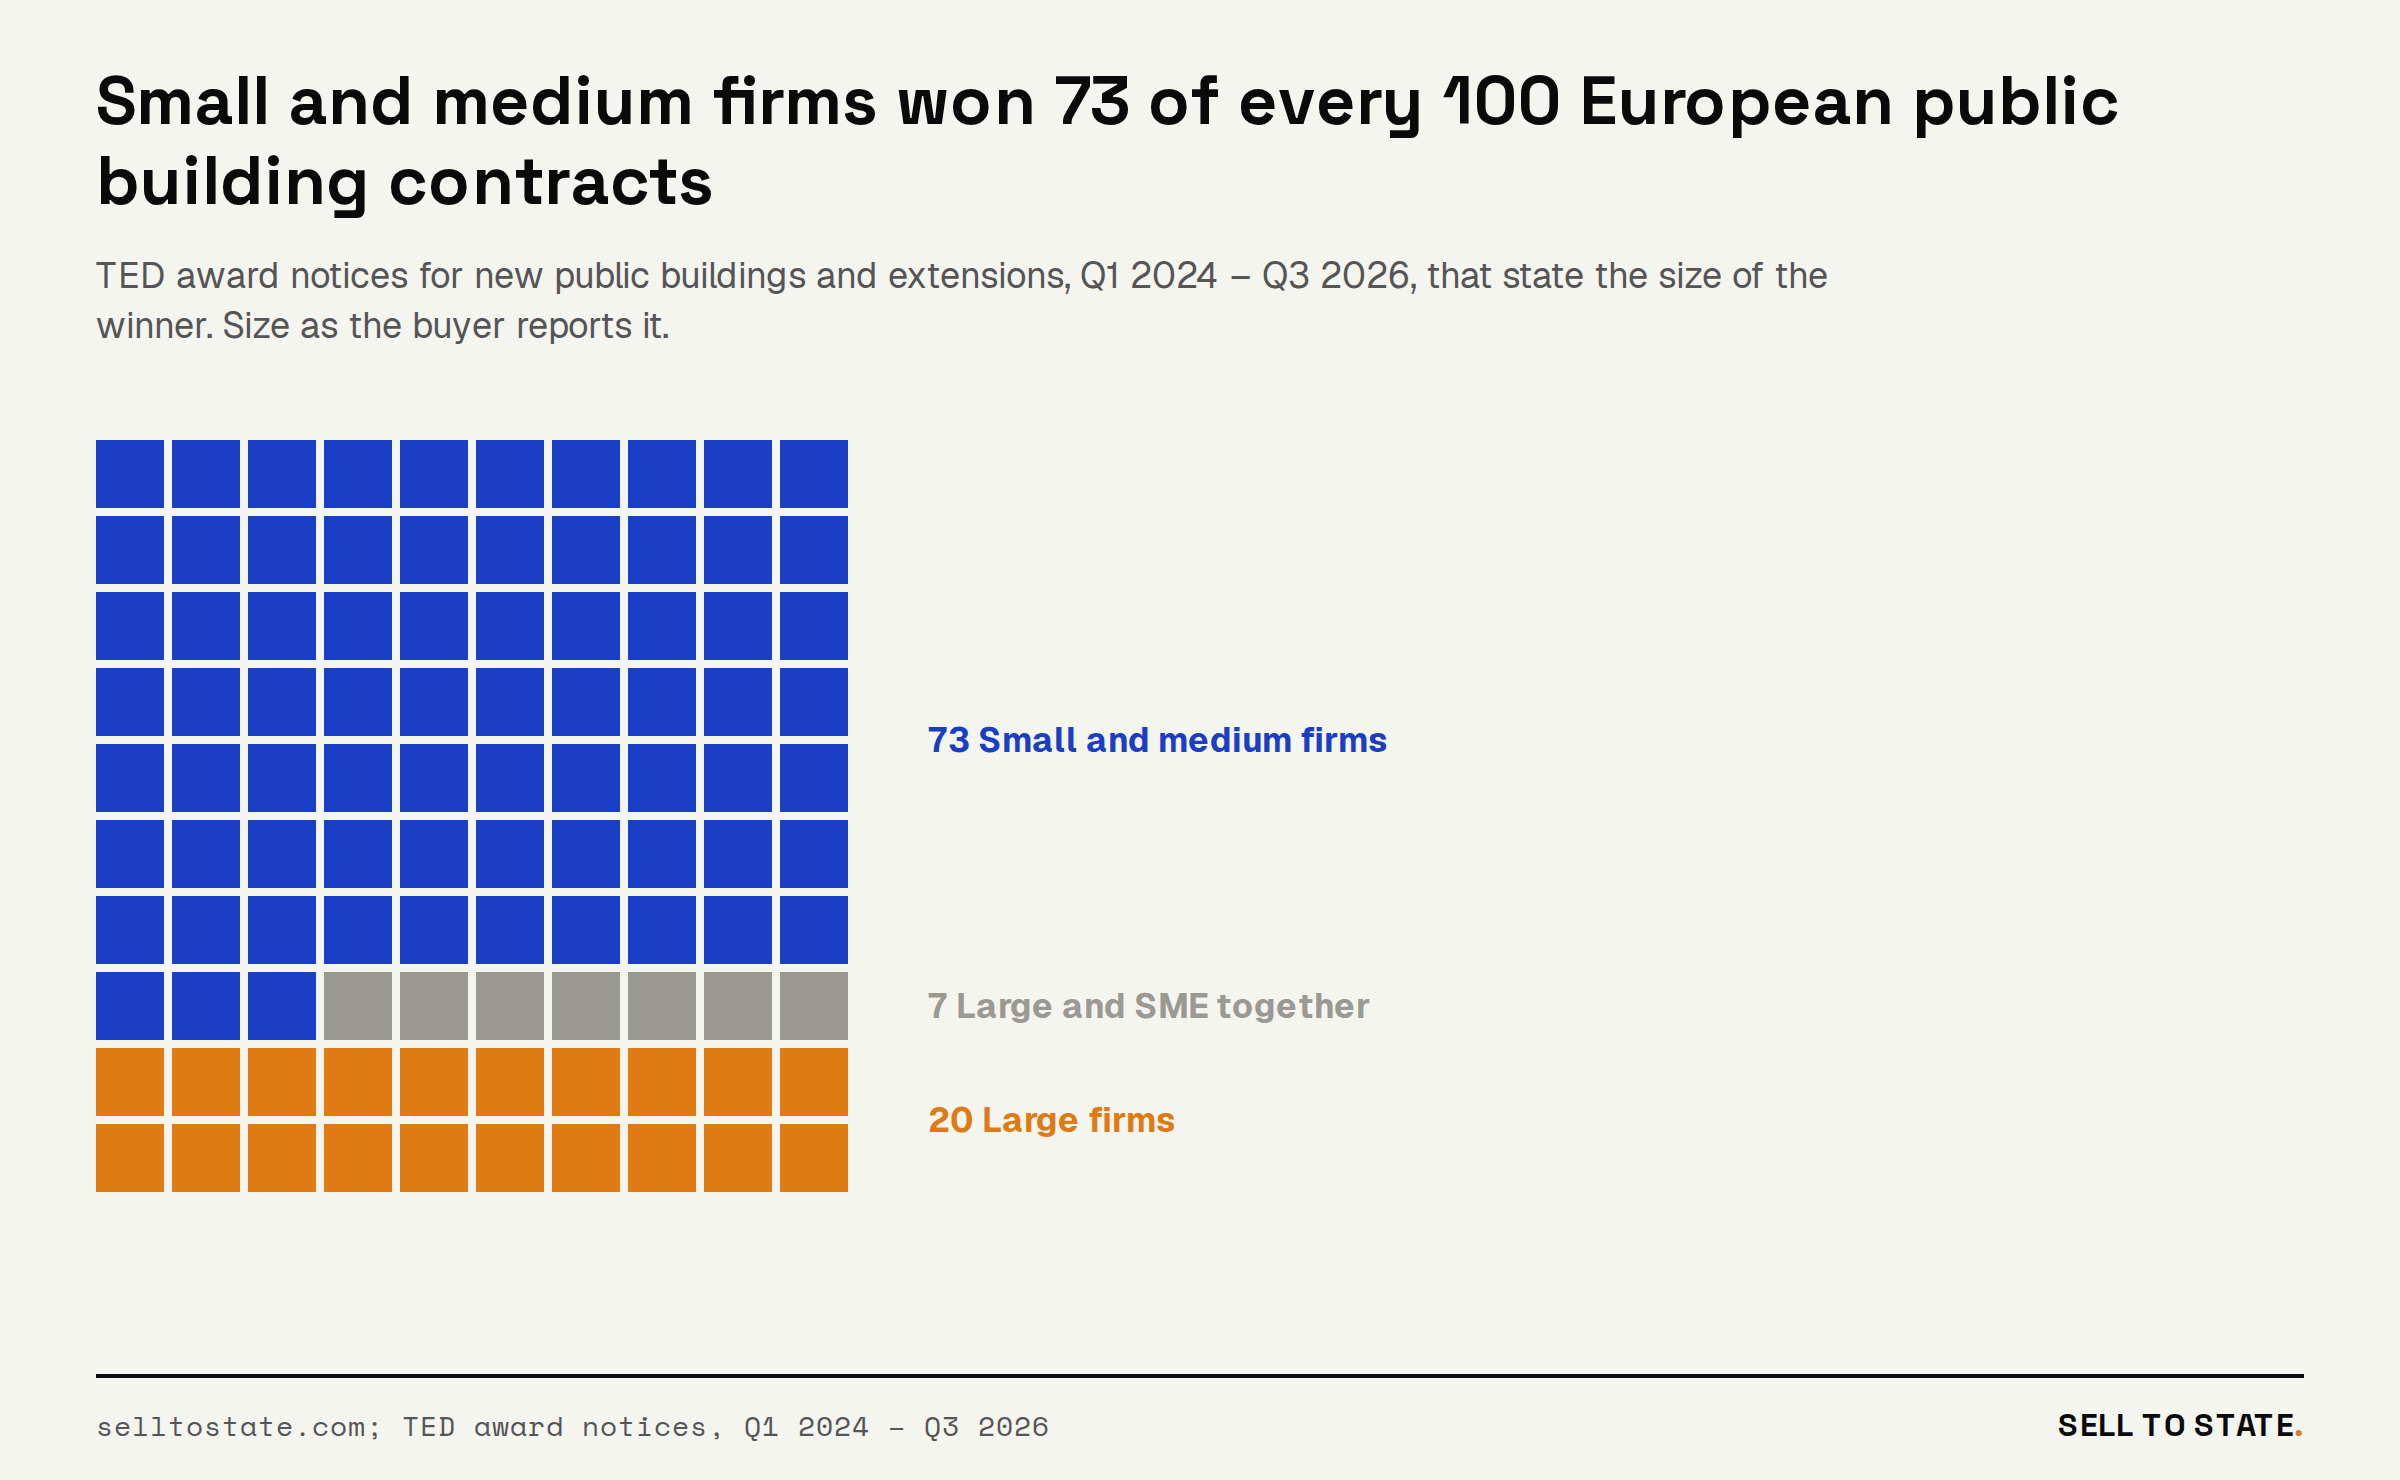
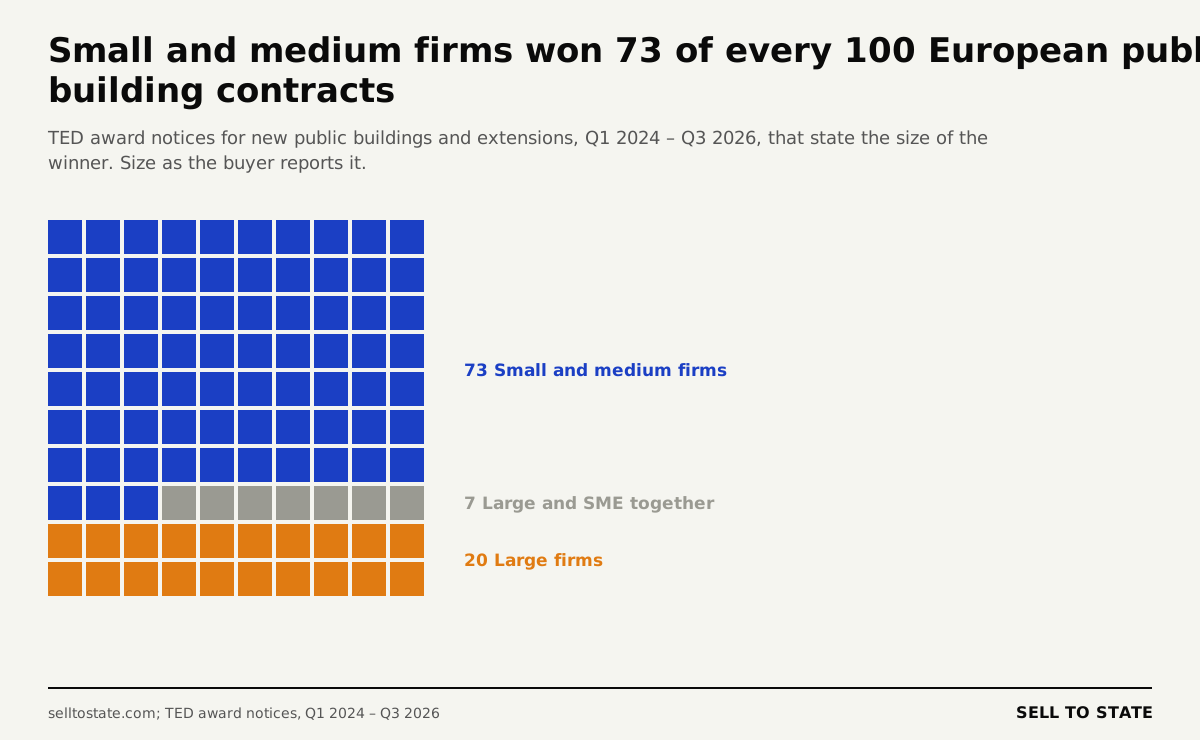
Small and medium firms won 73.2% of European award notices for new public buildings. Large firms won 20.1%, and 6.8% went to a mix of large and small winners. The count covers 8,176 TED award notices, the 72.7% that state the size of the winner. The buyer reports the size with the EU categories: micro, small, medium and large.
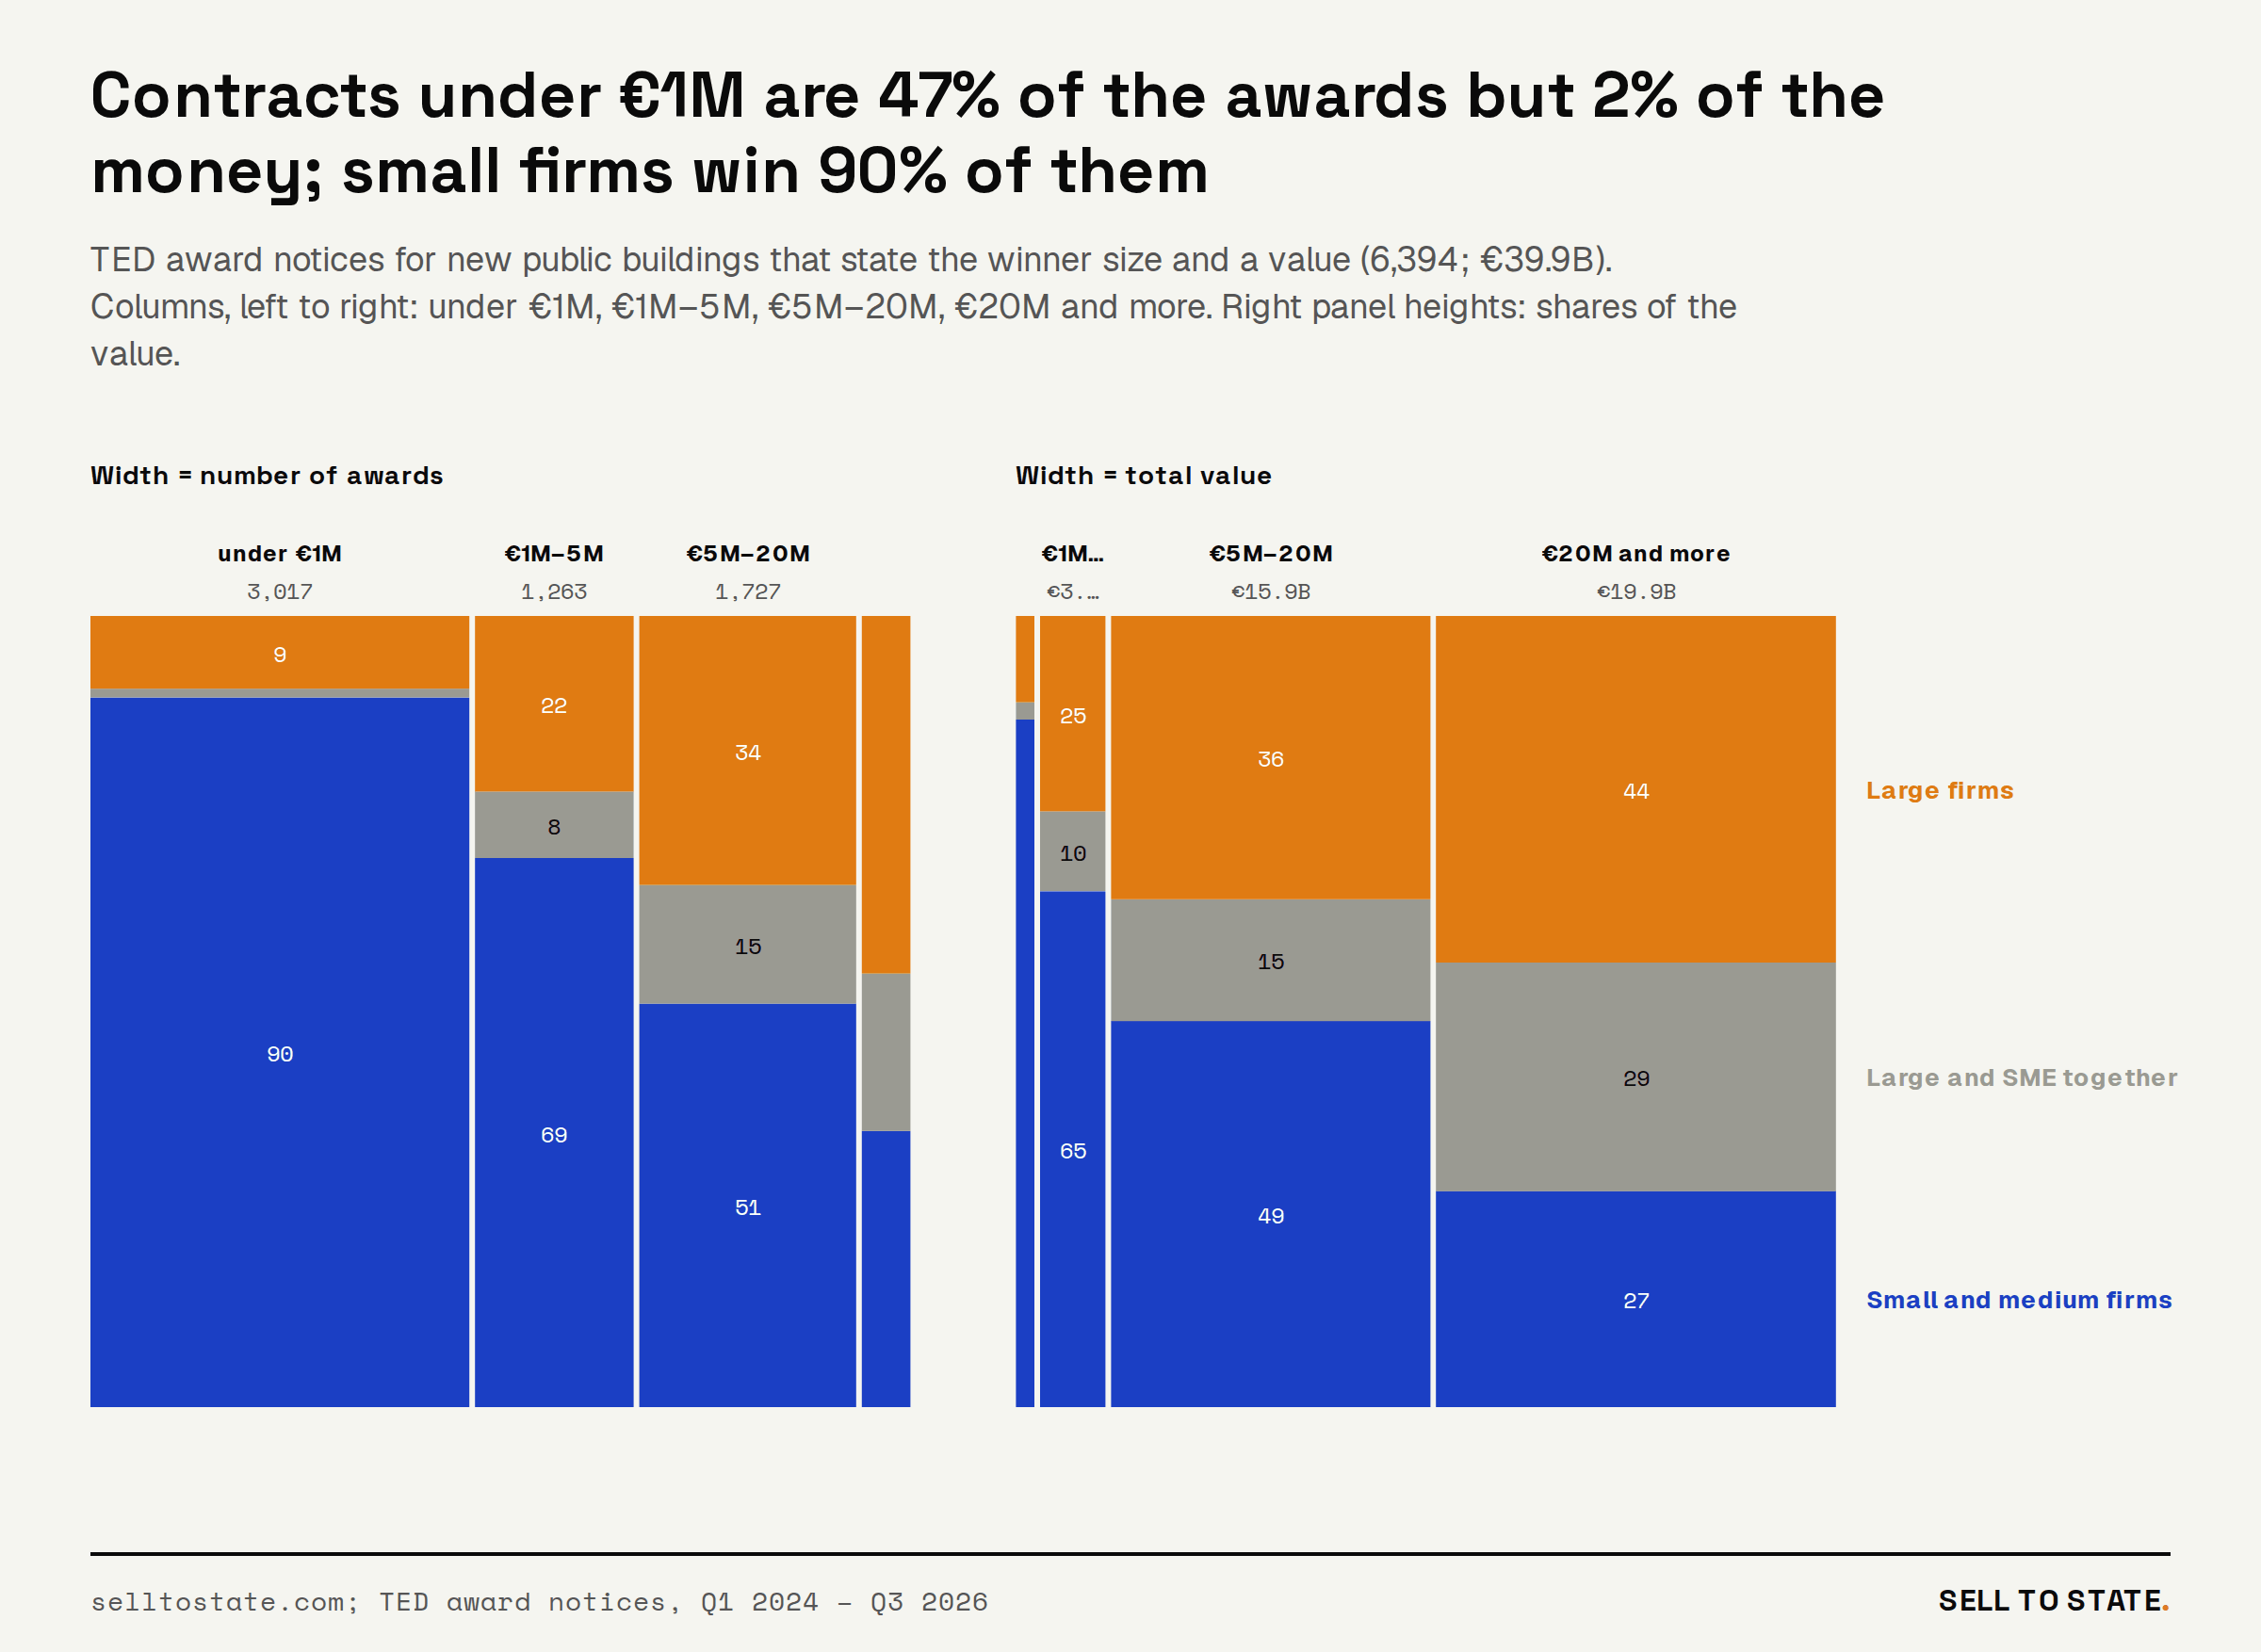
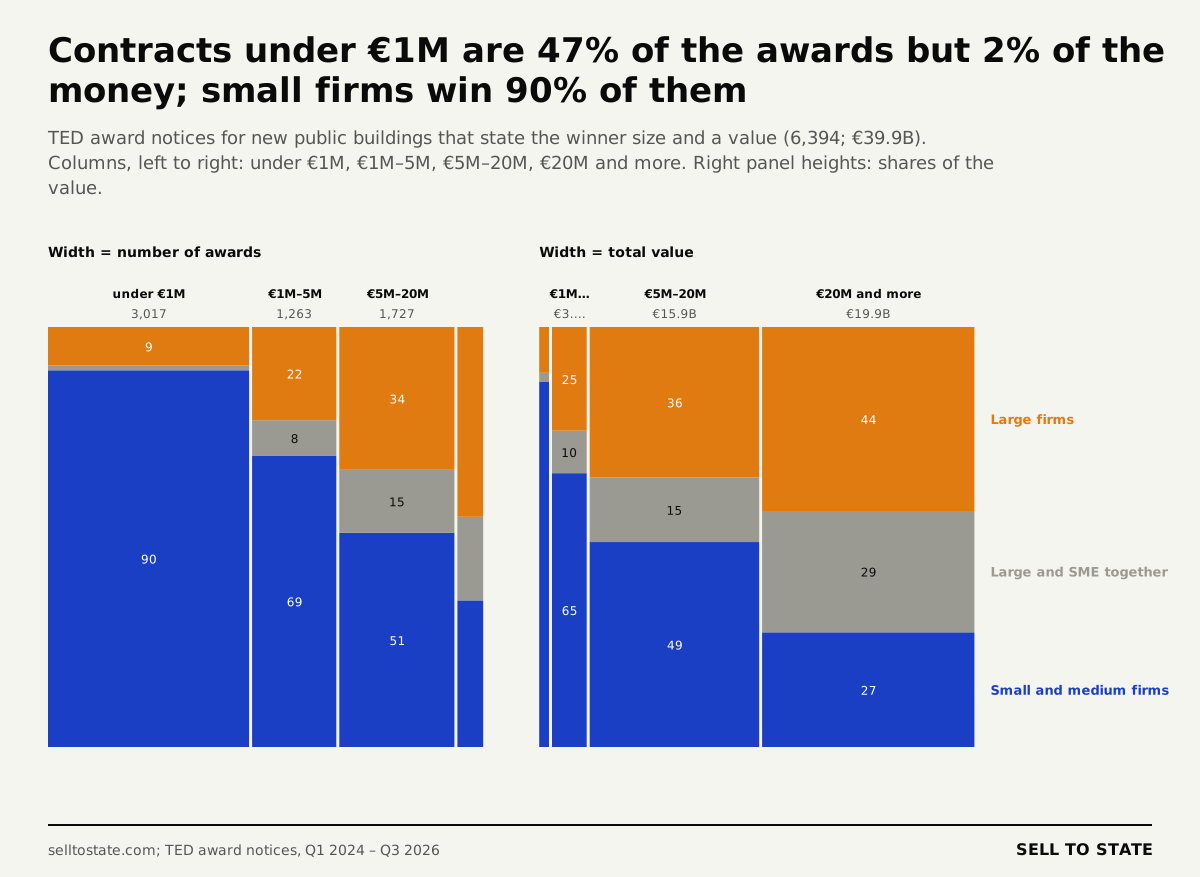
Small contracts are many, and large contracts hold the money. Contracts under €1 million are 47.2% of the awards but 2.3% of the value. Small and medium firms win 89.7% of them. Contracts of €20 million and more are 6.1% of the awards and 49.8% of the value. Small and medium firms win 34.9% of these large contracts and 27.3% of their value; large firms win 45.2% and 43.8%. The new university hospital in Martin, Slovakia, went to 4 firms for €244.9 million.
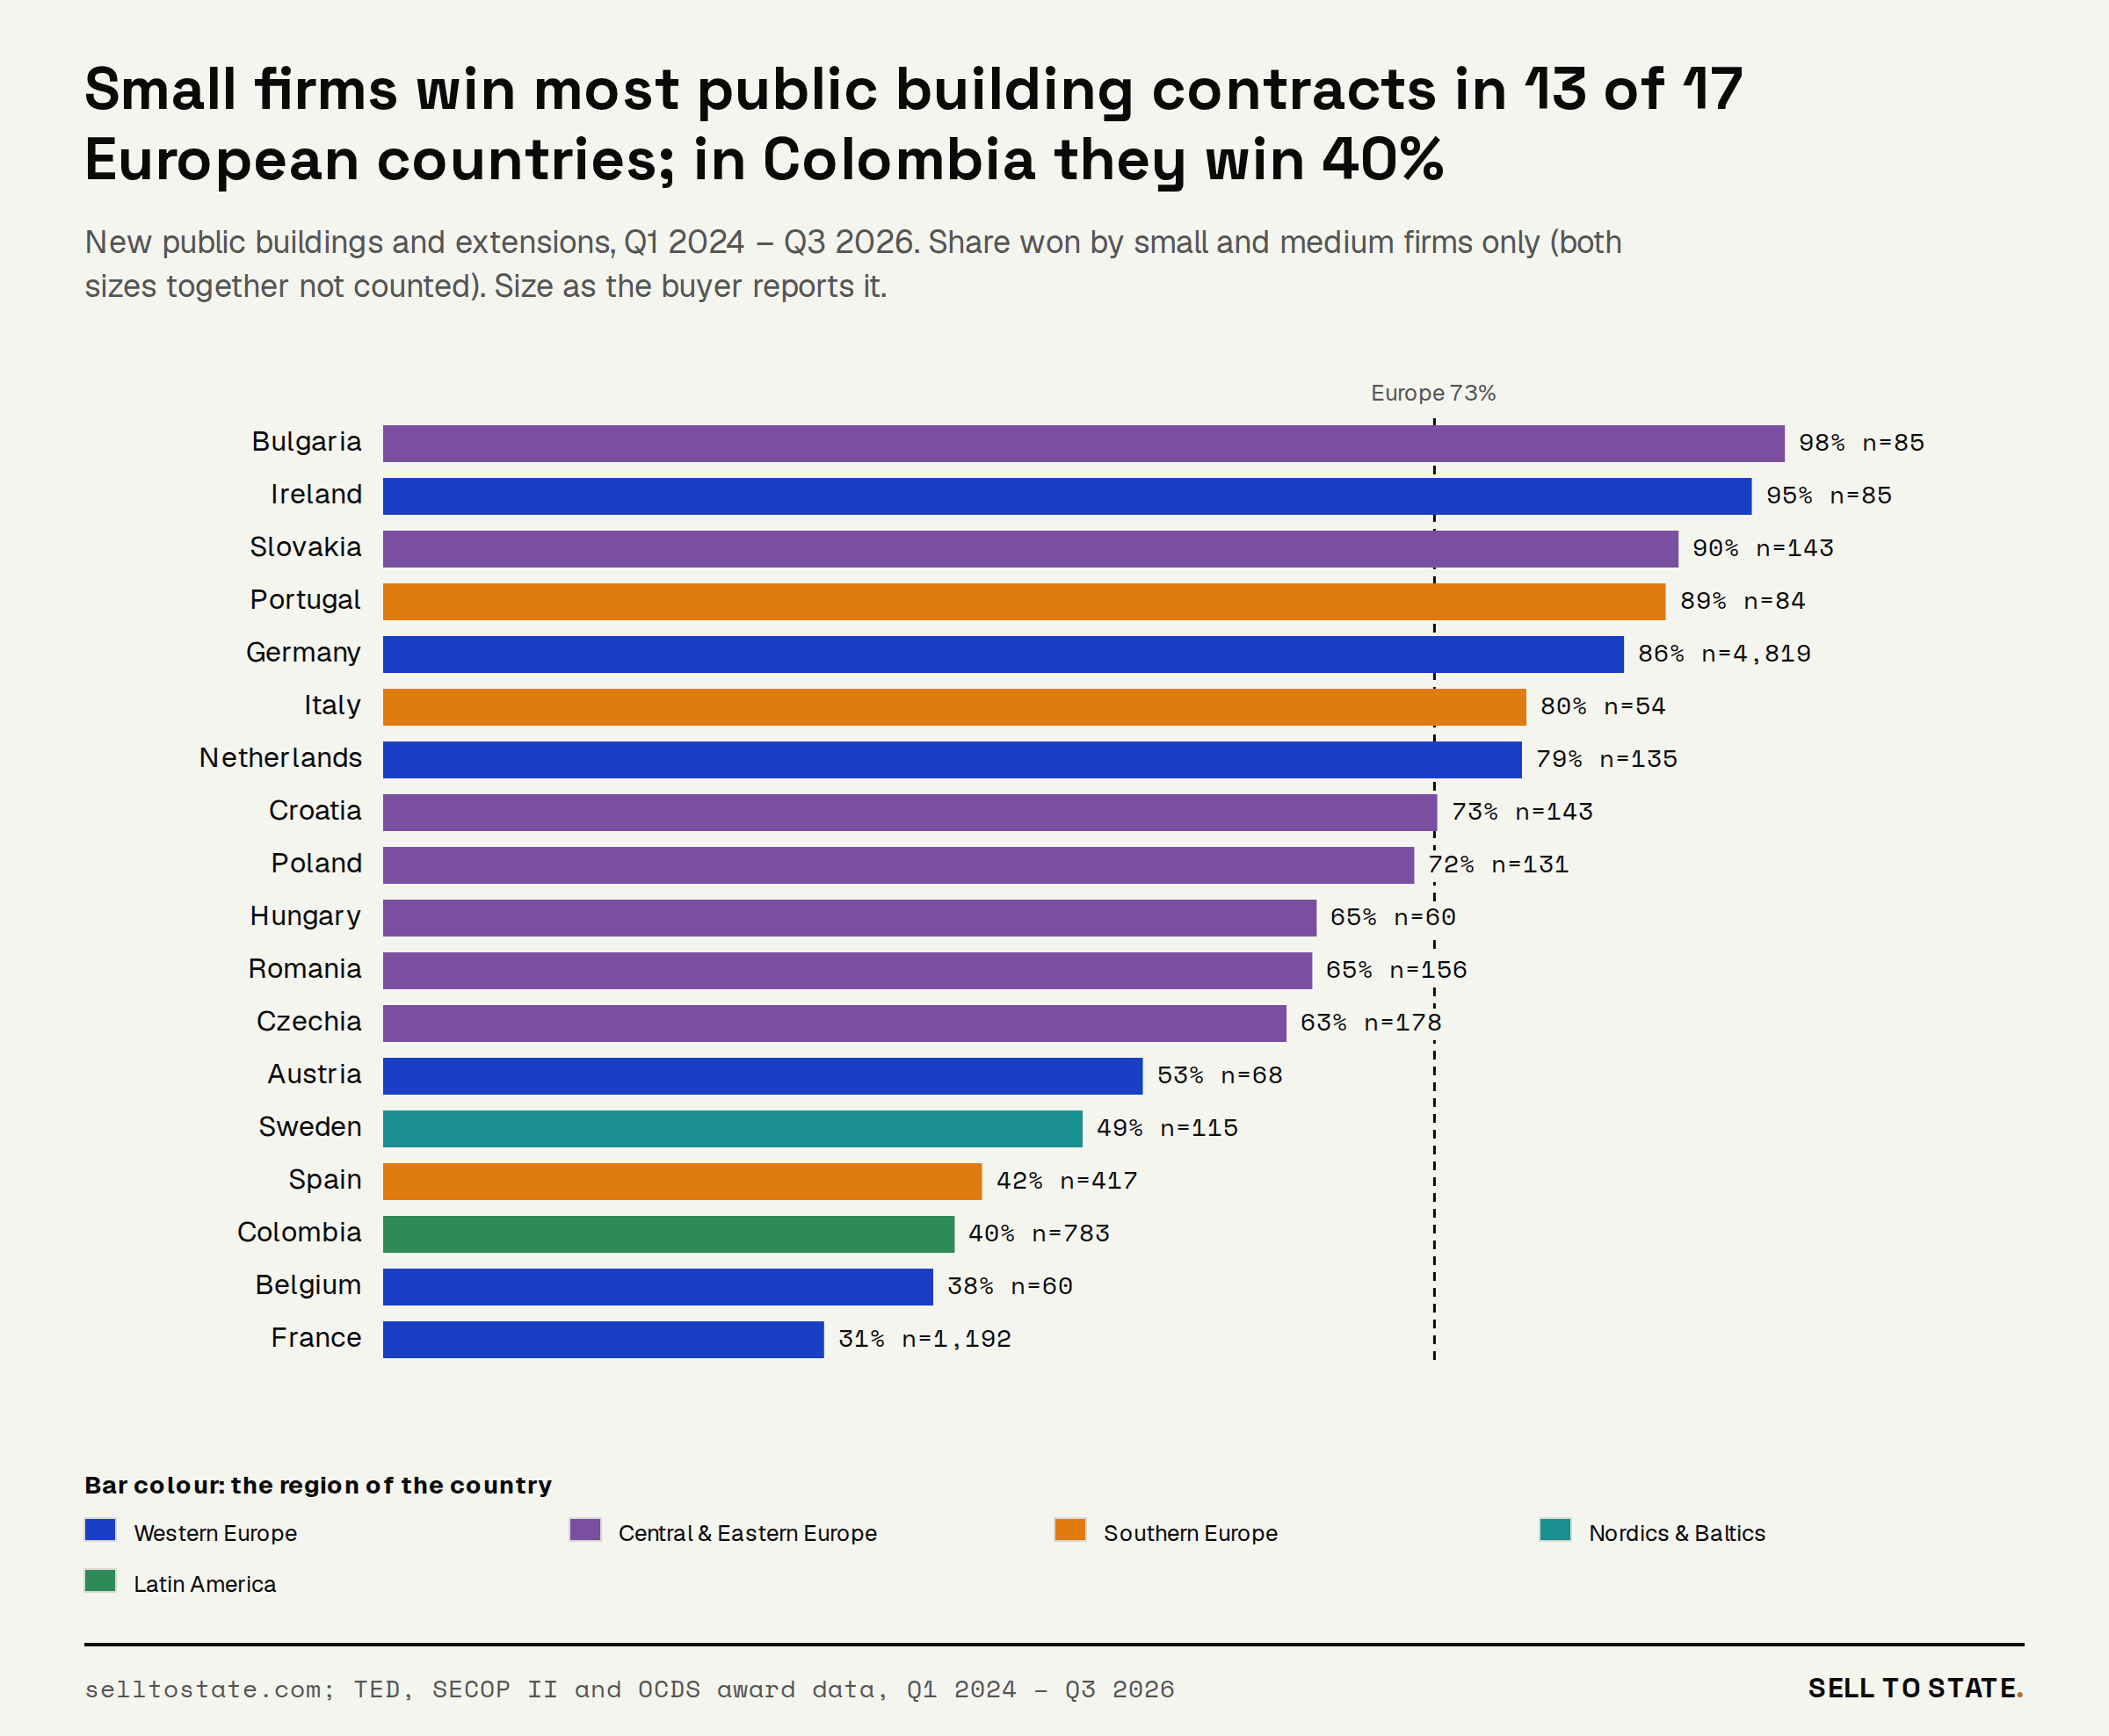
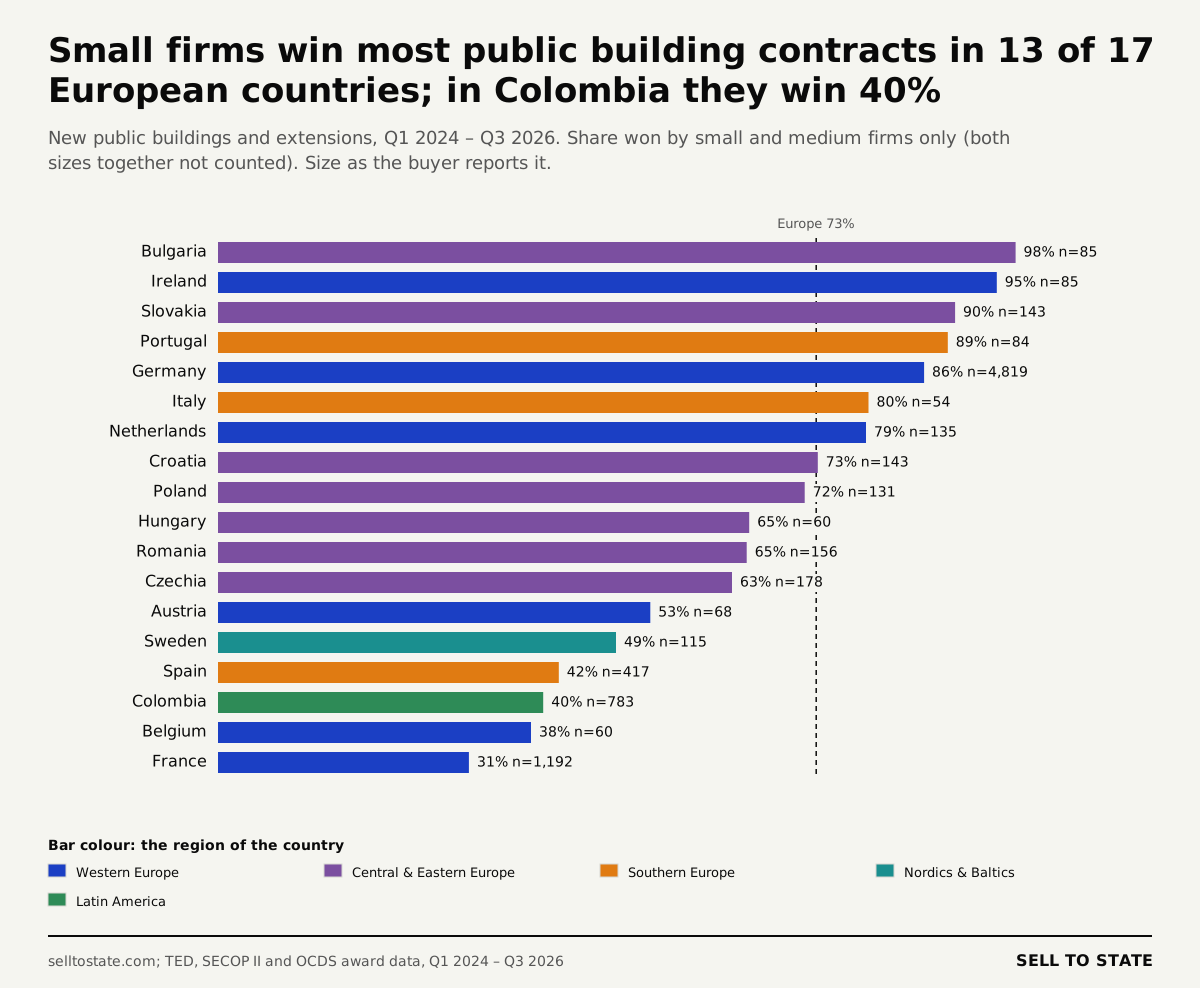
Small firms win most contracts in 13 of 17 European countries. Bulgaria (97.6%), Ireland (95.3%) and Slovakia (90.2%) are at the top. Germany, with 4,819 award notices, is at 86.4%. Sweden (48.7%), Spain (41.7%), Belgium (38.3%) and France (30.7%) are at the bottom. Outside Europe, only Colombia publishes the winner size: in SECOP II, small and medium firms win 39.8% of 783 contracts for new public buildings. The bar colour shows the region.
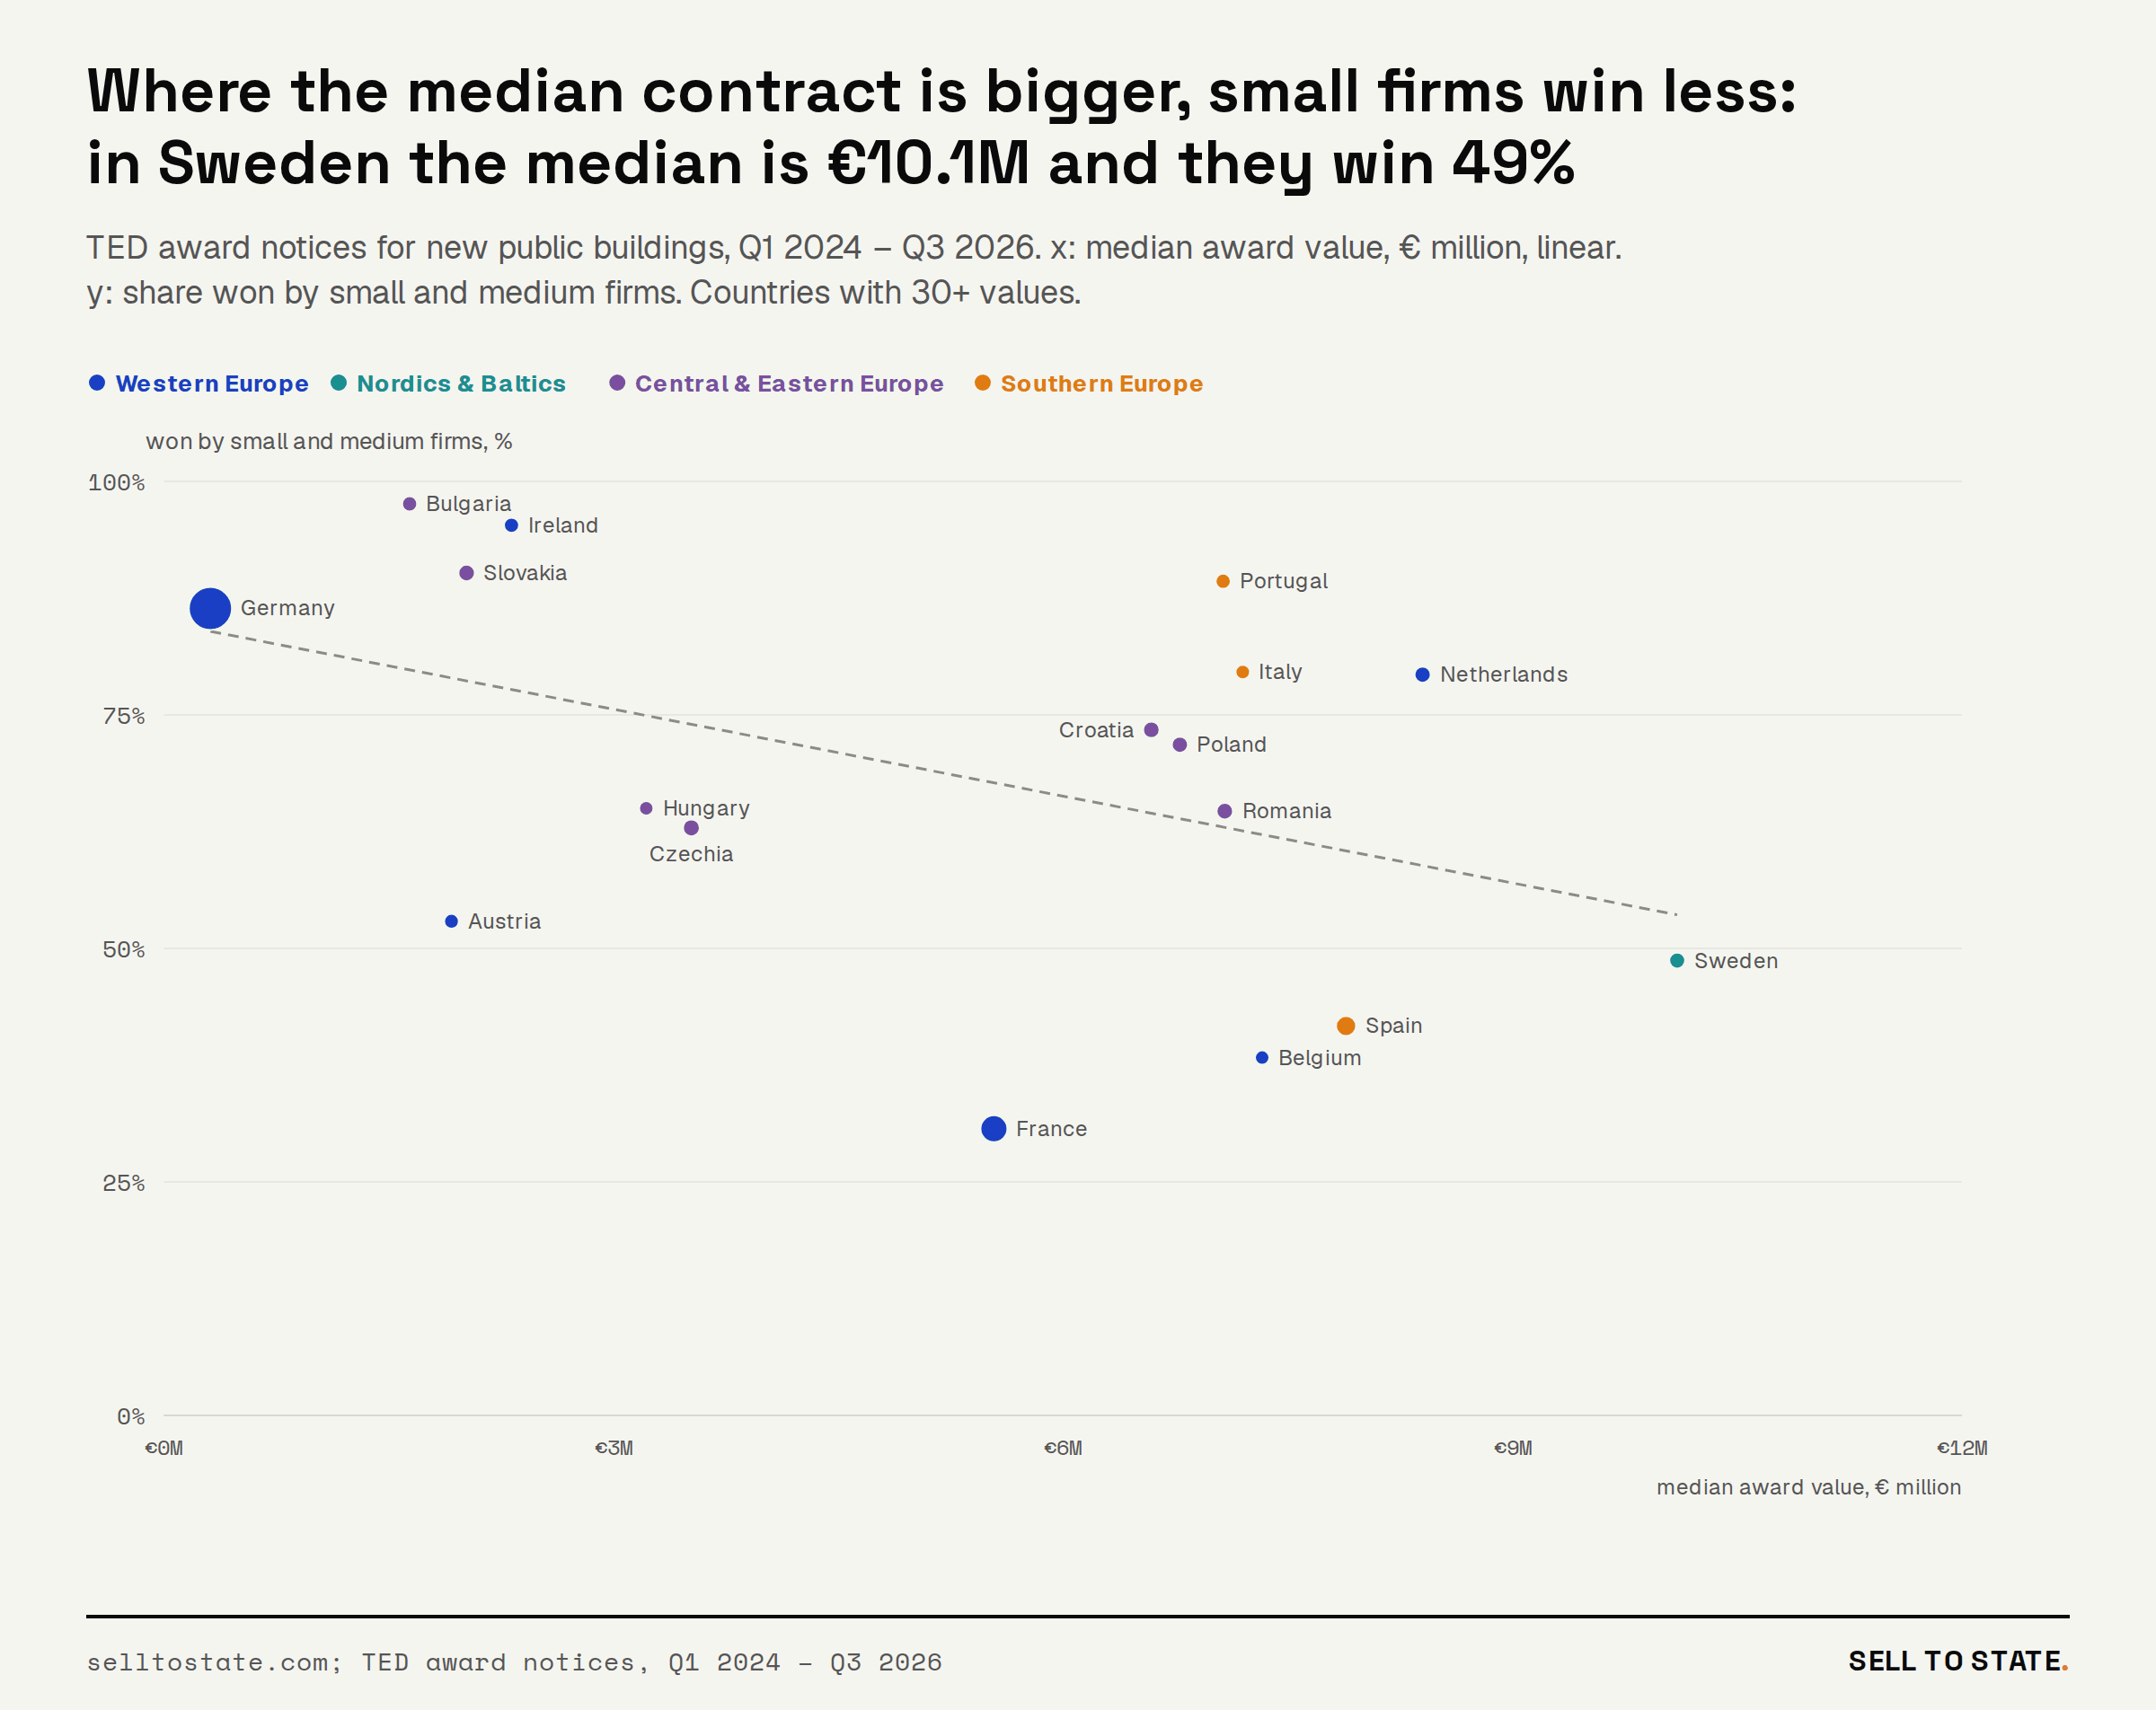
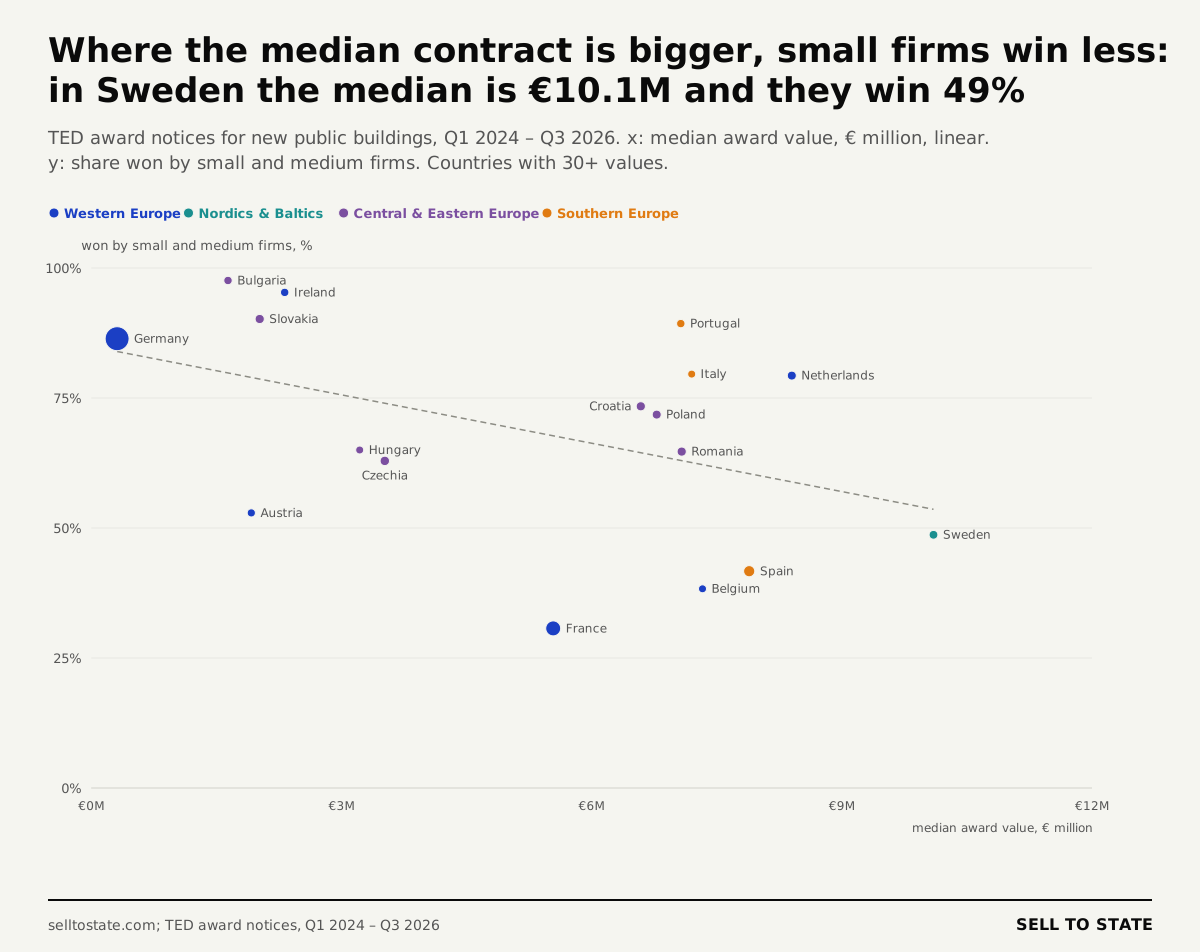
Where the median contract is bigger, small firms win less often. The correlation across 17 European countries is −0.43. In Sweden the median award is €10.1 million, and small firms win 48.7%. In Germany the median award is €310,000, because one award is often one trade lot, and small firms win 86.4%. In France the median award is €5.5 million, and small firms win 30.7%.
Housing goes to large firms more often than any other building type. Small firms win 52.3% of European housing contracts and 62.7% of offices and town halls. They win 77.7% of schools and 79.0% of sports, culture and leisure buildings.
How buyers split a public building into contracts
One building can be one contract or 38. German buyers published 9,264 calls for competition for new public buildings, for 5,884 projects: 1.6 calls per project. The extension of the primary school in Sugenheim, in Bavaria, produced 38 calls. In Germany and France, 46.6% of award titles name a trade lot, such as the shell, the roof, the windows, the heating or the lifts.
Frameworks are a second way to buy a building. 494 records in our European pull are framework agreements or dynamic purchasing systems. Bucharest Sector 4 runs a framework for its school buildings, and Concelex, Construcții Erbașu and Bog’Art each won 36 awards under it. A framework counts as a building procurement, and its ceiling value stays out of the money totals.
Some buyers publish the same building many times. Zagreb published 10 calls for competition for the Podbrežje kindergarten before it signed a contract. Croatian buyers published 1,479 building records for 180 projects. So the study counts procurements, and the bids count per lot.
How many companies bid on construction tenders
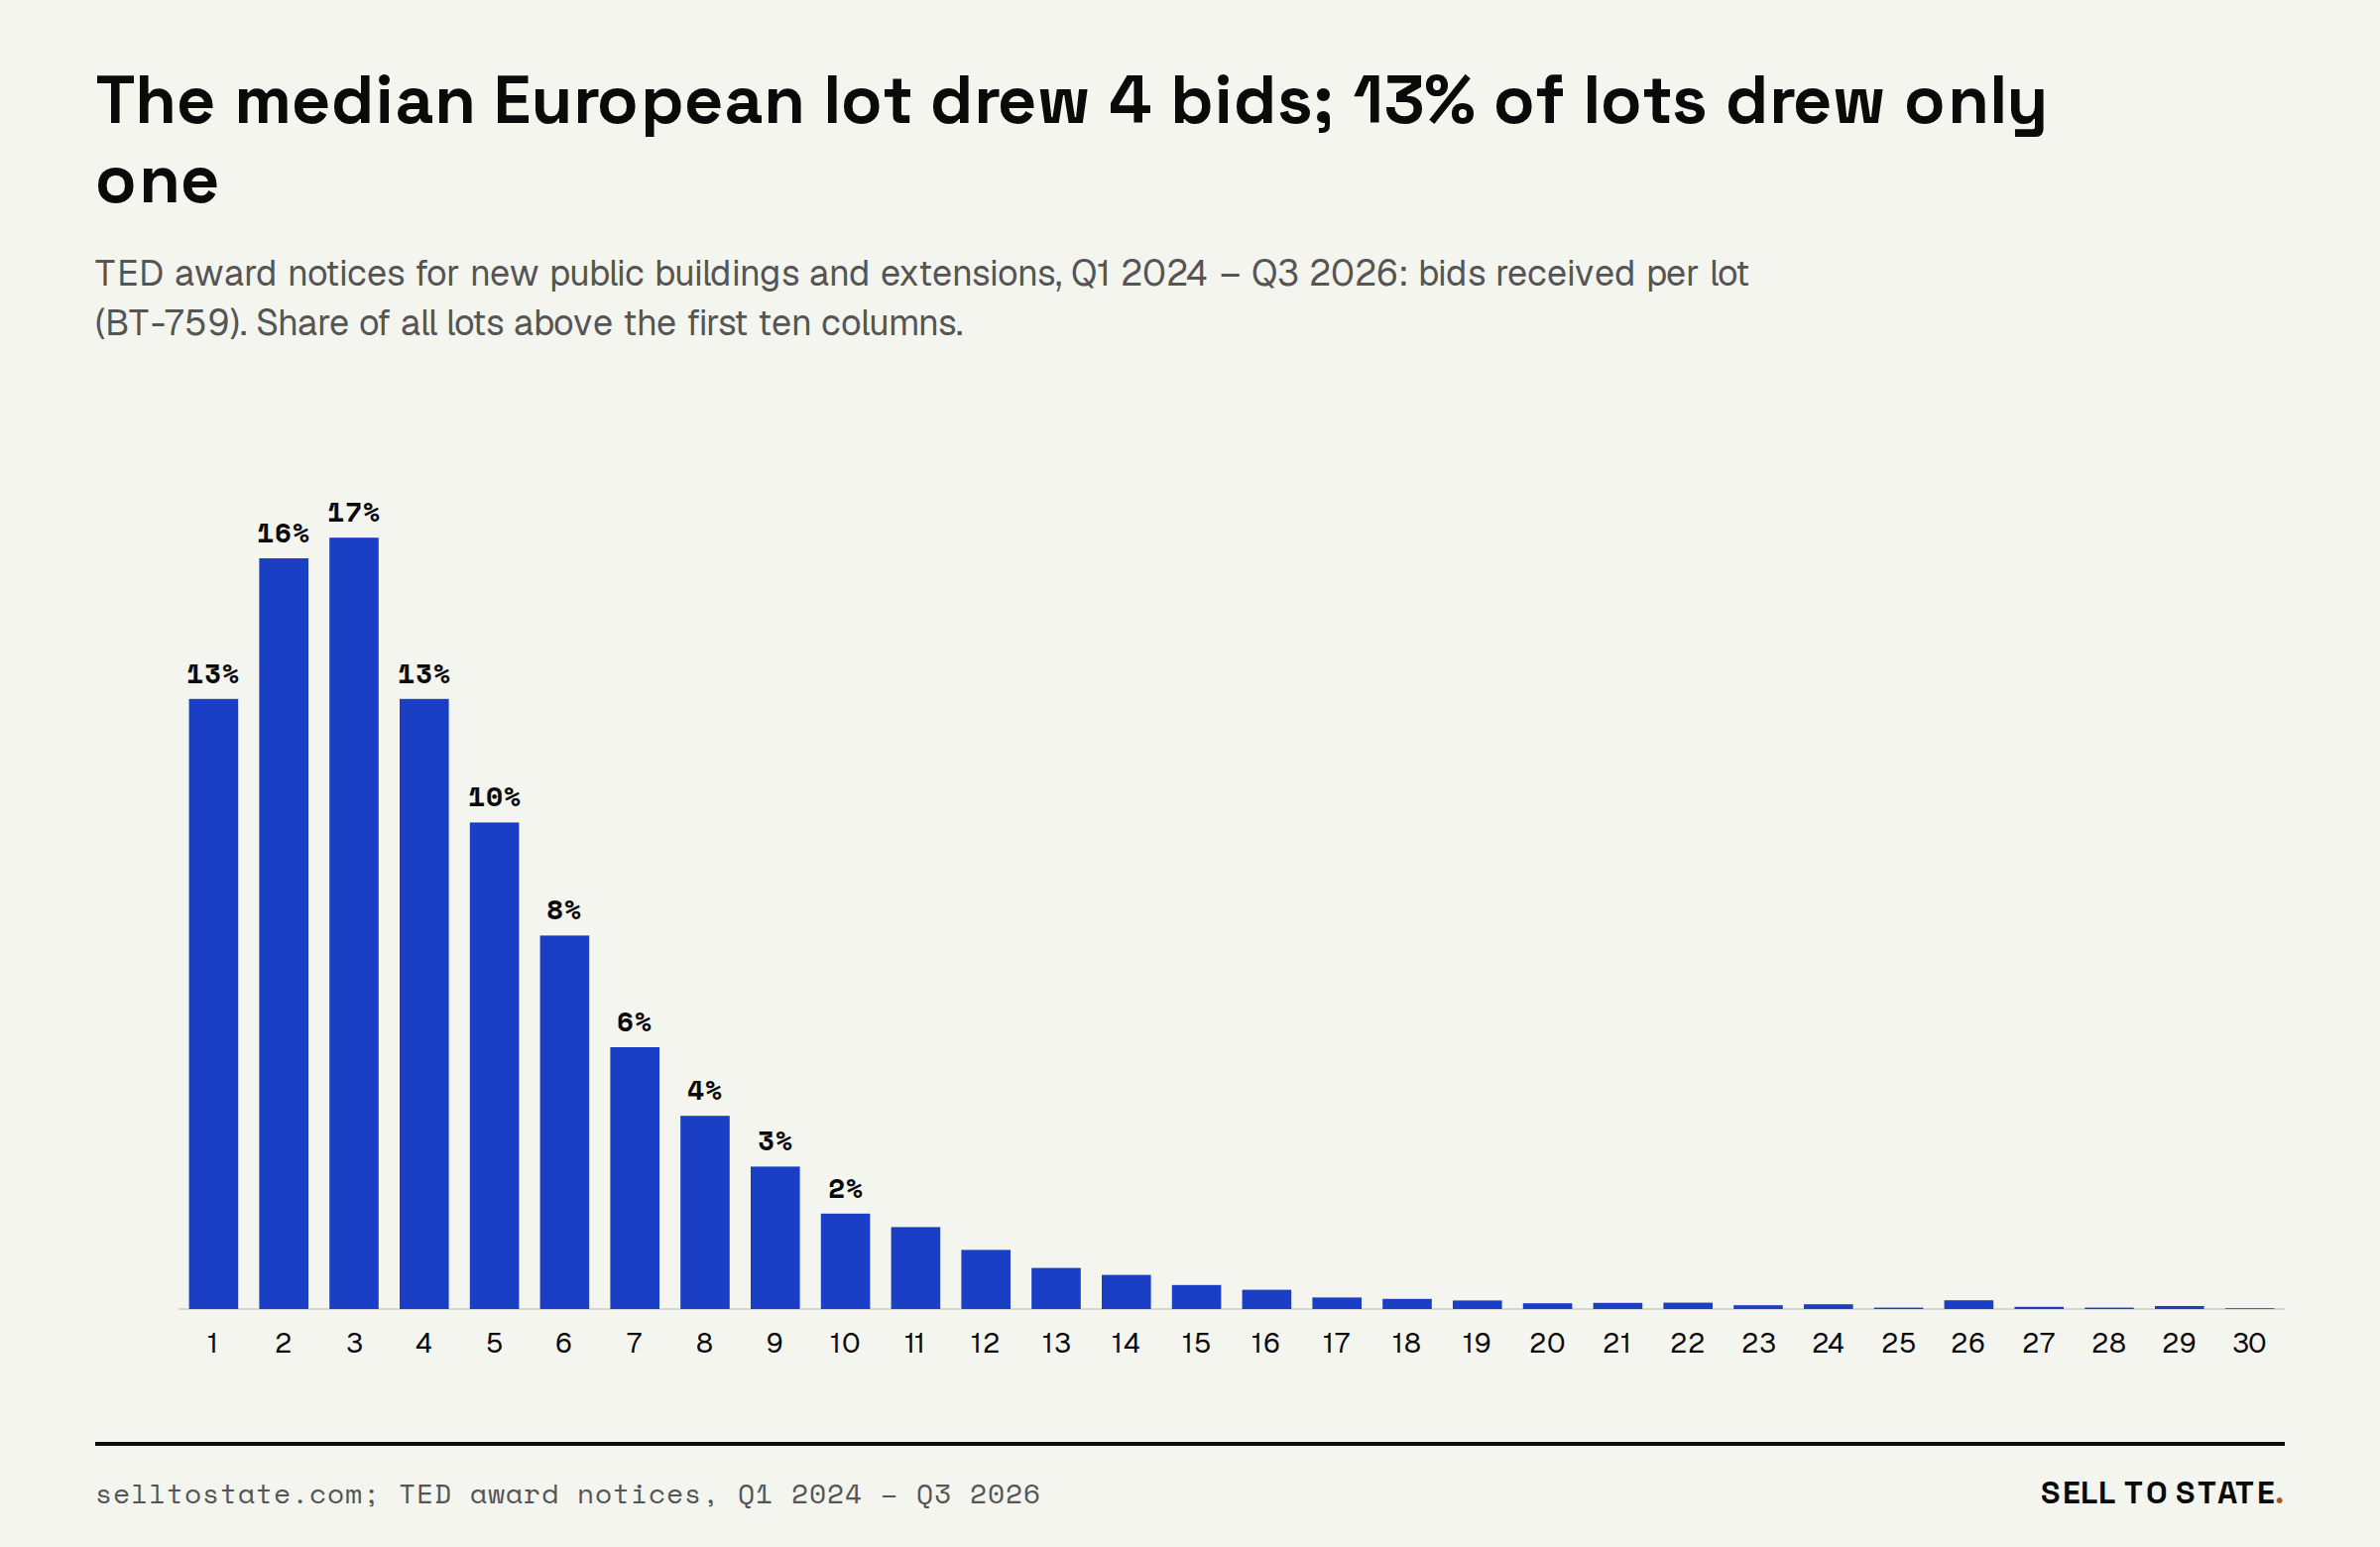
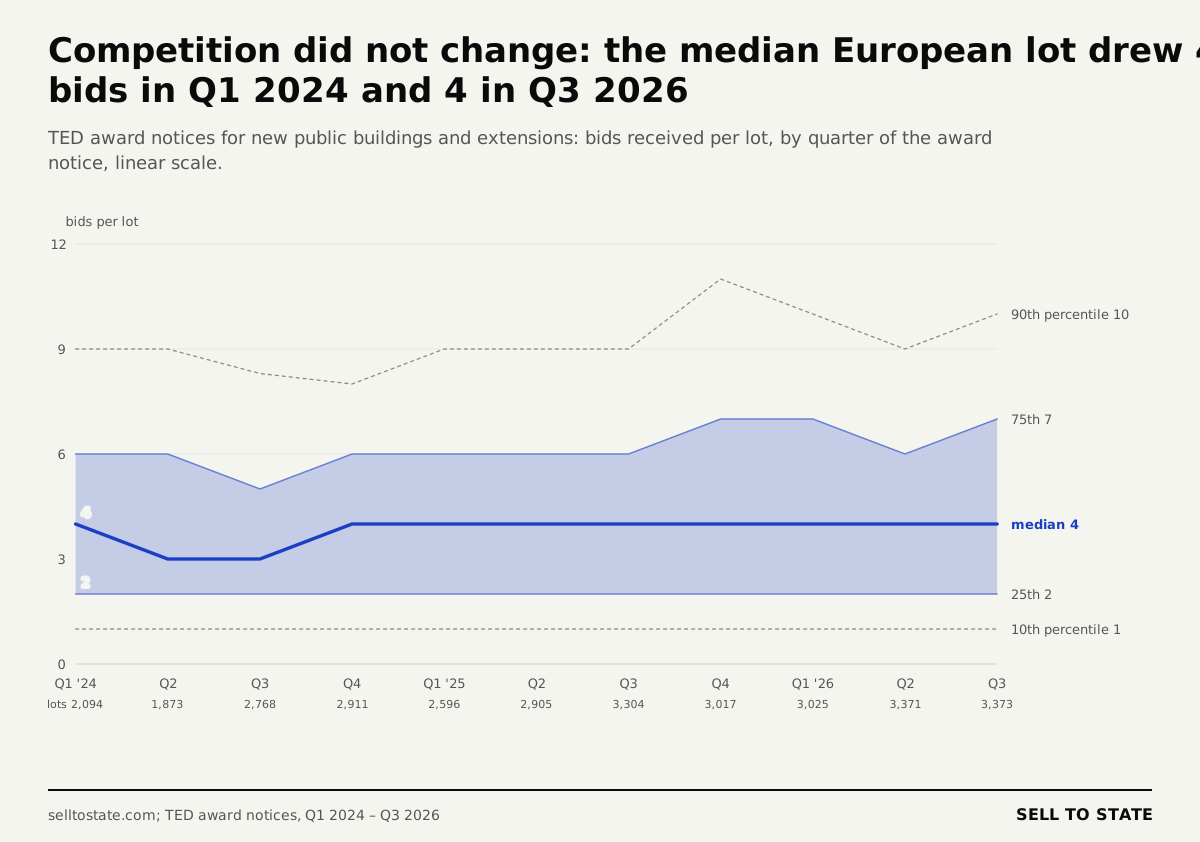
The median lot in Europe drew 4 bids. The middle half of the lots drew 2 to 6 bids, and one lot in 10 drew 9 or more. 13.1% of the 31,237 lots drew a single bid, and 40.9% drew 5 bids or more. 94 lots drew more than 30 bids.
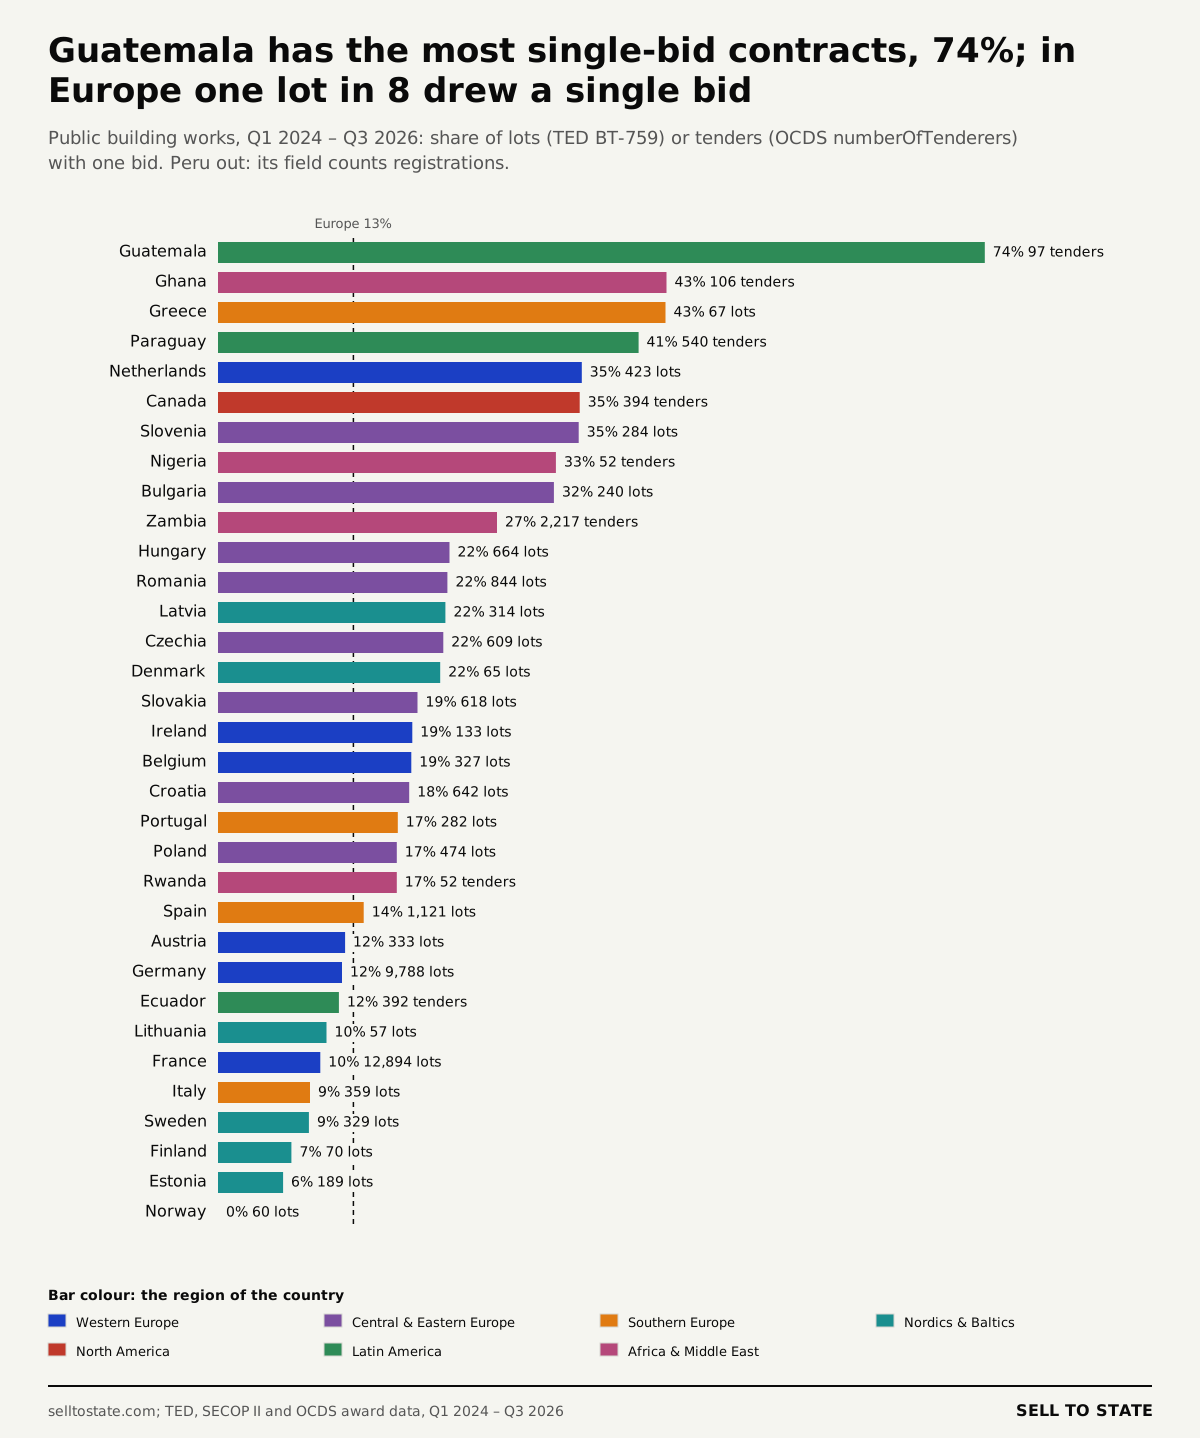
Guatemala, Ghana and Paraguay have the most single-bid contracts. In Guatemala, 74.2% of the tenders for a public building had one bidder, in Ghana 43.4% and in Paraguay 40.7%. In Europe, Greece is highest with 43.3% of lots, and the Netherlands follows with 35.2%; 68.8% of the Dutch award notices come from restricted procedures, where the buyer invites a short list. In Zambia, 27.0% of 2,217 tenders drew one bid. In Ecuador, 11.7% did, and in Norway none of 60 lots did. Outside Europe, the count is per tender, and a tender with several lots can hide a single-bid lot.
Outside Europe, the median tender for a public building drew 3 bids in Zambia, 5 in Ecuador, 2 in Paraguay and 1 in Guatemala. Peru reports a median of 16 in the same field, far above any other country, because the field counts registered participants. We leave Peru out of the bid counts.
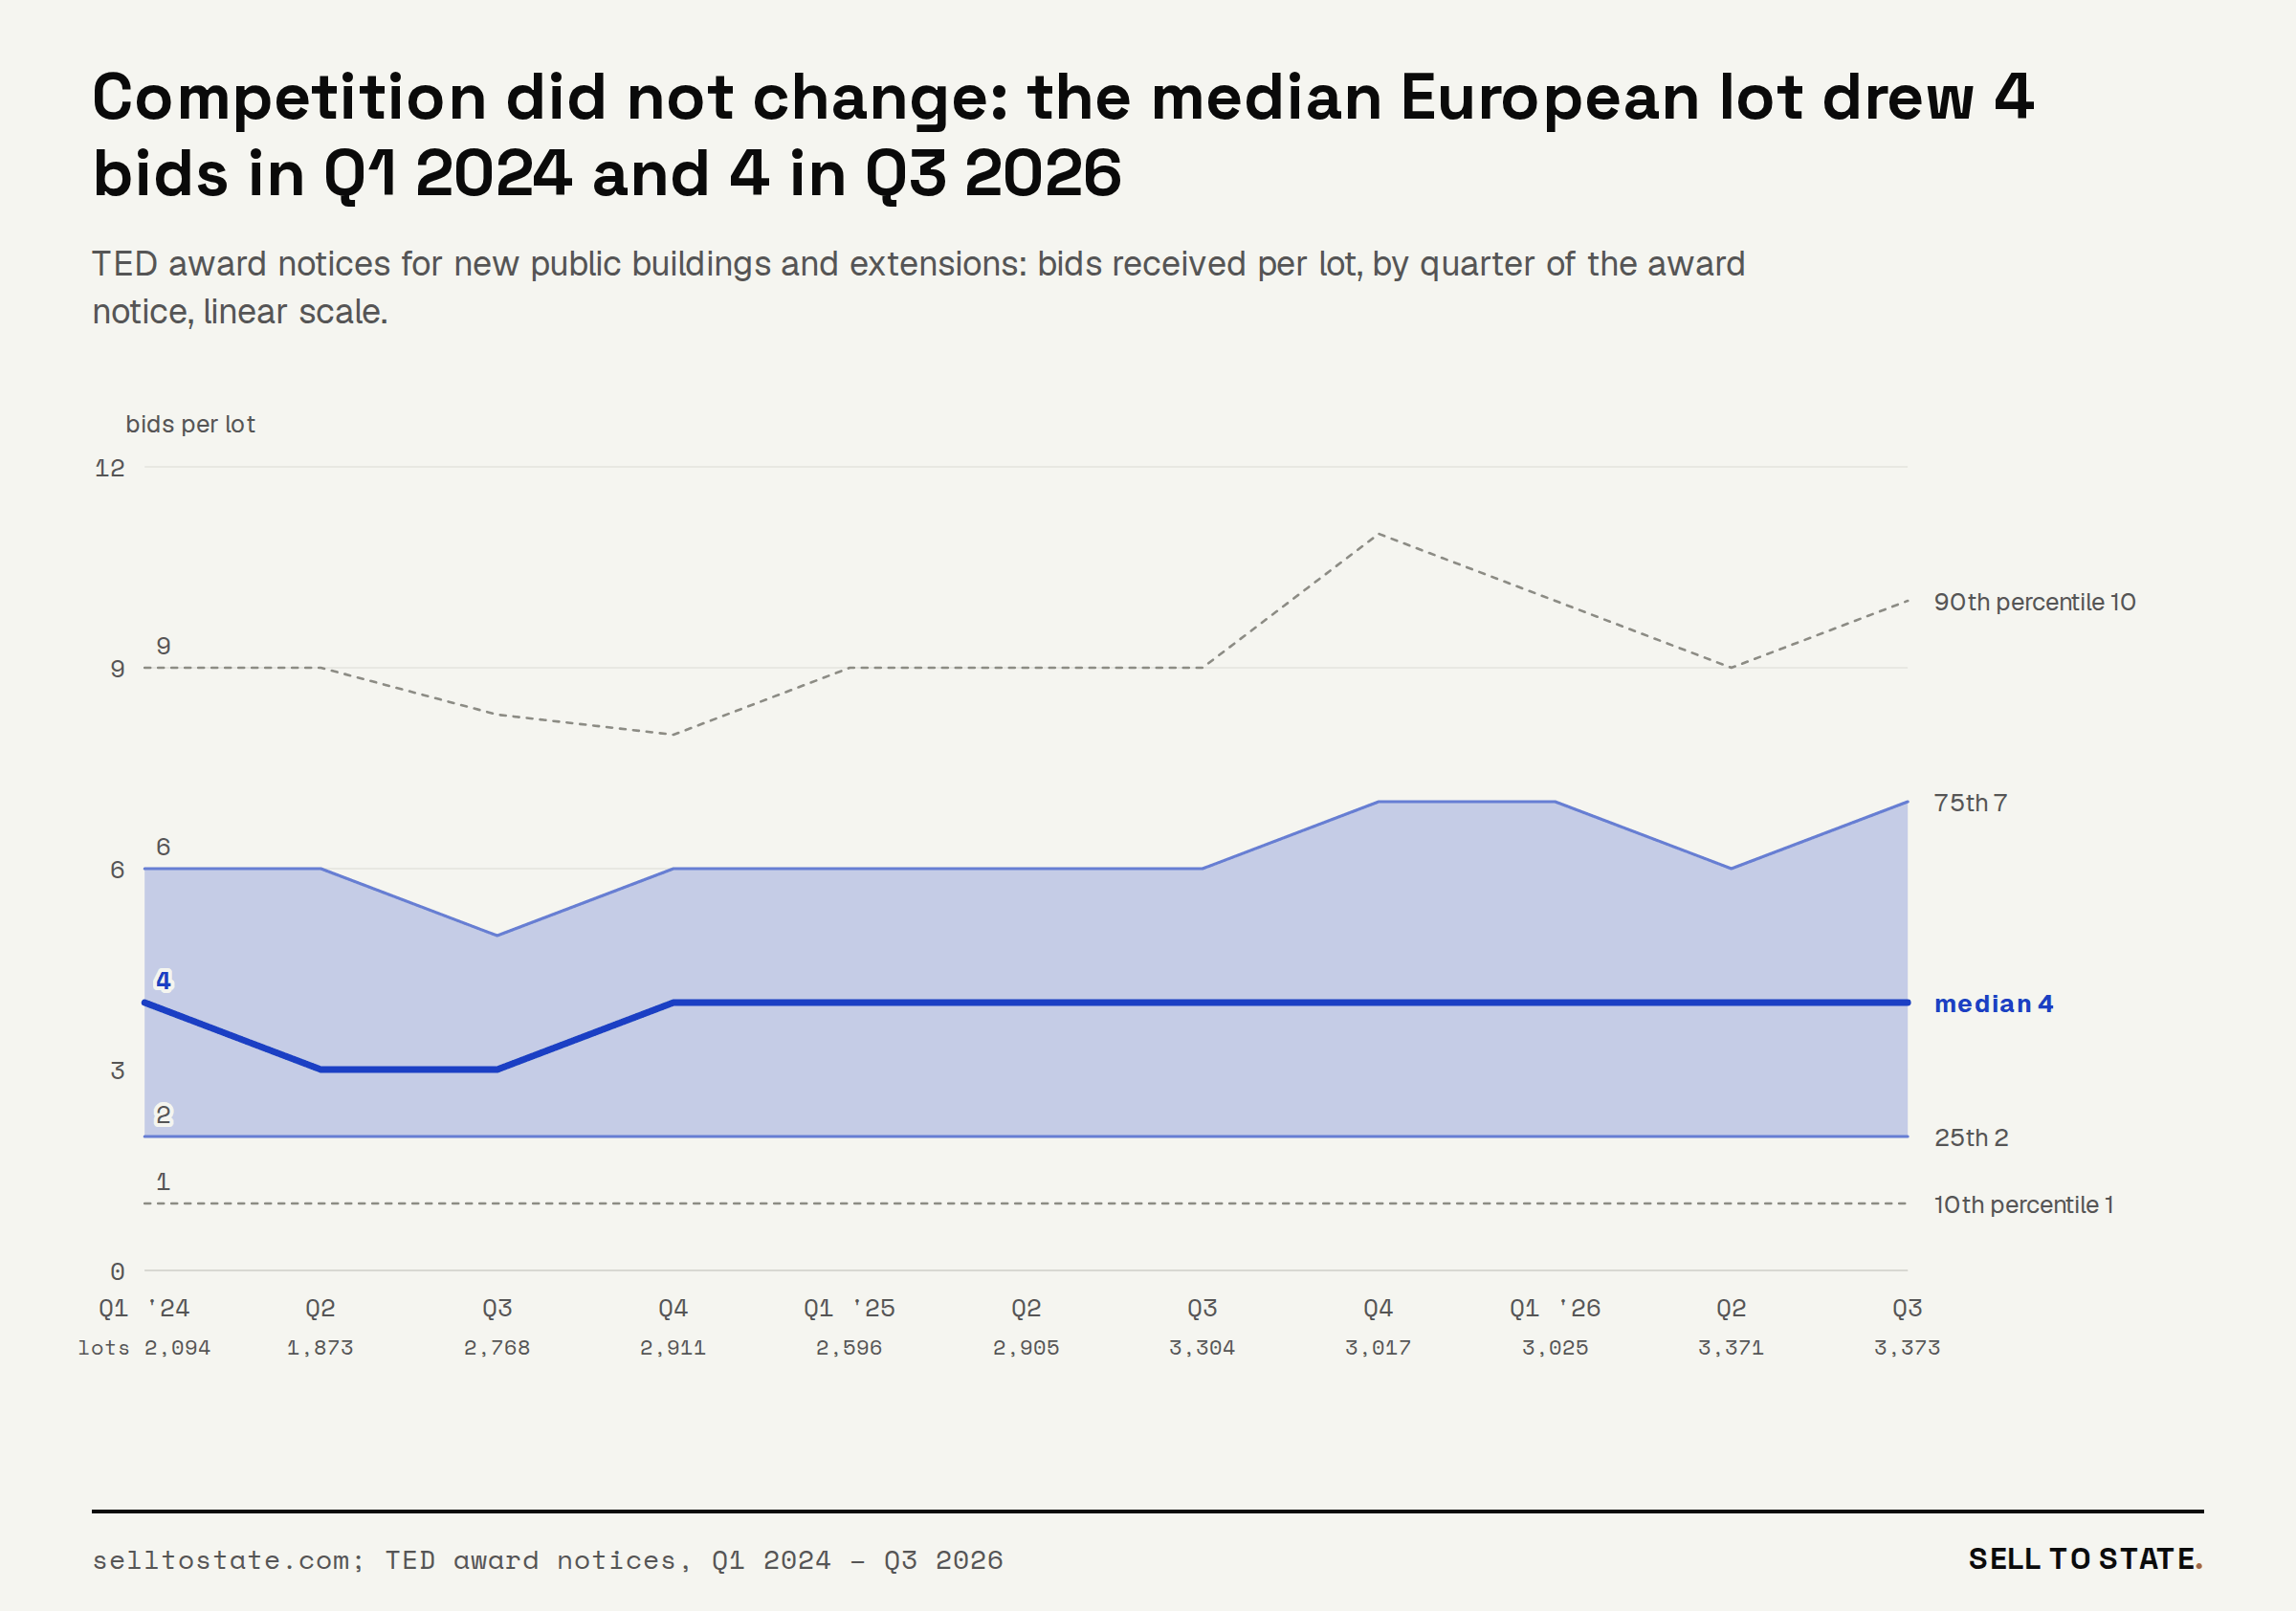
Competition for European public building contracts did not change from 2024 to 2026. The median lot drew 4 bids in Q1 2024 and 4 bids in Q3 2026. The 75th percentile went from 6 to 7 bids, and the 25th percentile stayed at 2.
Foreign firms win 1.4% of public building contracts in Europe
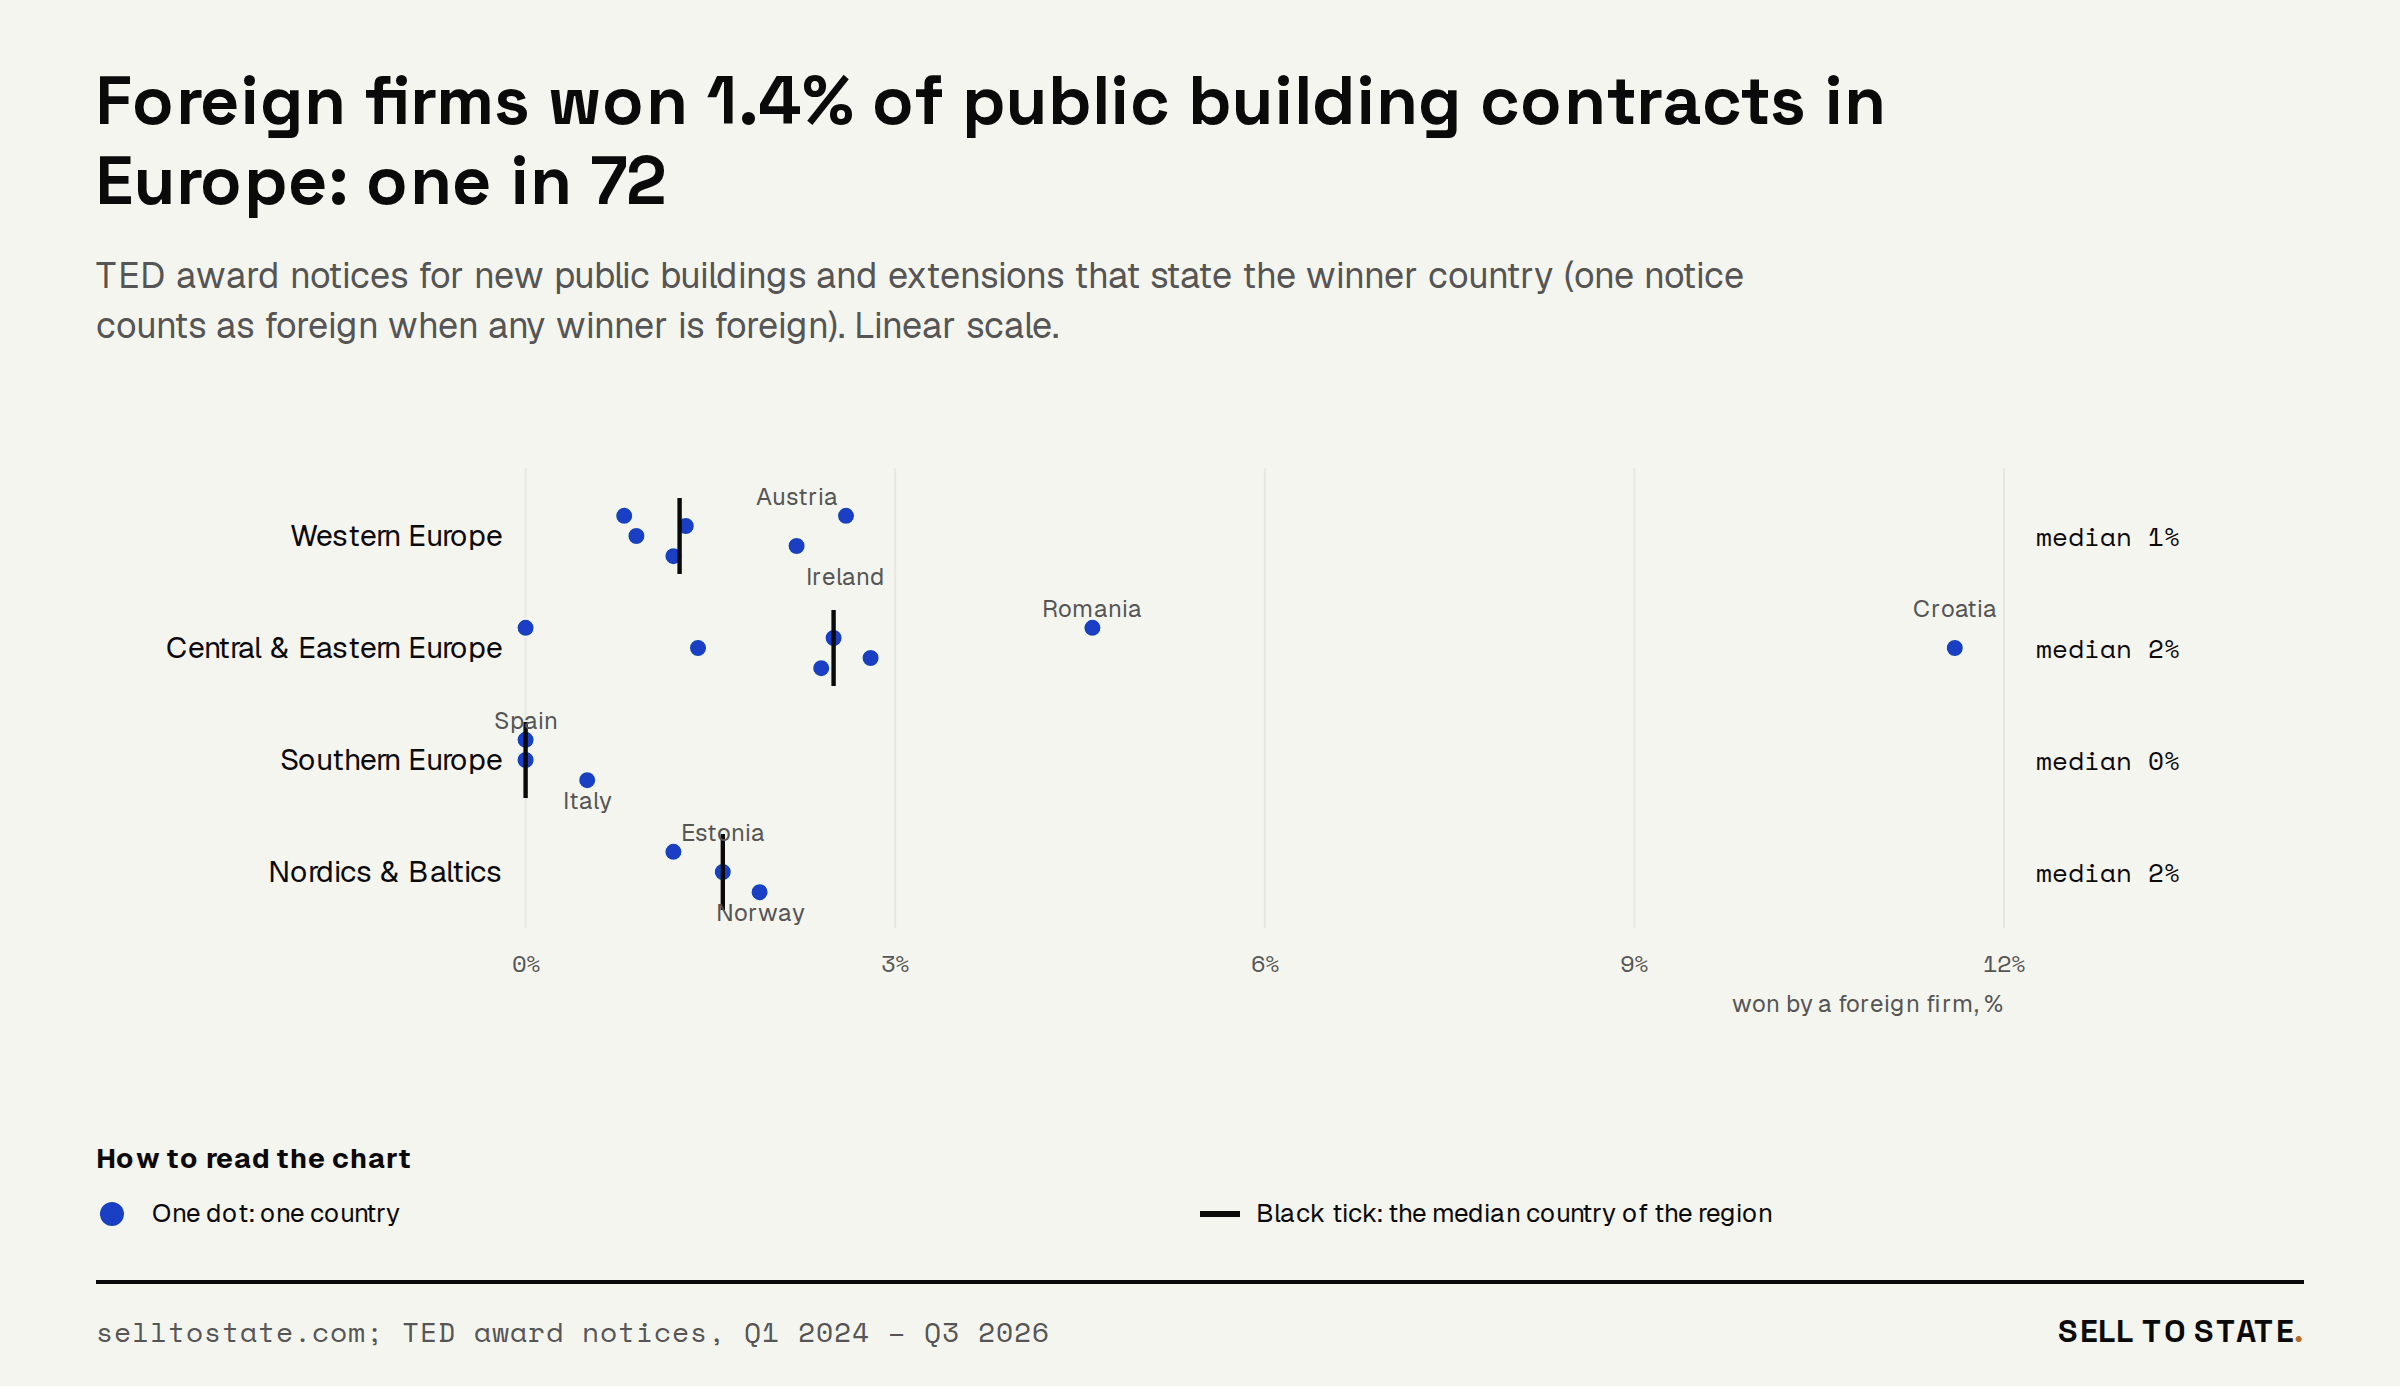
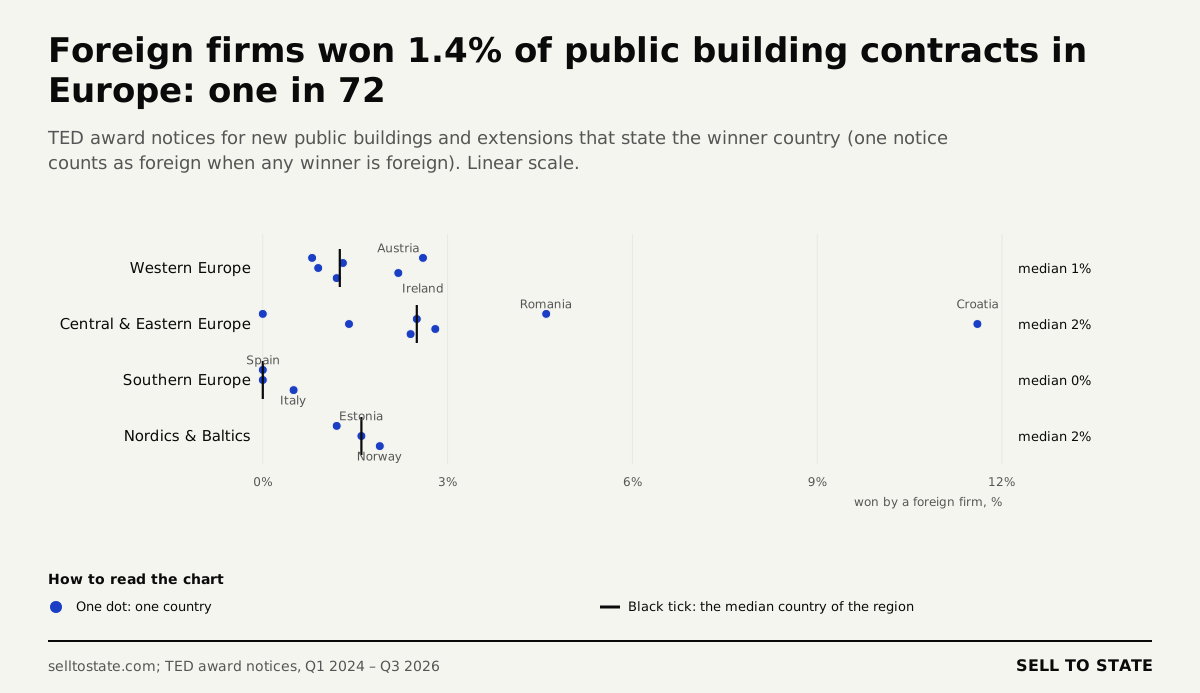
Only TED states the country of the winner, and European contracts stay at home. Foreign firms won 136 of 9,801 TED award notices that state the winner country: 1.4%, or one in 72. They won 4.3% of the money, because their contracts are larger. In Spain, Portugal and Hungary, no award notice for a new public building went to a foreign firm. Outside Europe, the matrix of the top winners shows the same pattern.
Croatia has the highest foreign share, 11.6%. Firms from Serbia won 8 Croatian award notices and firms from Slovenia 7; 11 of the 17 foreign wins are schools and kindergartens. Modulor of Belgrade won the Podbrežje kindergarten in Zagreb for €6.7 million. Romania follows at 4.6%.
Public construction tenders over time in Europe
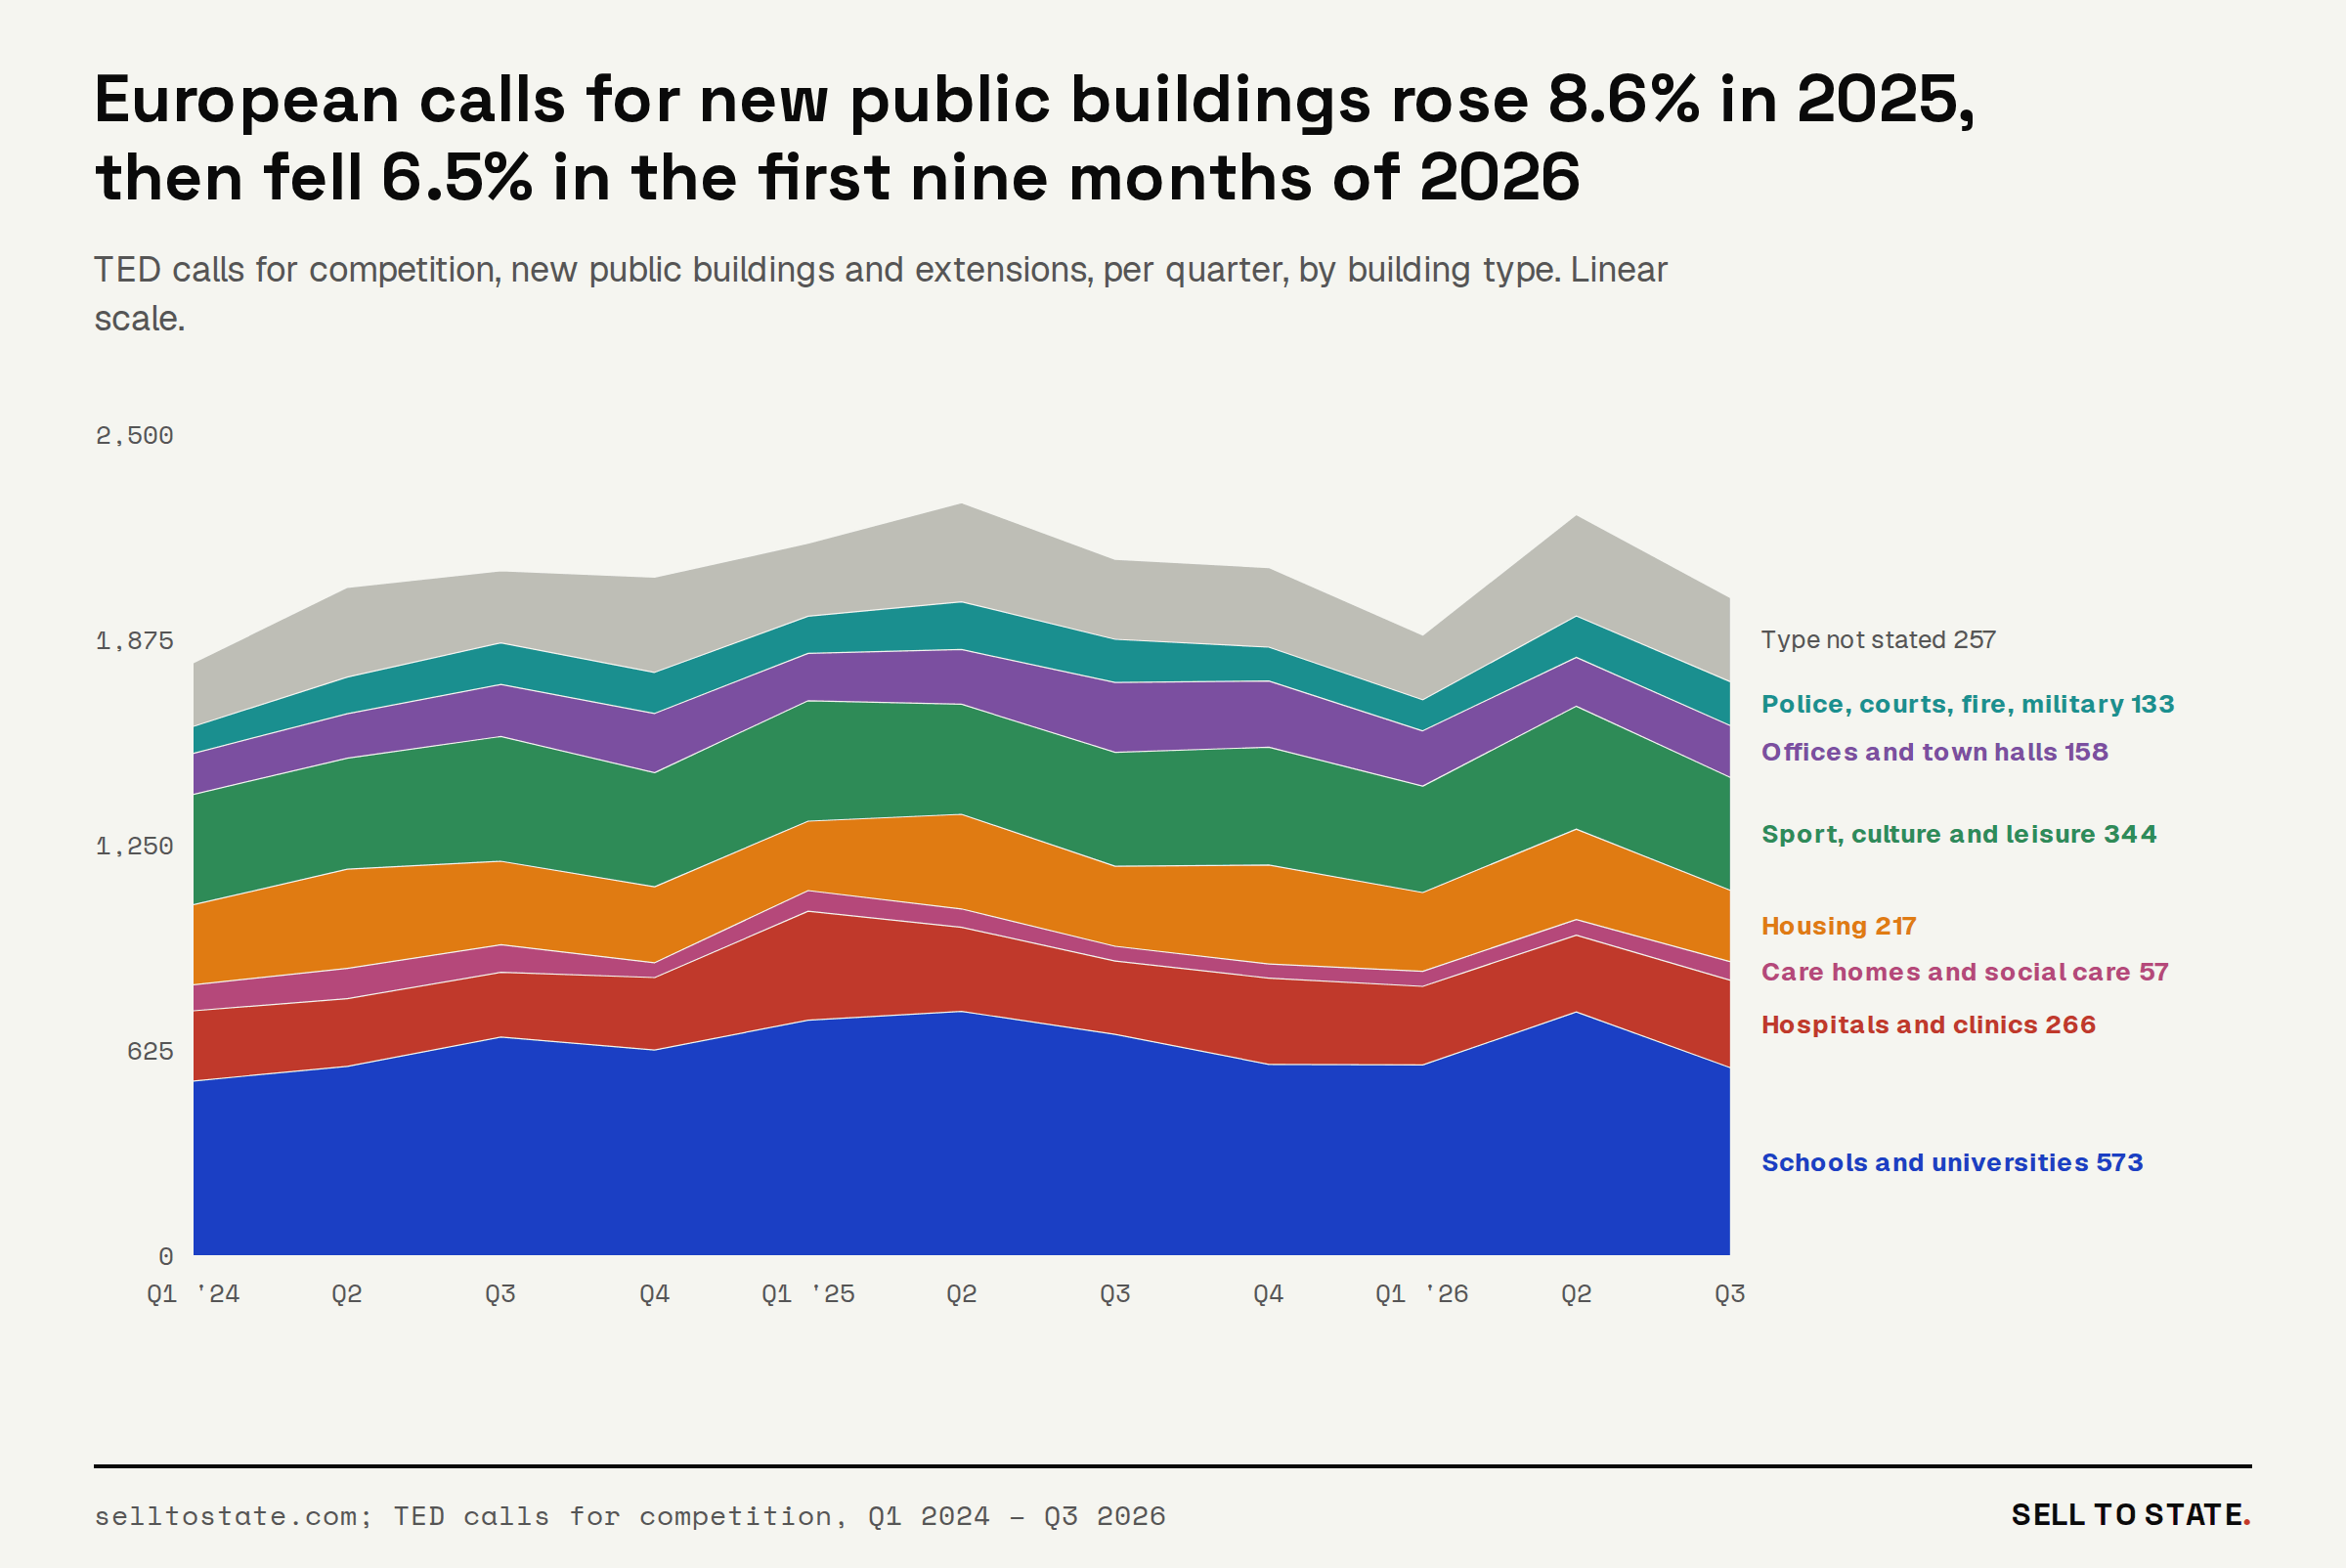
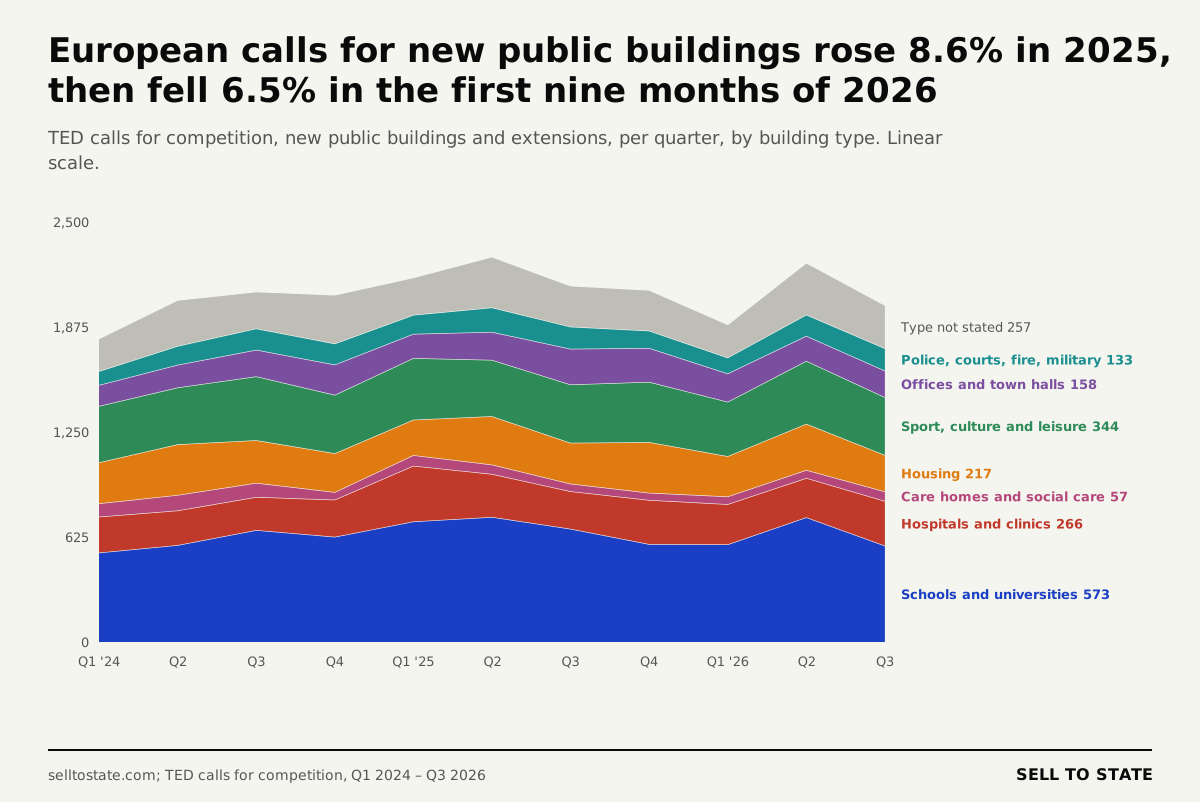
European calls for new public buildings rose 8.6% in 2025, then fell 6.5% in the first nine months of 2026. TED buyers published 7,992 calls in 2024, 8,677 in 2025 and 6,152 in the first three quarters of 2026. TED is the only source in the study that is complete in every quarter. National feeds in production start at different dates, so we do not draw a world trend.
Public building contract values
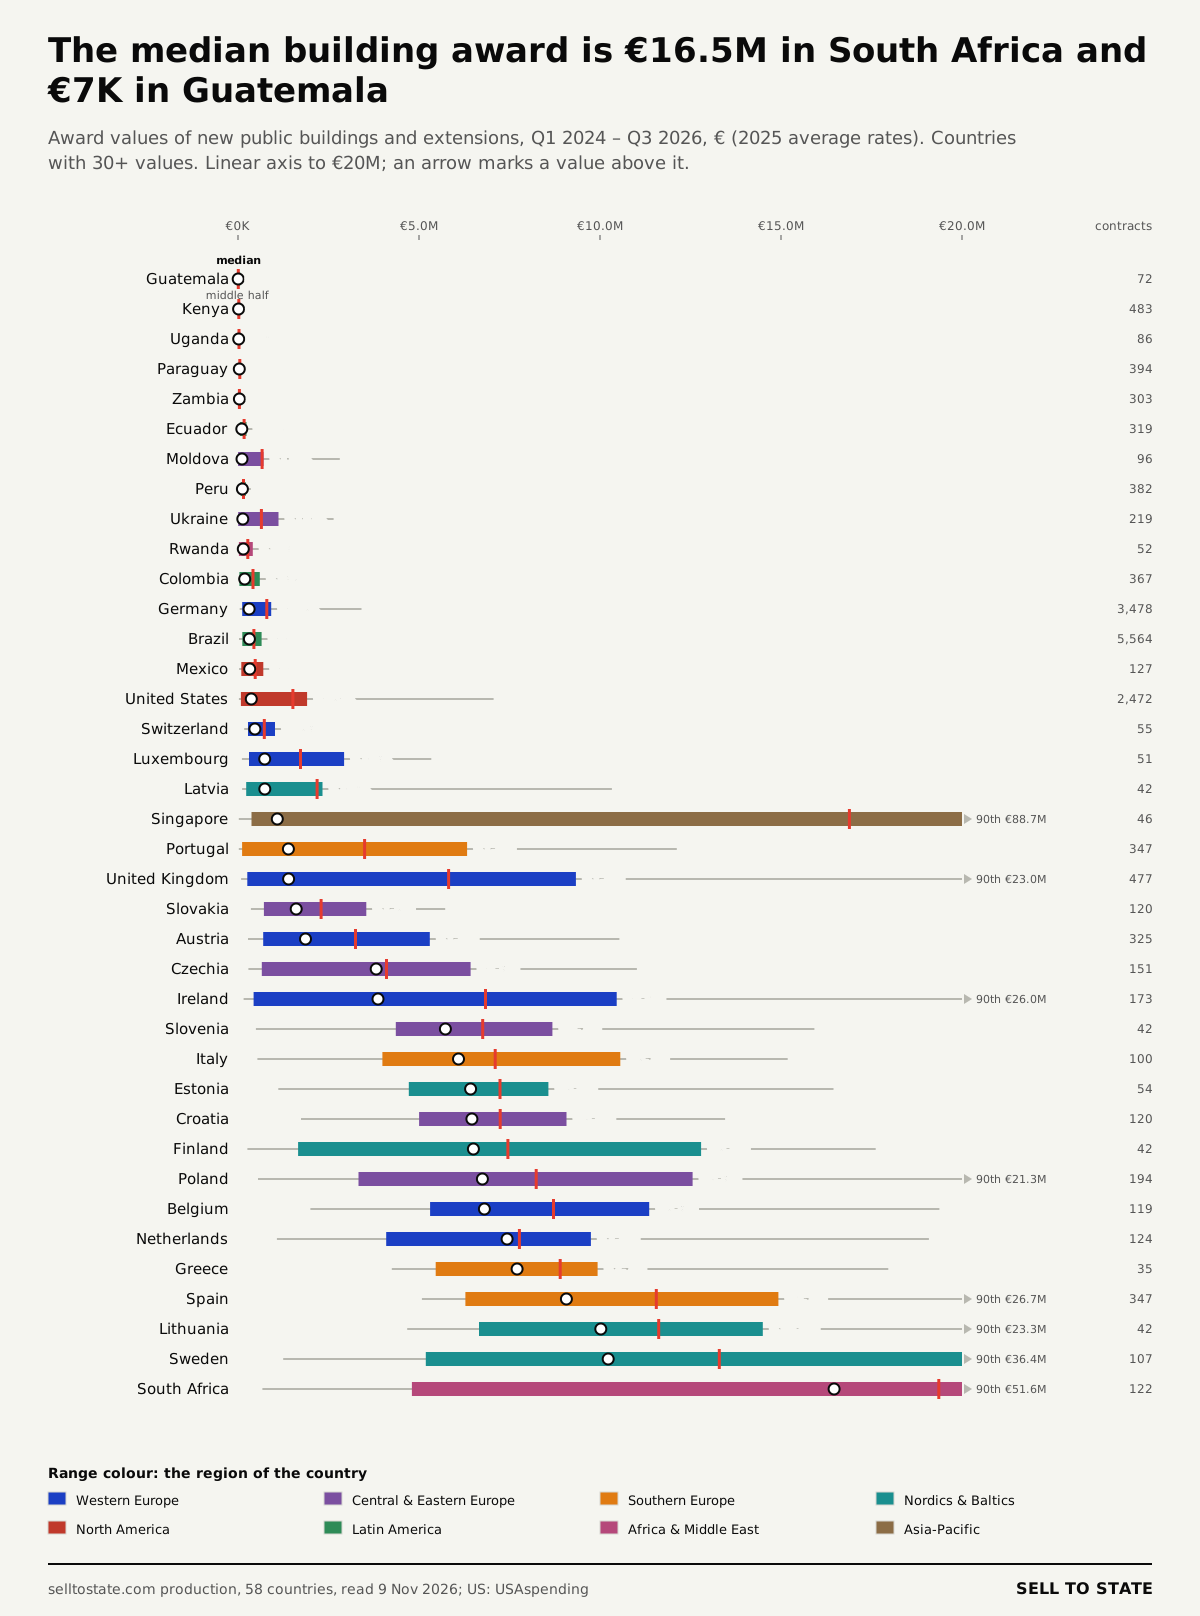
The median award for a public building is €16.5 million in South Africa and €6,843 in Guatemala. Sweden (€10.2 million), Lithuania (€10.0 million) and Spain (€9.1 million) follow South Africa. Germany is at €305,943, because German buyers award trade lots. Brazil is at €313,780 and the United States at €367,113. Kenya is at €17,105 and Paraguay at €37,200, where the portals list single classrooms. A country with a TED source shows works above the EU threshold, so its median is higher.
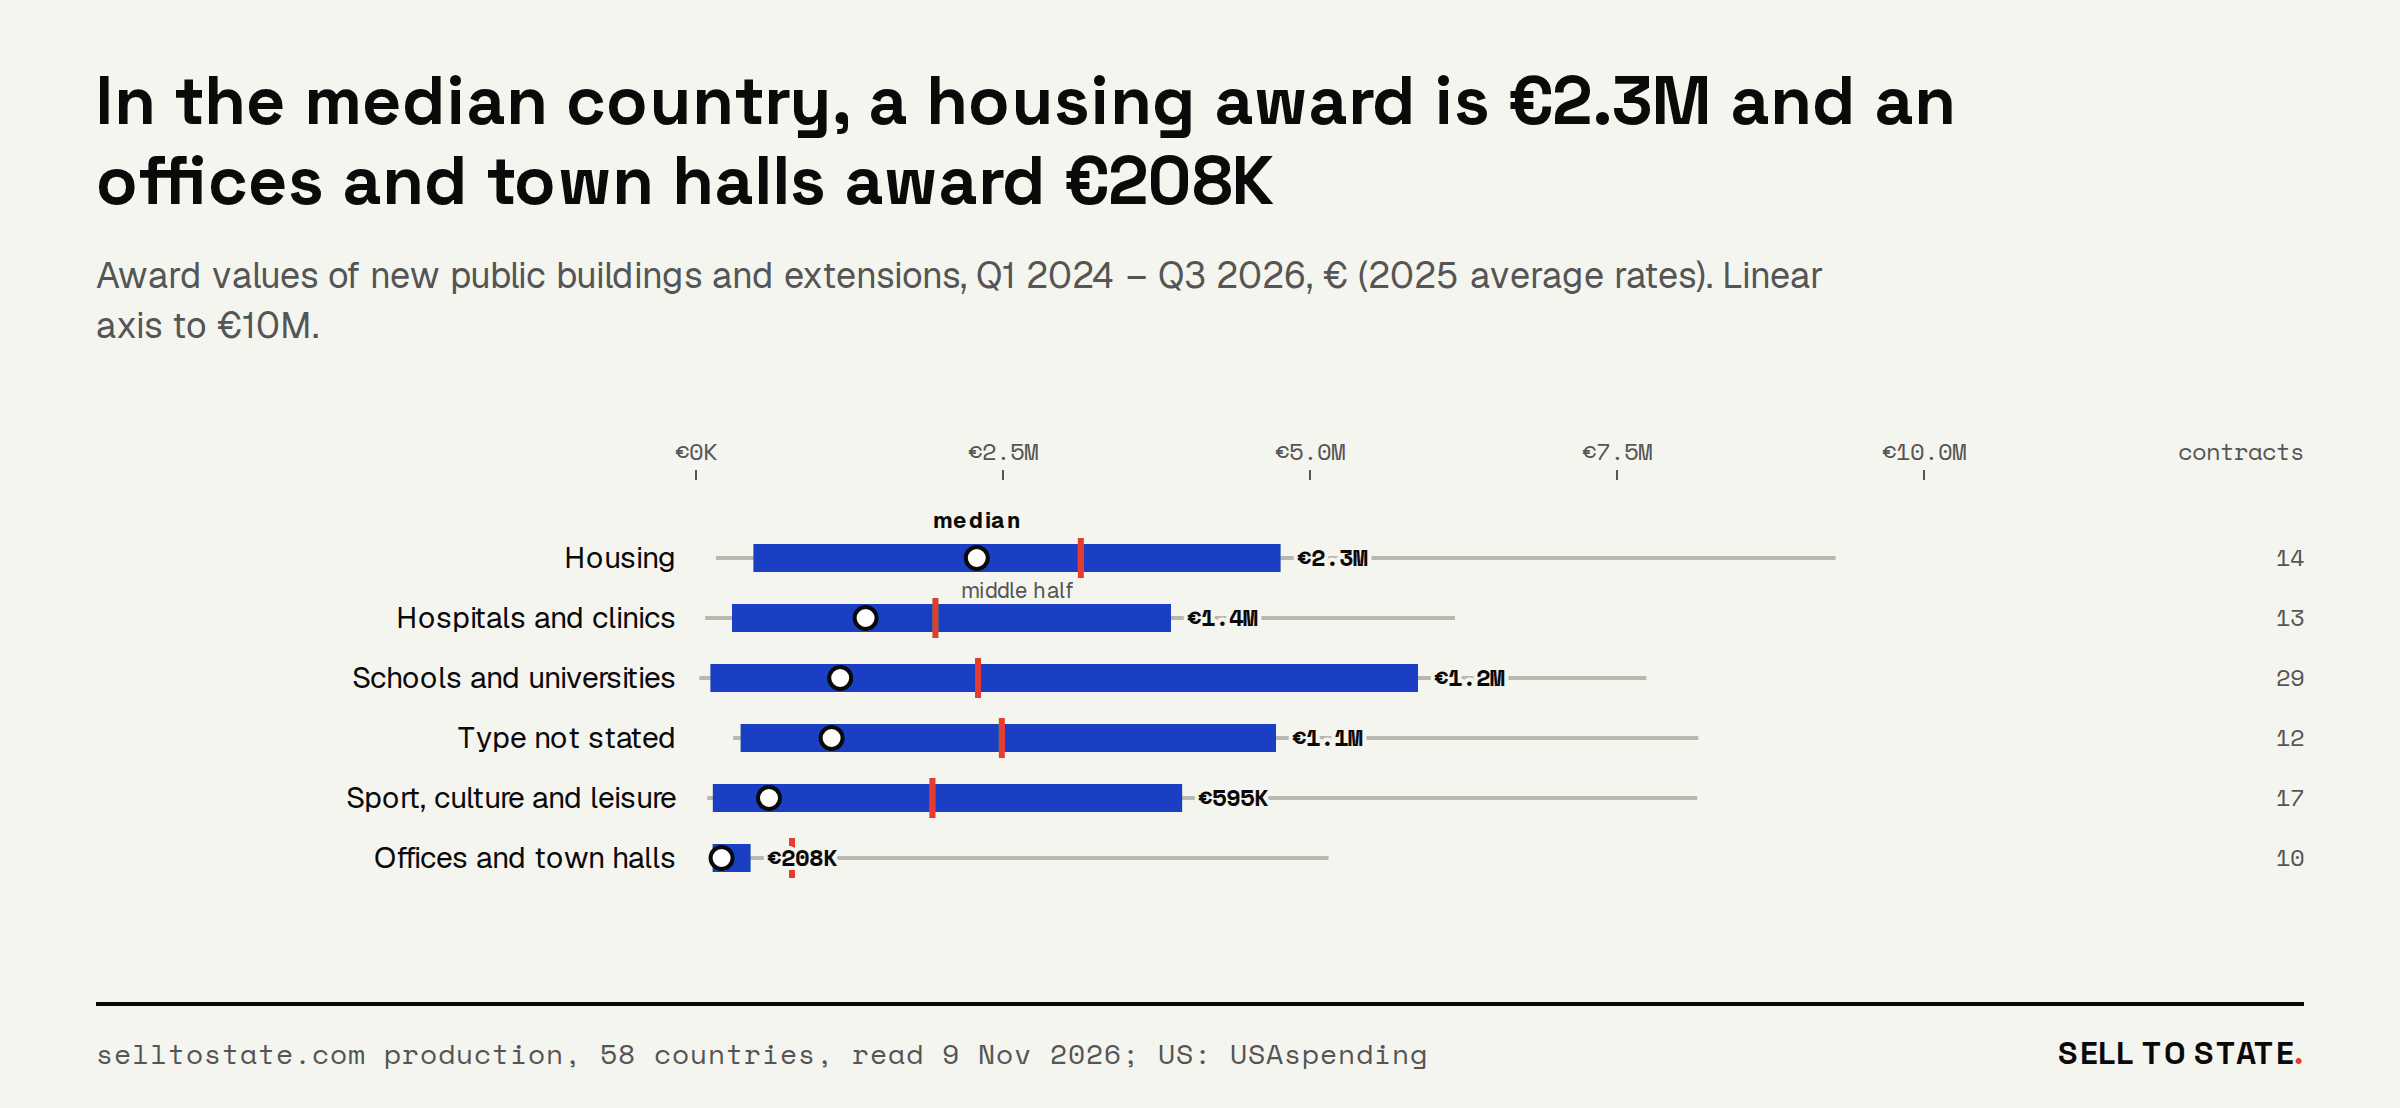
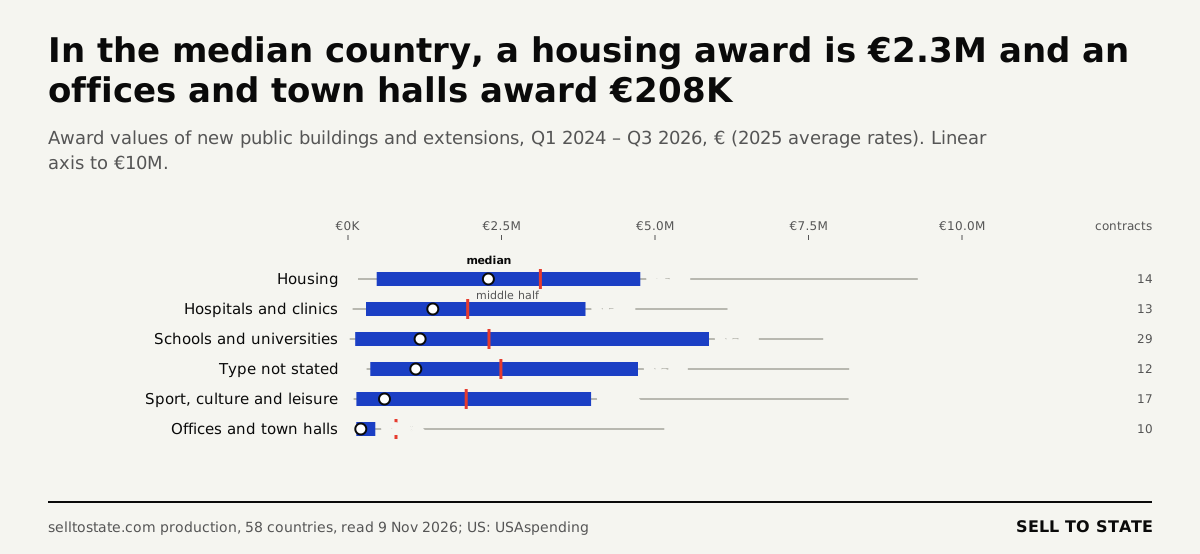
In the median country, a housing award is €2.3 million and an office award €207,690. Hospitals and clinics follow housing at €1.4 million, and schools are at €1.2 million. Sport, culture and leisure buildings are at €594,883. Each country counts once, with its own median for the type.
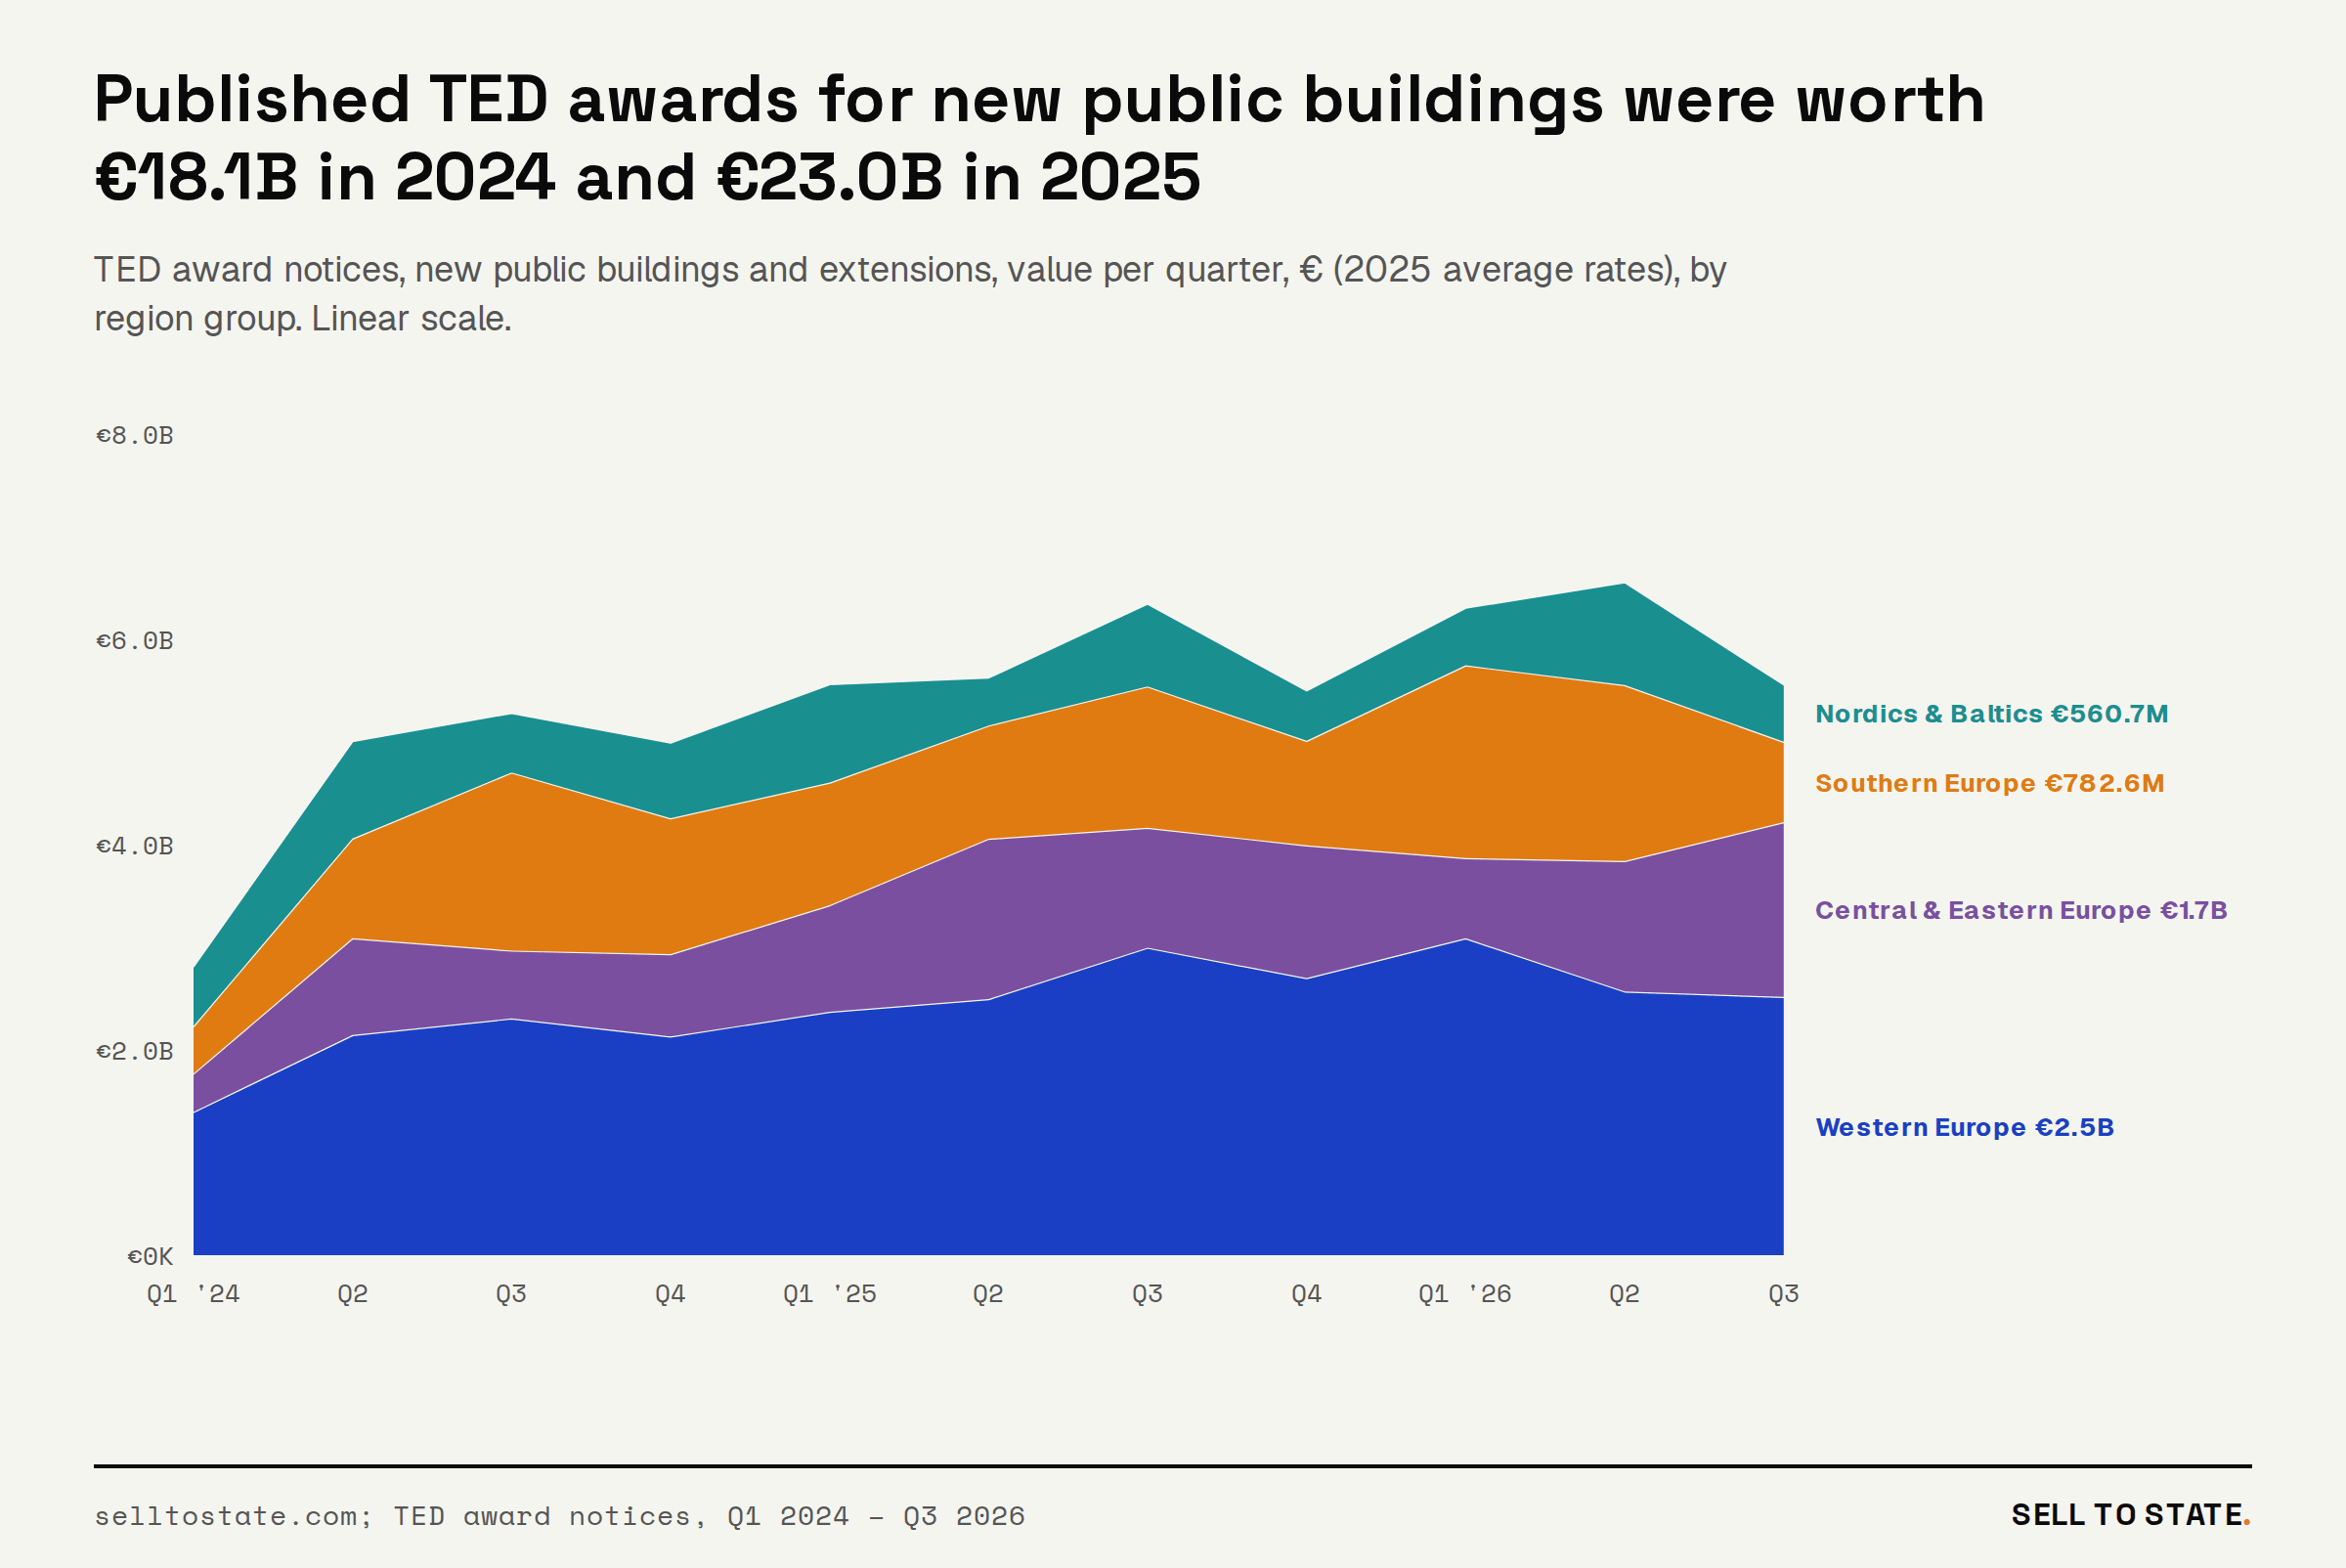
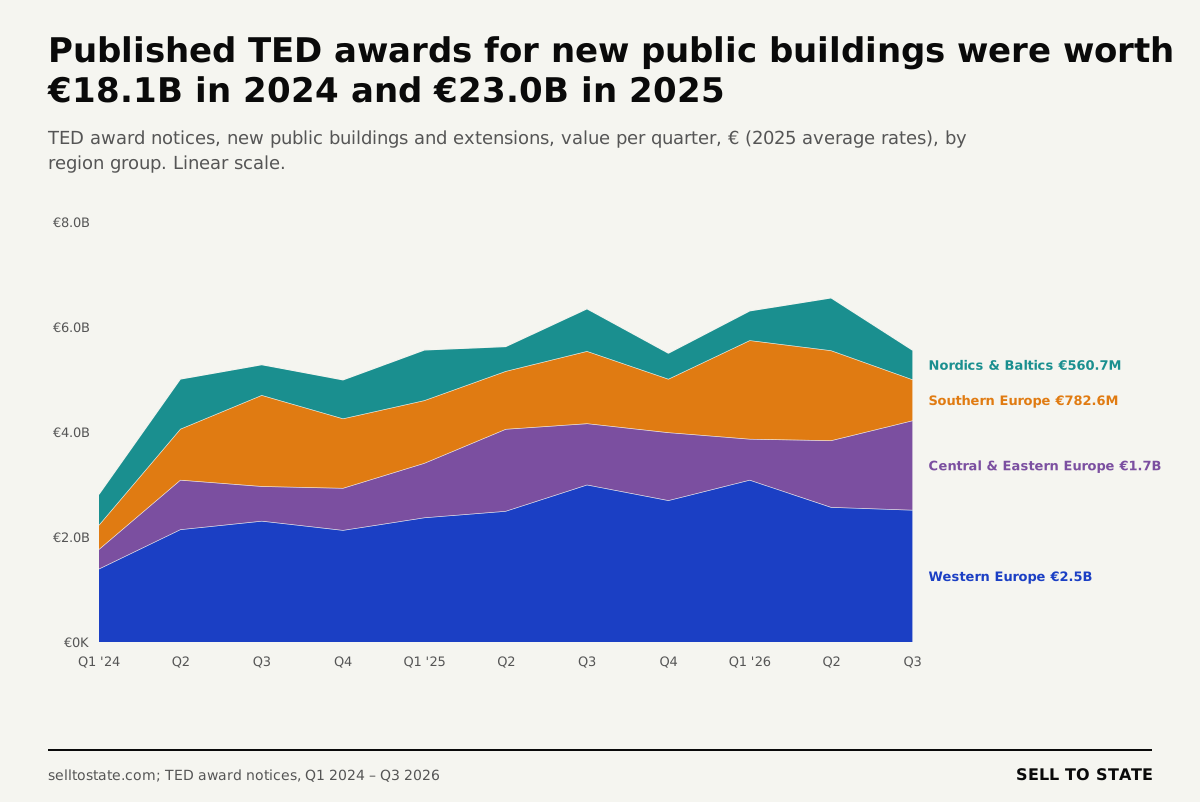
Published TED awards for new public buildings were worth €18.1 billion in 2024 and €23.0 billion in 2025. The first three quarters of 2026 hold €18.4 billion. 8,289 TED award notices state a value; many do not, so these totals are a floor. Outside TED, US federal awards for buildings were worth €11.2 billion, and the Department of Defense placed 47.1% of them.
Country notes: the 12 largest markets in the study
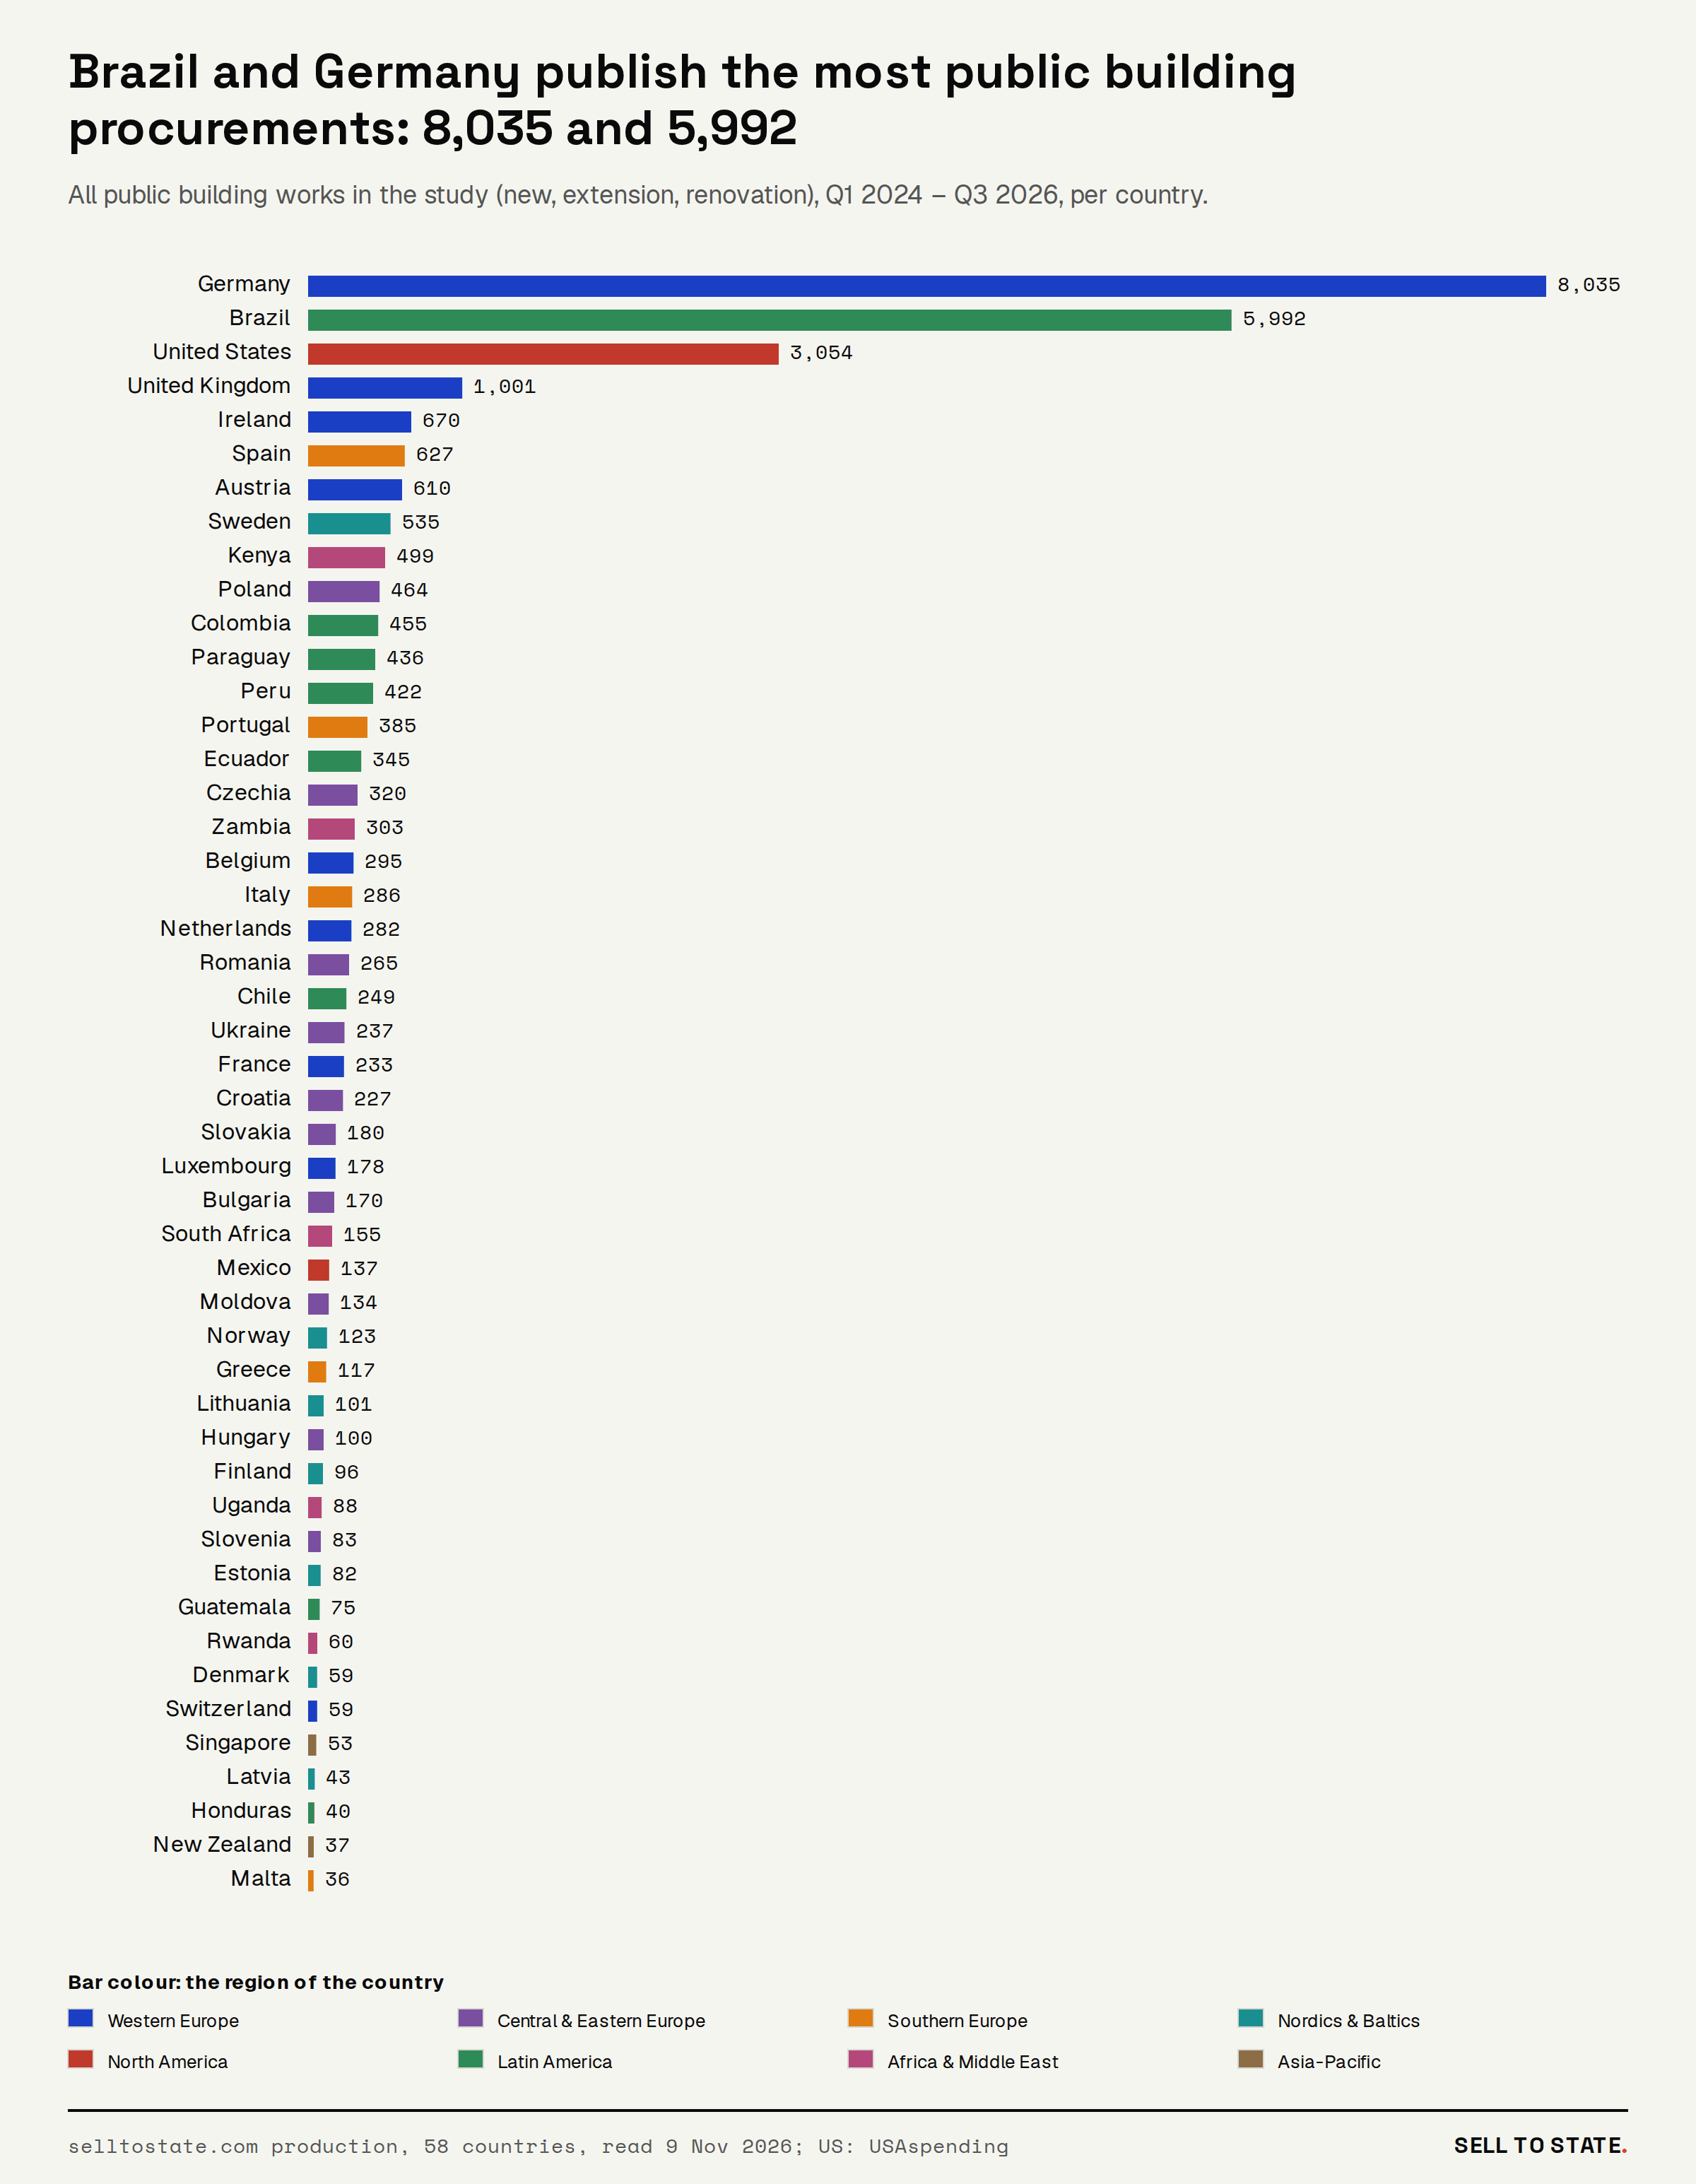
Germany. TED holds 8,035 German building procurements. Schools and universities are 38.7% of the new buildings and extensions, and hospitals and clinics 12.4%. Small and medium firms win 86.4% of the award notices that state the size. The median award is €305,943, because one award is often one trade lot. The top 10% of winners took 83.2% of the value.
Brazil. The national portal PNCP holds 5,992 building procurements. Schools are 51.8% and health buildings 22.2%. The median award is €313,780, from 5,564 awards with a value. 68.0% of the winners won once.
United States. USAspending holds 3,054 federal building awards in the study window. Offices and administrative buildings are 34.0%, and 43.1% name no building type. The median award is €367,113. States, counties and school districts publish their own building contracts outside this source.
United Kingdom. Find a Tender holds 1,001 building procurements. Schools are 31.2% and housing 22.5%. The median award is €1.4 million. The top 10% of winners took 83.6% of the value.
Ireland. TED holds 670 Irish building procurements. Schools are 30.4% and housing 23.9%. Small and medium firms win 95.3% of the award notices that state the size. The median award is €3.9 million.
Spain. The Spanish public sector platform holds 627 building procurements. Housing leads with 23.5%, then schools with 22.3%. Small and medium firms win 41.7% of the TED award notices that state the size. The median award is €9.1 million.
Austria. TED holds 610 Austrian building procurements. Schools are 21.7%, and 36.7% name no type. Strabag and Porr Bau are the top winners. The median award is €1.9 million.
Sweden. TED holds 535 Swedish building procurements. Schools are 23.9% and housing 18.4%. Small and medium firms win 48.7%. The median award is €10.2 million, one of the highest in the study.
Kenya. The PPIP portal holds 499 building procurements. Schools are 67.1% and health buildings 25.3%; most buyers are county governments. The median award is €17,105. 87.0% of the winners won once.
Poland. The Polish public procurement portal holds 464 building procurements. Hospitals and clinics lead with 24.2%. The median award is €6.8 million. Budimex is the top winner.
Colombia. SECOP II holds 455 building contracts. Offices and town halls lead with 37.9%. Small and medium firms win 39.8% of the contracts for new buildings. The median award is €186,221. 92.9% of the winners won once.
Paraguay. DNCP holds 436 building procurements. Schools are 80.2%, many of them school kitchens and classrooms. 40.7% of the tenders drew one bid. The median award is €37,200.
For sellers
- Sell in your home market first. 29 of the 30 top winners won only at home, and foreign firms win 1.4% of European contracts. A foreign builder usually needs a local company or a local partner.
- Bid for lots. Most European public building contracts are small trade lots, and small and medium firms win 89.7% of contracts under €1 million. A specialist trade (roofing, joinery, lifts, building services) can bid on many buildings in one region.
- Large projects need partners. Contracts of €20 million and more hold 49.8% of the money, and large firms or groups win most of them. A small firm enters these projects as a member of a group or as a subcontractor of the winner.
- Look for tenders with few bids. One European lot in 8 draws a single bid, and in Guatemala, Ghana and Paraguay 4 tenders in 10 or more do.
- Schools are the steady market. Schools are 35.8% of public building procurements in the average country, and the largest type in 7 of 8 regions. In Ukraine, school shelters are most of the market.
- Read the award notices of your trade. An award notice names the winner and the price. A firm can see who wins its trade in each country, and at what price.
Download all 24 charts and the data
Free to reuse with a link to this article. The files hold aggregates only: counts, shares and percentiles. They hold no single procurement records.
- Country table (CSV): one row per country: records by kind of work, projects, the building-type mix, the SME share, the median bids per lot and the median award value.
- V1: Six hand checks cut false matches from 27% to 9% in the hardest group. PNG · SVG
- V2: Brazil and Germany publish the most public building procurements: 8,035 and 5,992. PNG · SVG
- V3: The study reads 28,545 public building procurements in 58 countries. PNG · SVG
- V4: In the average country, 36 of every 100 public building procurements are schools and universities. PNG · SVG
- V5: Schools lead in 7 of 8 regions: 63% in Asia-Pacific, 21% in North America. PNG · SVG
- V6: Western Europe published 9,966 public building procurements and Latin America 7,592. PNG · SVG
- V7: Schools are the most common public building in 17 of the 30 countries with 100 or more procurements. PNG · SVG
- V8: 25 of 31 countries tender more schools than health buildings; the median country, 2.7 for every one. PNG · SVG
- V9: Renovation is 22% of building works in Central and Eastern Europe and 4% in Africa. PNG · SVG
- V10: More than half of Ukraine's new public buildings are shelters: 342 of 555, and 85% of them are at schools. PNG · SVG
- V11: 29 of the 30 top firms won only in their home country; Strabag is the one that crossed a border. PNG · SVG
- V12: In the median country, the top 10% of winners took 29% of the contracts and 62% of the money. PNG · SVG
- V13: Small and medium firms won 73 of every 100 European public building contracts. PNG · SVG
- V14: Contracts under €1M are 47% of the awards but 2% of the money; small firms win 90% of them. PNG · SVG
- V15: Small firms win most public building contracts in 13 of 17 European countries; in Colombia they win 40%. PNG · SVG
- V16: Where the median contract is bigger, small firms win less: in Sweden the median is €10.1M and they win 49%. PNG · SVG
- V17: The median European lot drew 4 bids; 13% of lots drew only one. PNG · SVG
- V18: Guatemala has the most single-bid contracts, 74%; in Europe one lot in 8 drew a single bid. PNG · SVG
- V19: Competition did not change: the median European lot drew 4 bids in Q1 2024 and 4 in Q3 2026. PNG · SVG
- V20: Foreign firms won 1.4% of public building contracts in Europe: one in 72. PNG · SVG
- V21: European calls for new public buildings rose 8.6% in 2025, then fell 6.5% in the first nine months of 2026. PNG · SVG
- V22: The median building award is €16.5M in South Africa and €7K in Guatemala. PNG · SVG
- V23: In the median country, a housing award is €2.3M and an offices and town halls award €208K. PNG · SVG
- V24: Published TED awards for new public buildings were worth €18.1B in 2024 and €23.0B in 2025. PNG · SVG