Rerun this study with live data, with an agent prompt and the data downloads
An agent can rerun the core count of this study. The prompt below tells it how to get access to the selltostate.com API, which terms to search, and how to turn the matches into a rate per 10,000 procurements. The quarterly download gives the original snapshot’s denominators. A new rate needs a fresh numerator and denominator from the same source.
Copy this into your AI agent
Rerun the selltostate.com study "How governments buy cybersecurity" with current data.
The article is at https://www.selltostate.com/blog/how-governments-buy-cybersecurity/.

1. Get access to the selltostate.com API.
   - If I give you an API key, use it in the header x-api-key: <key> and go to step 3.
   - If not, sign up as an agent: POST https://app.selltostate.com/api/oidc/register
     with the JSON body {"client_name": "<your name> for <my name>"}.
     Keep client_id and payment_link from the answer.
2. Pay for access. The price is at GET https://app.selltostate.com/api/v1/price.
   - Show me the price and the payment_link. Wait for my yes.
   - I pay on the payment_link. Then use the header Authorization: Bearer client:<client_id>.
3. Check access: GET https://app.selltostate.com/api/v1/whoami must show "active": true.
   Keep the key and the client_id private.
4. For these countries: [your countries, or all], search the awards and tenders whose title names
   cybersecurity. Use the terms of the article in each language: cyber, cybersecurity, information security,
   firewall, antivirus, endpoint protection, SIEM, SOC, penetration test, vulnerability, and the vendor
   names Fortinet, Sophos, ESET, Palo Alto Networks, Check Point, Kaspersky, Trellix, Tenable.
   Count a record when a term is in the title, or when the description names a security product, a vendor
   or a cybersecurity service. Drop the false matches that the article lists
   (antiviral drugs, building fire walls, intrusion alarms, forest firebreaks, soil penetration tests,
   and clauses such as "the supplier must guarantee information security").
5. Count the matches and all procurements by country, source and quarter from the same snapshot.
   Keep one consistent source per country, with the same deduplication rule for both counts.
   Divide the matches by all procurements and multiply by 10,000. The article's quarterly download
   reproduces its original snapshot; do not divide fresh matches by those old denominators.
   If access cannot provide a matching denominator, report counts only and name that limitation.
   Use complete quarters only: a quarter with fewer than 50 procurements or fewer than 60% of the
   country's median quarter is incomplete (the US Department of Defense publishes 90 days late).
6. Report: cyber procurements per 10,000 by country and year, what is bought (licences, appliances,
   managed services, testing, training, staff), the vendors named, the median contract in US dollars,
   and the cyber tenders that are open now, with links.
7. Compare your results with the article. Explain the differences: newer data, other sources,
   and the terms that you did not use.
The limits of the data: the search reads words, and the sources count differently
Sources differ. A TED notice, a Colombian contract and a US contract action are different units. A rate compares a country with itself first, and then with countries that have the same kind of source.
Two layers. We count a procurement when its title names cybersecurity, a security product or a vendor (cyber is the purchase), or when its description names a concrete security item or a cyber service (cyber is one part of a wider contract). 64% of the count is in the title layer.
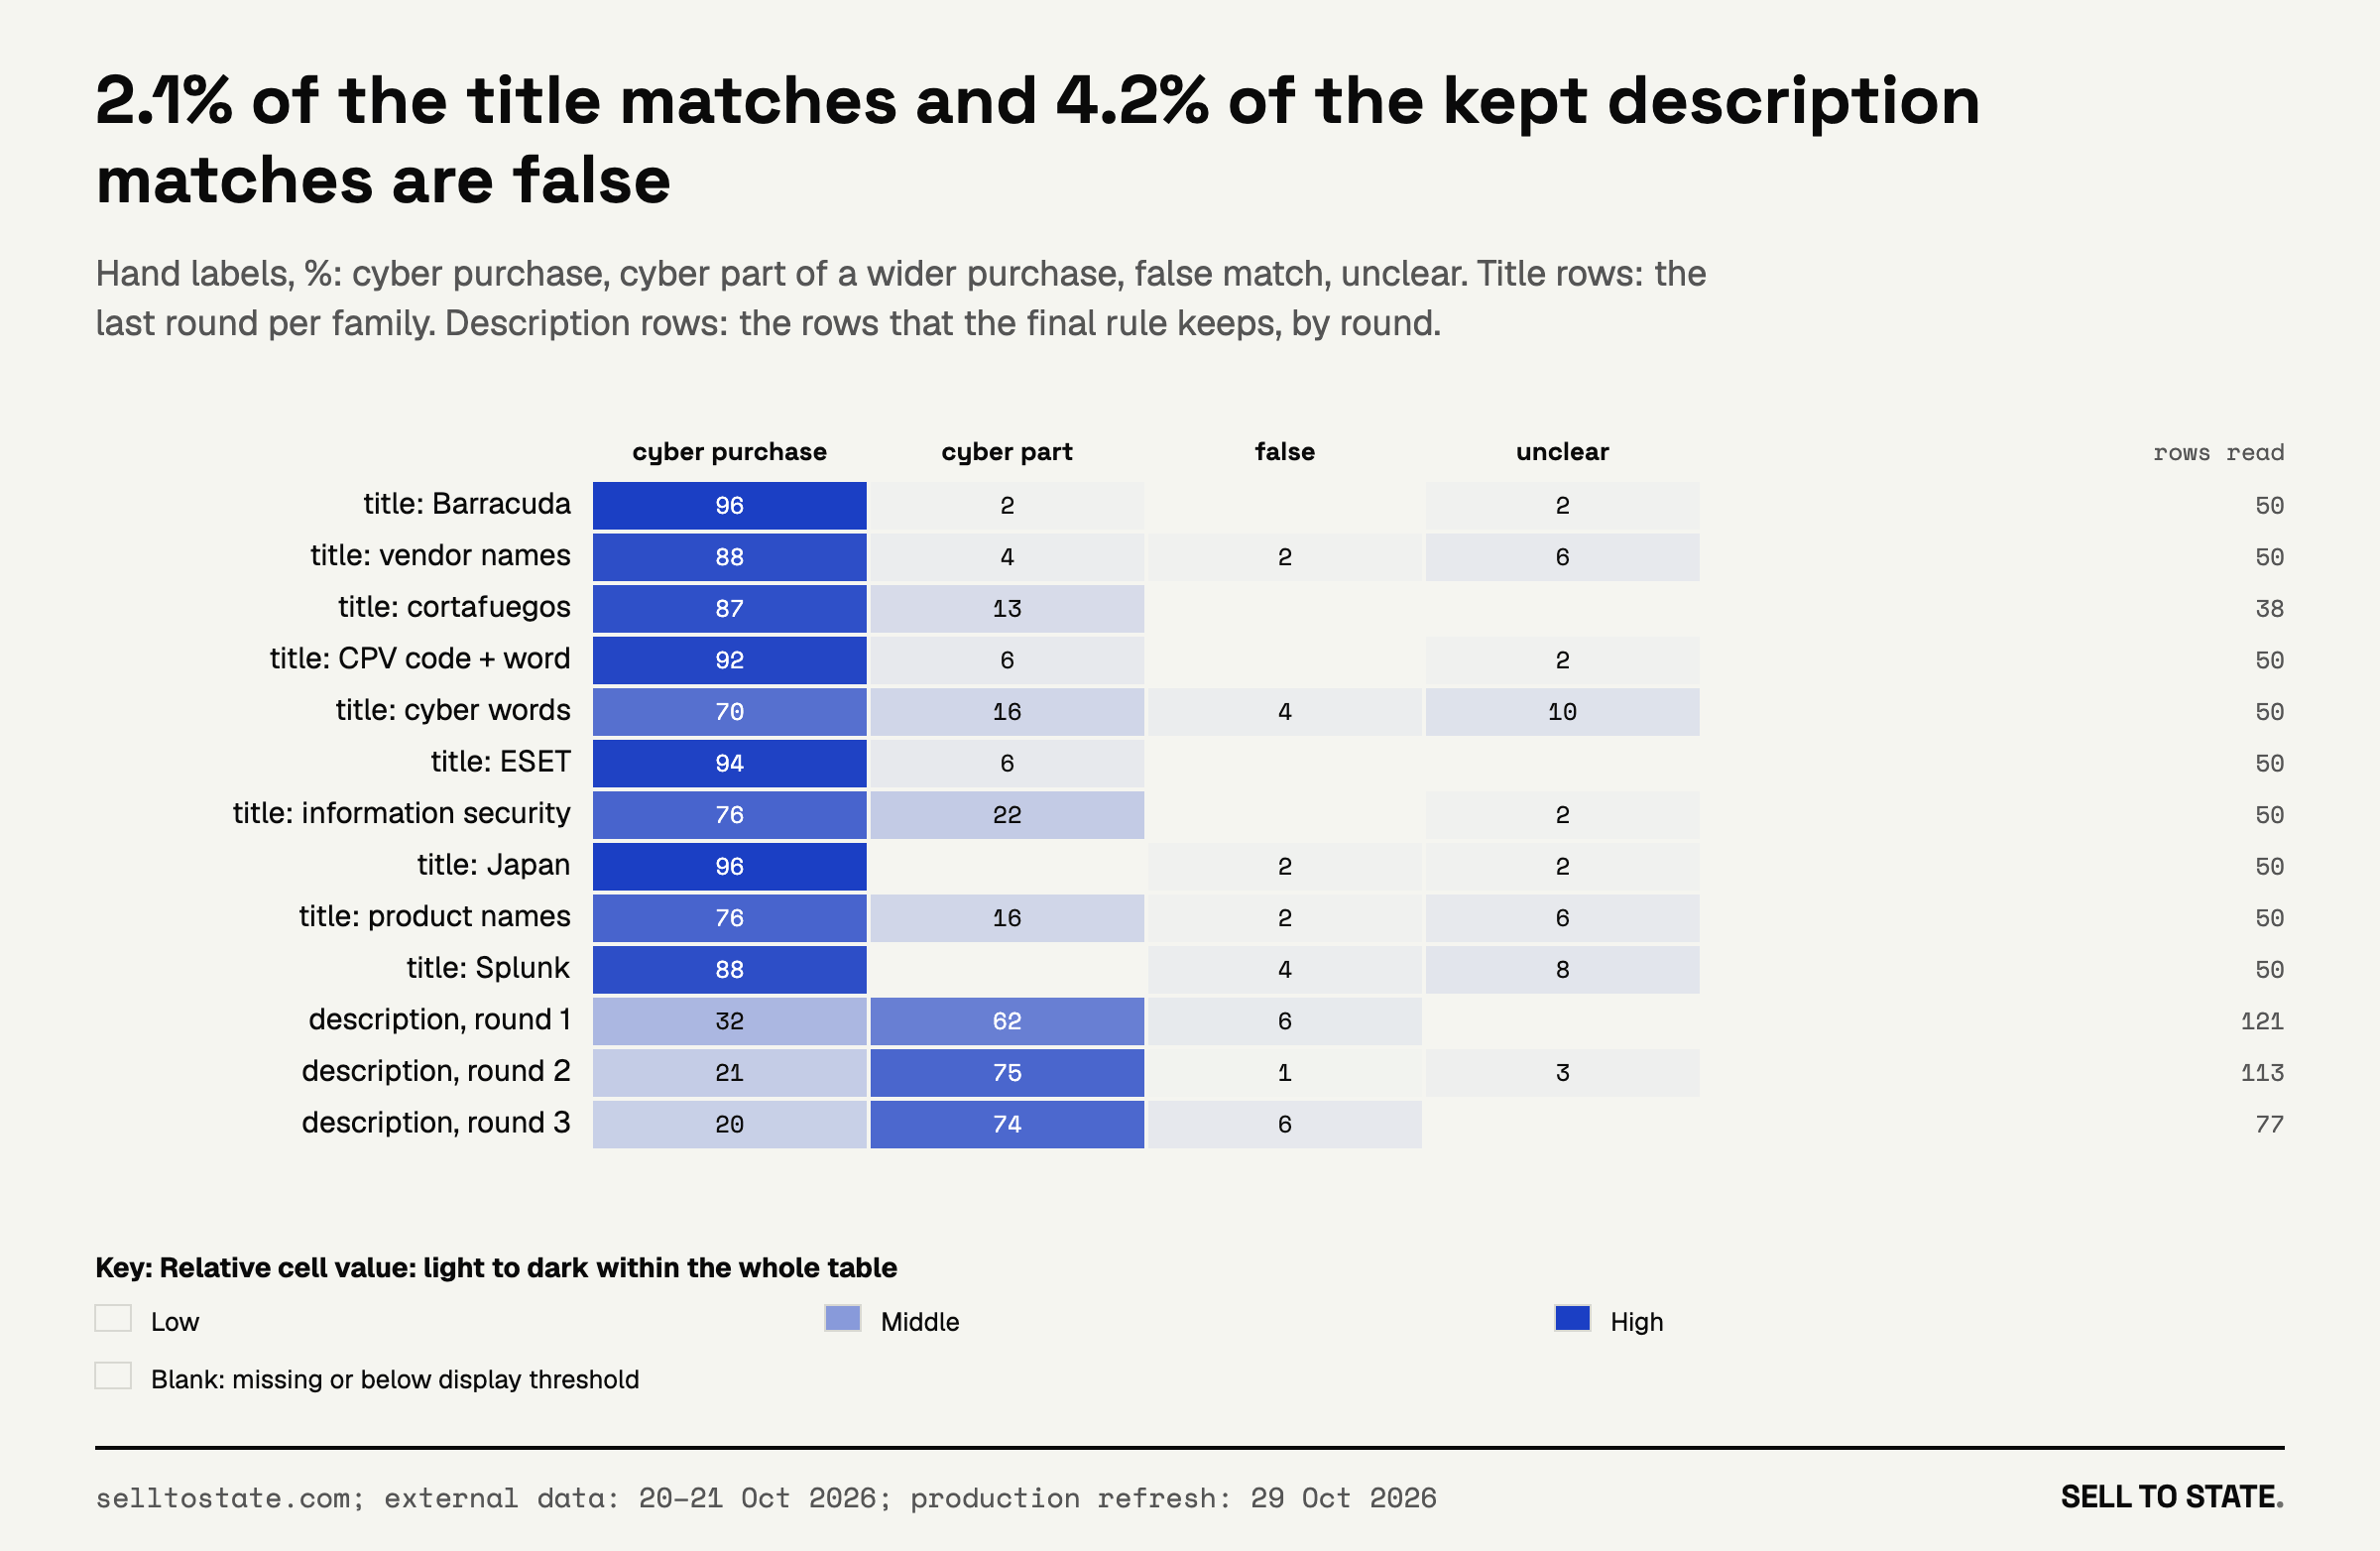
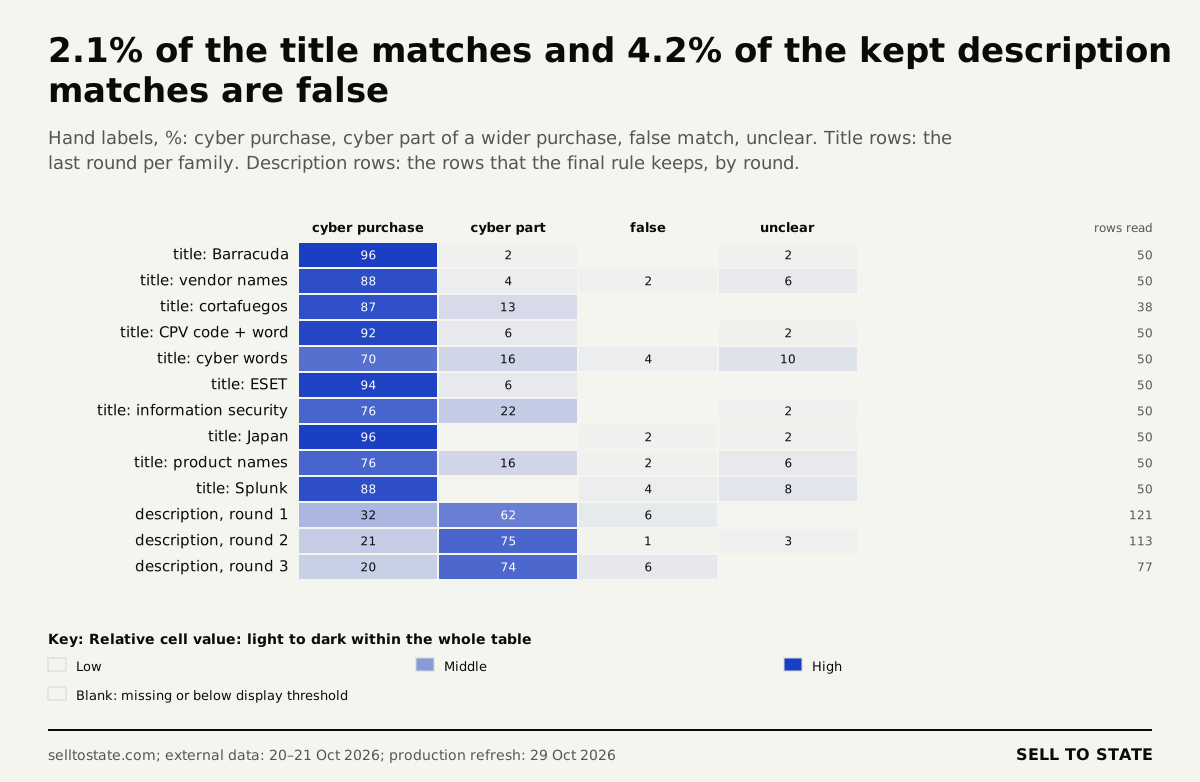
The hand check. We read 1,462 rows by hand. 2.1% of the title matches and 4.2% of the description matches that we keep are false.
Complete quarters only. A quarter counts when the source holds 60% or more of the country’s usual quarter. The US Department of Defense publishes its contracts 90 days late, so the last US quarter is out.
Values. US dollars at 2025 average rates. We have usable award values for 17,393 of 27,397 title-layer purchases. Each spending total is a lower bound.
Download all 39 charts and the data
Free to reuse with a link to this article. The files hold aggregates only: counts, shares and percentiles. They hold no single procurement records.
Country table (CSV): one row per country: procurements, cyber procurements and cyber per 10,000 by year and for the last four quarters, the AI rate of our AI study, and the hospital share.
Country by quarter (CSV): procurements, cyber procurements (title rule) and description-only mentions for each country and quarter, Q1 2024 to Q3 2026.
V1: 2.1% of the title matches and 4.2% of the kept description matches are false. PNG · SVG
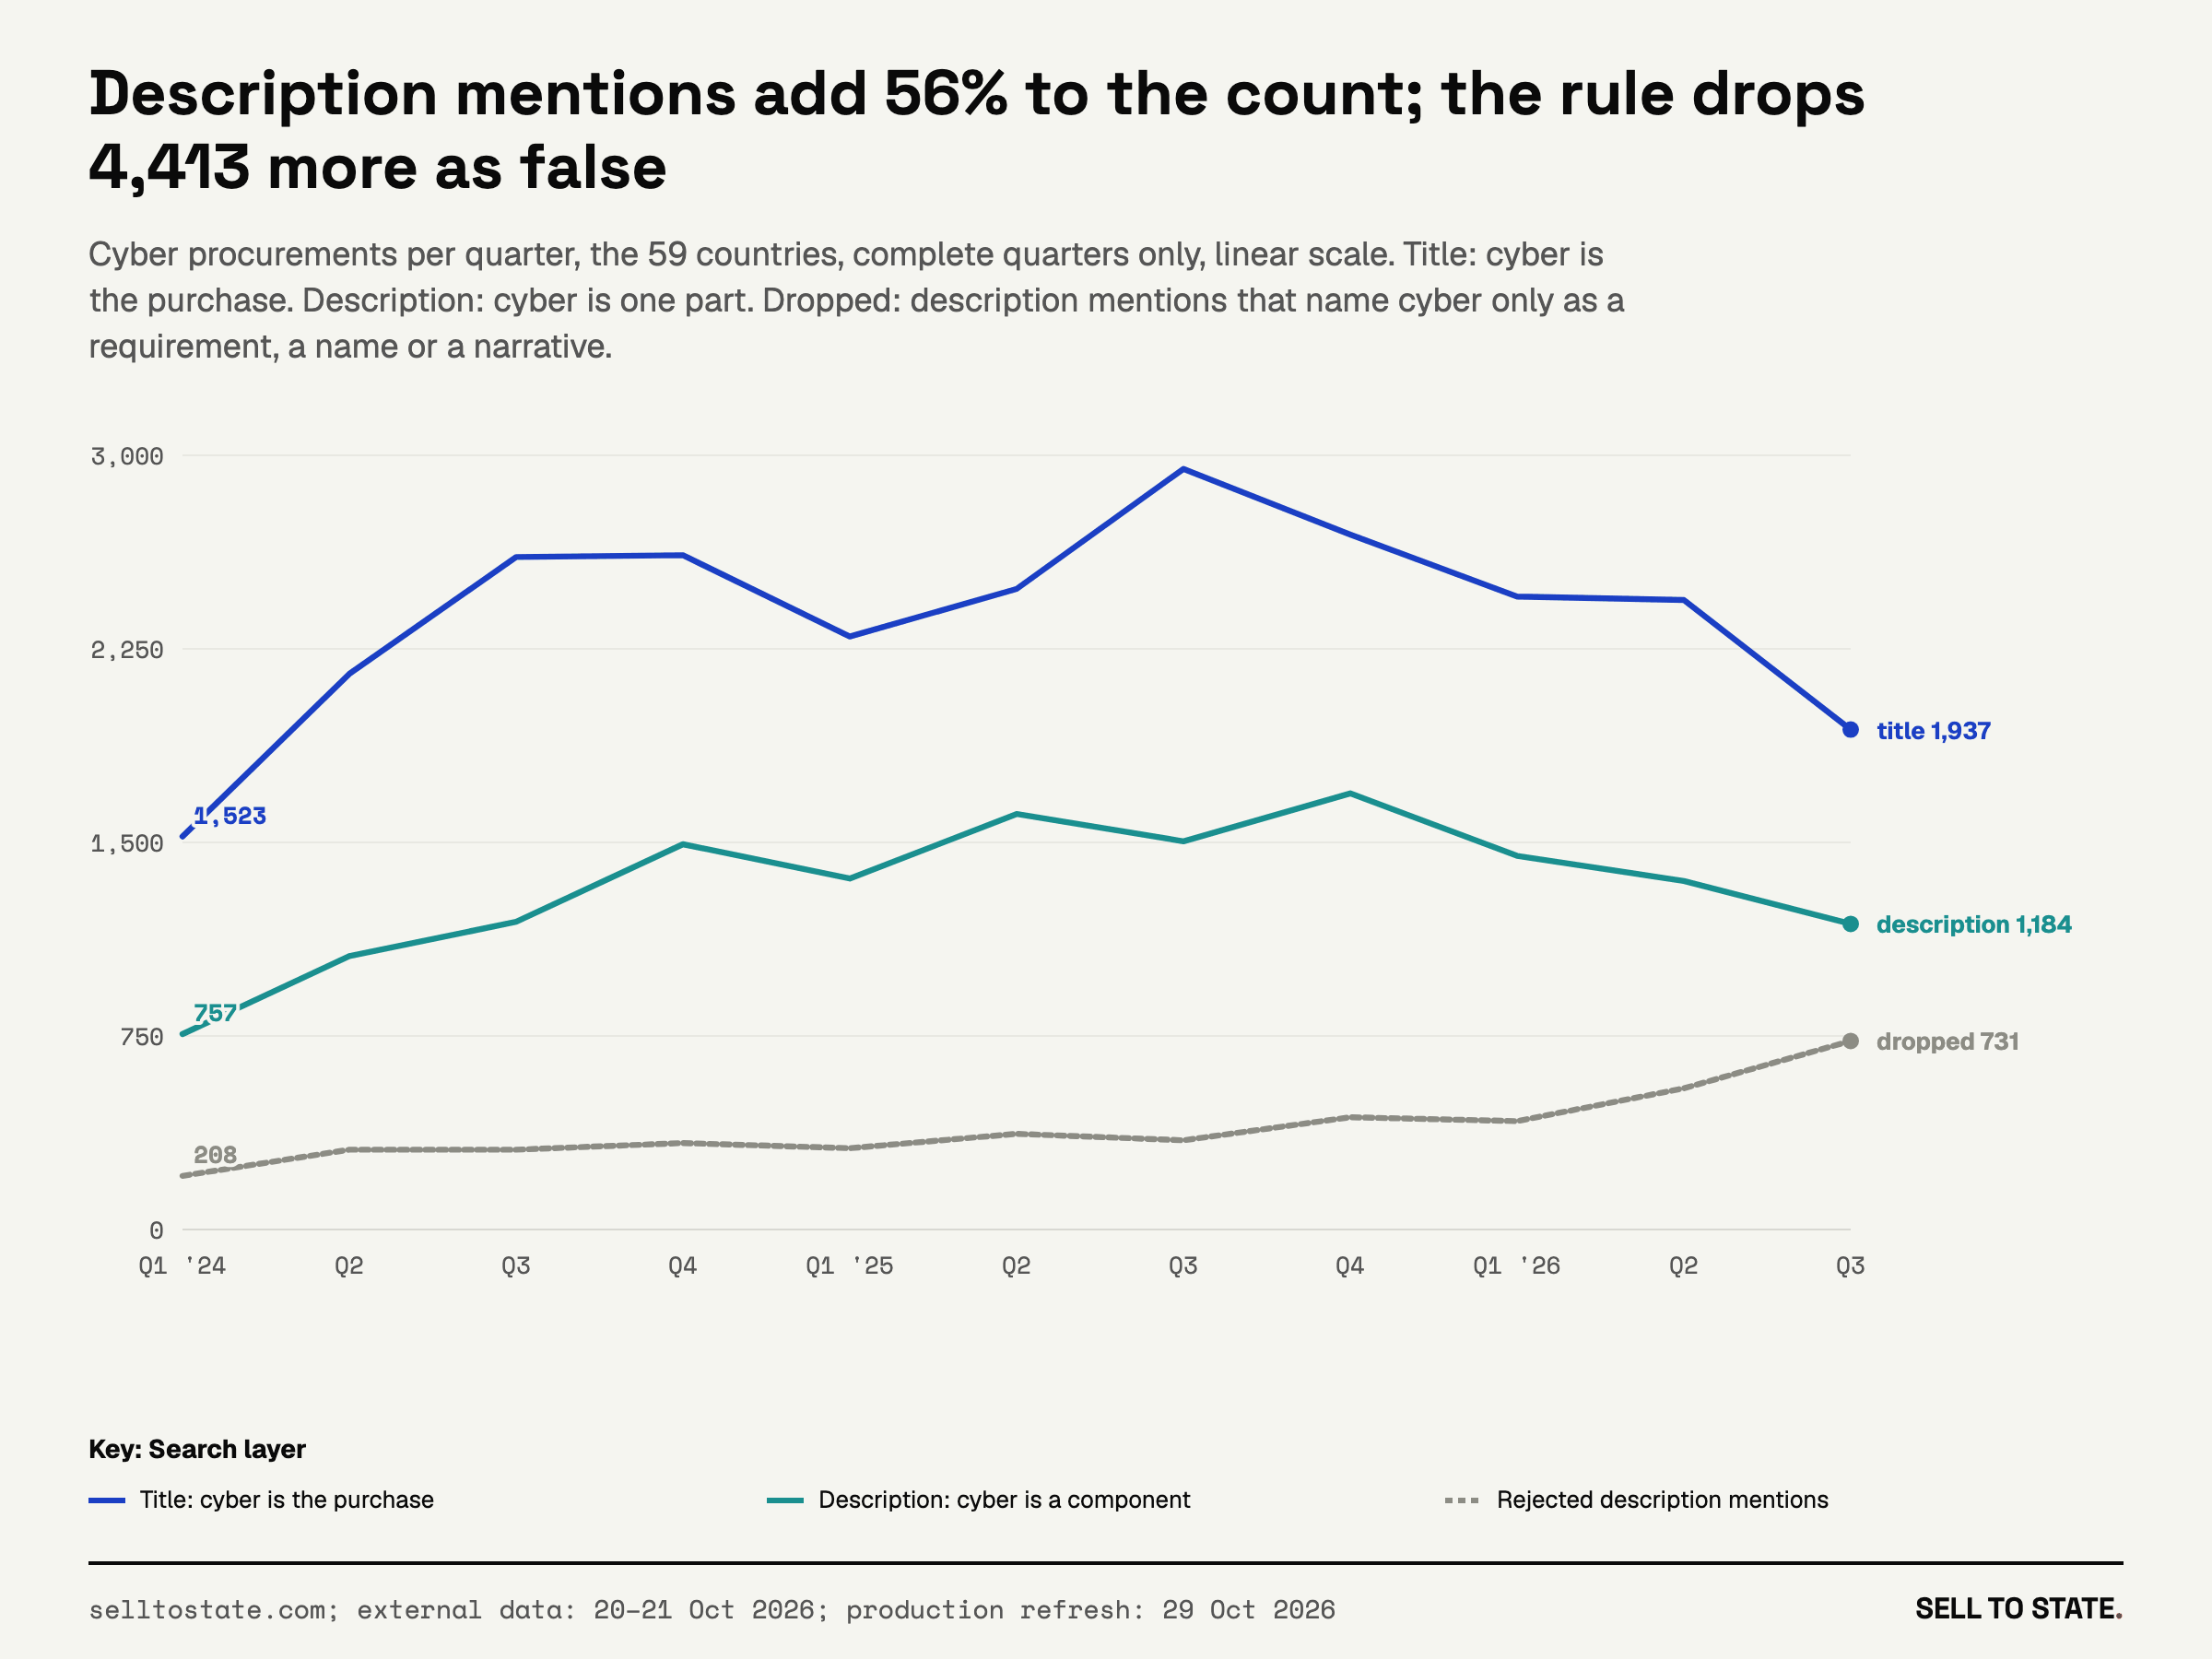
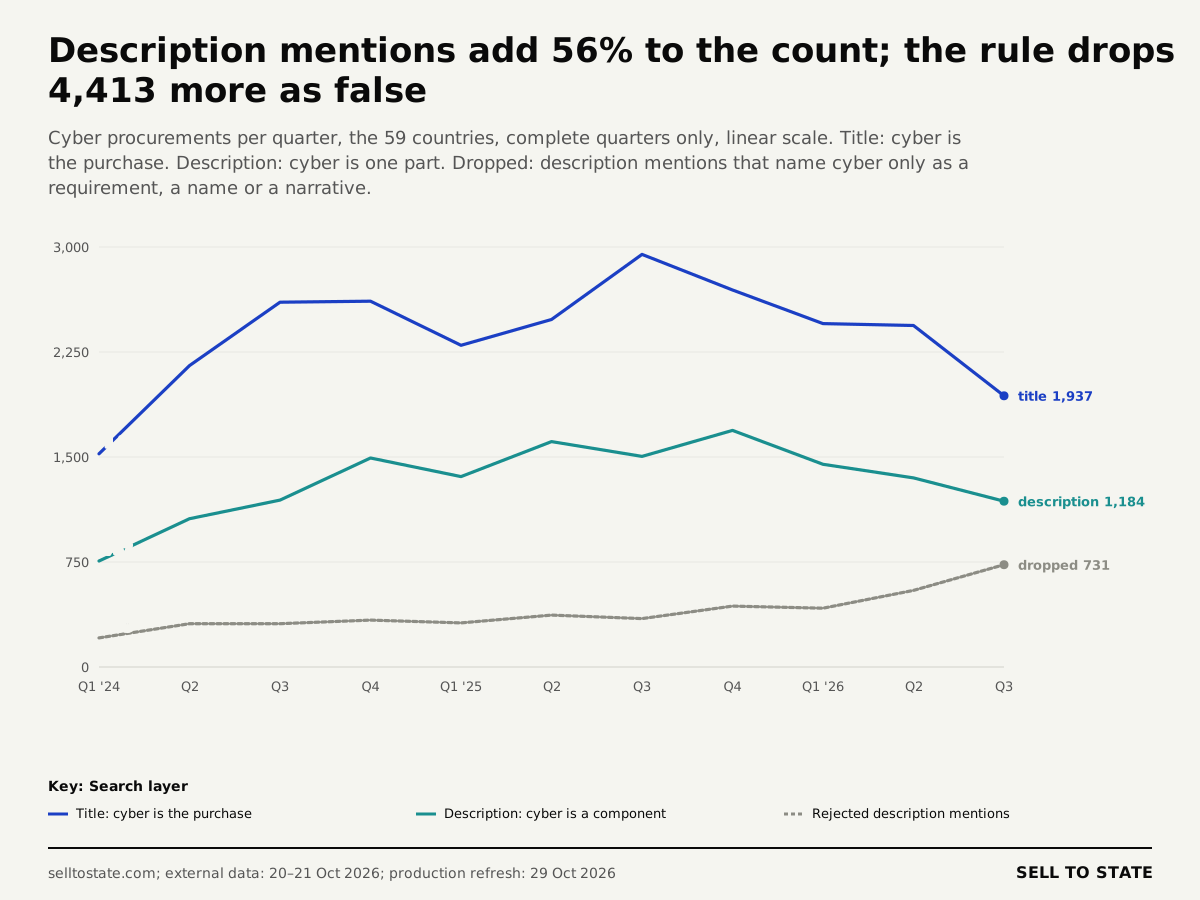
V2: Description mentions add 56% to the count; the rule drops 4,413 more as false. PNG · SVG
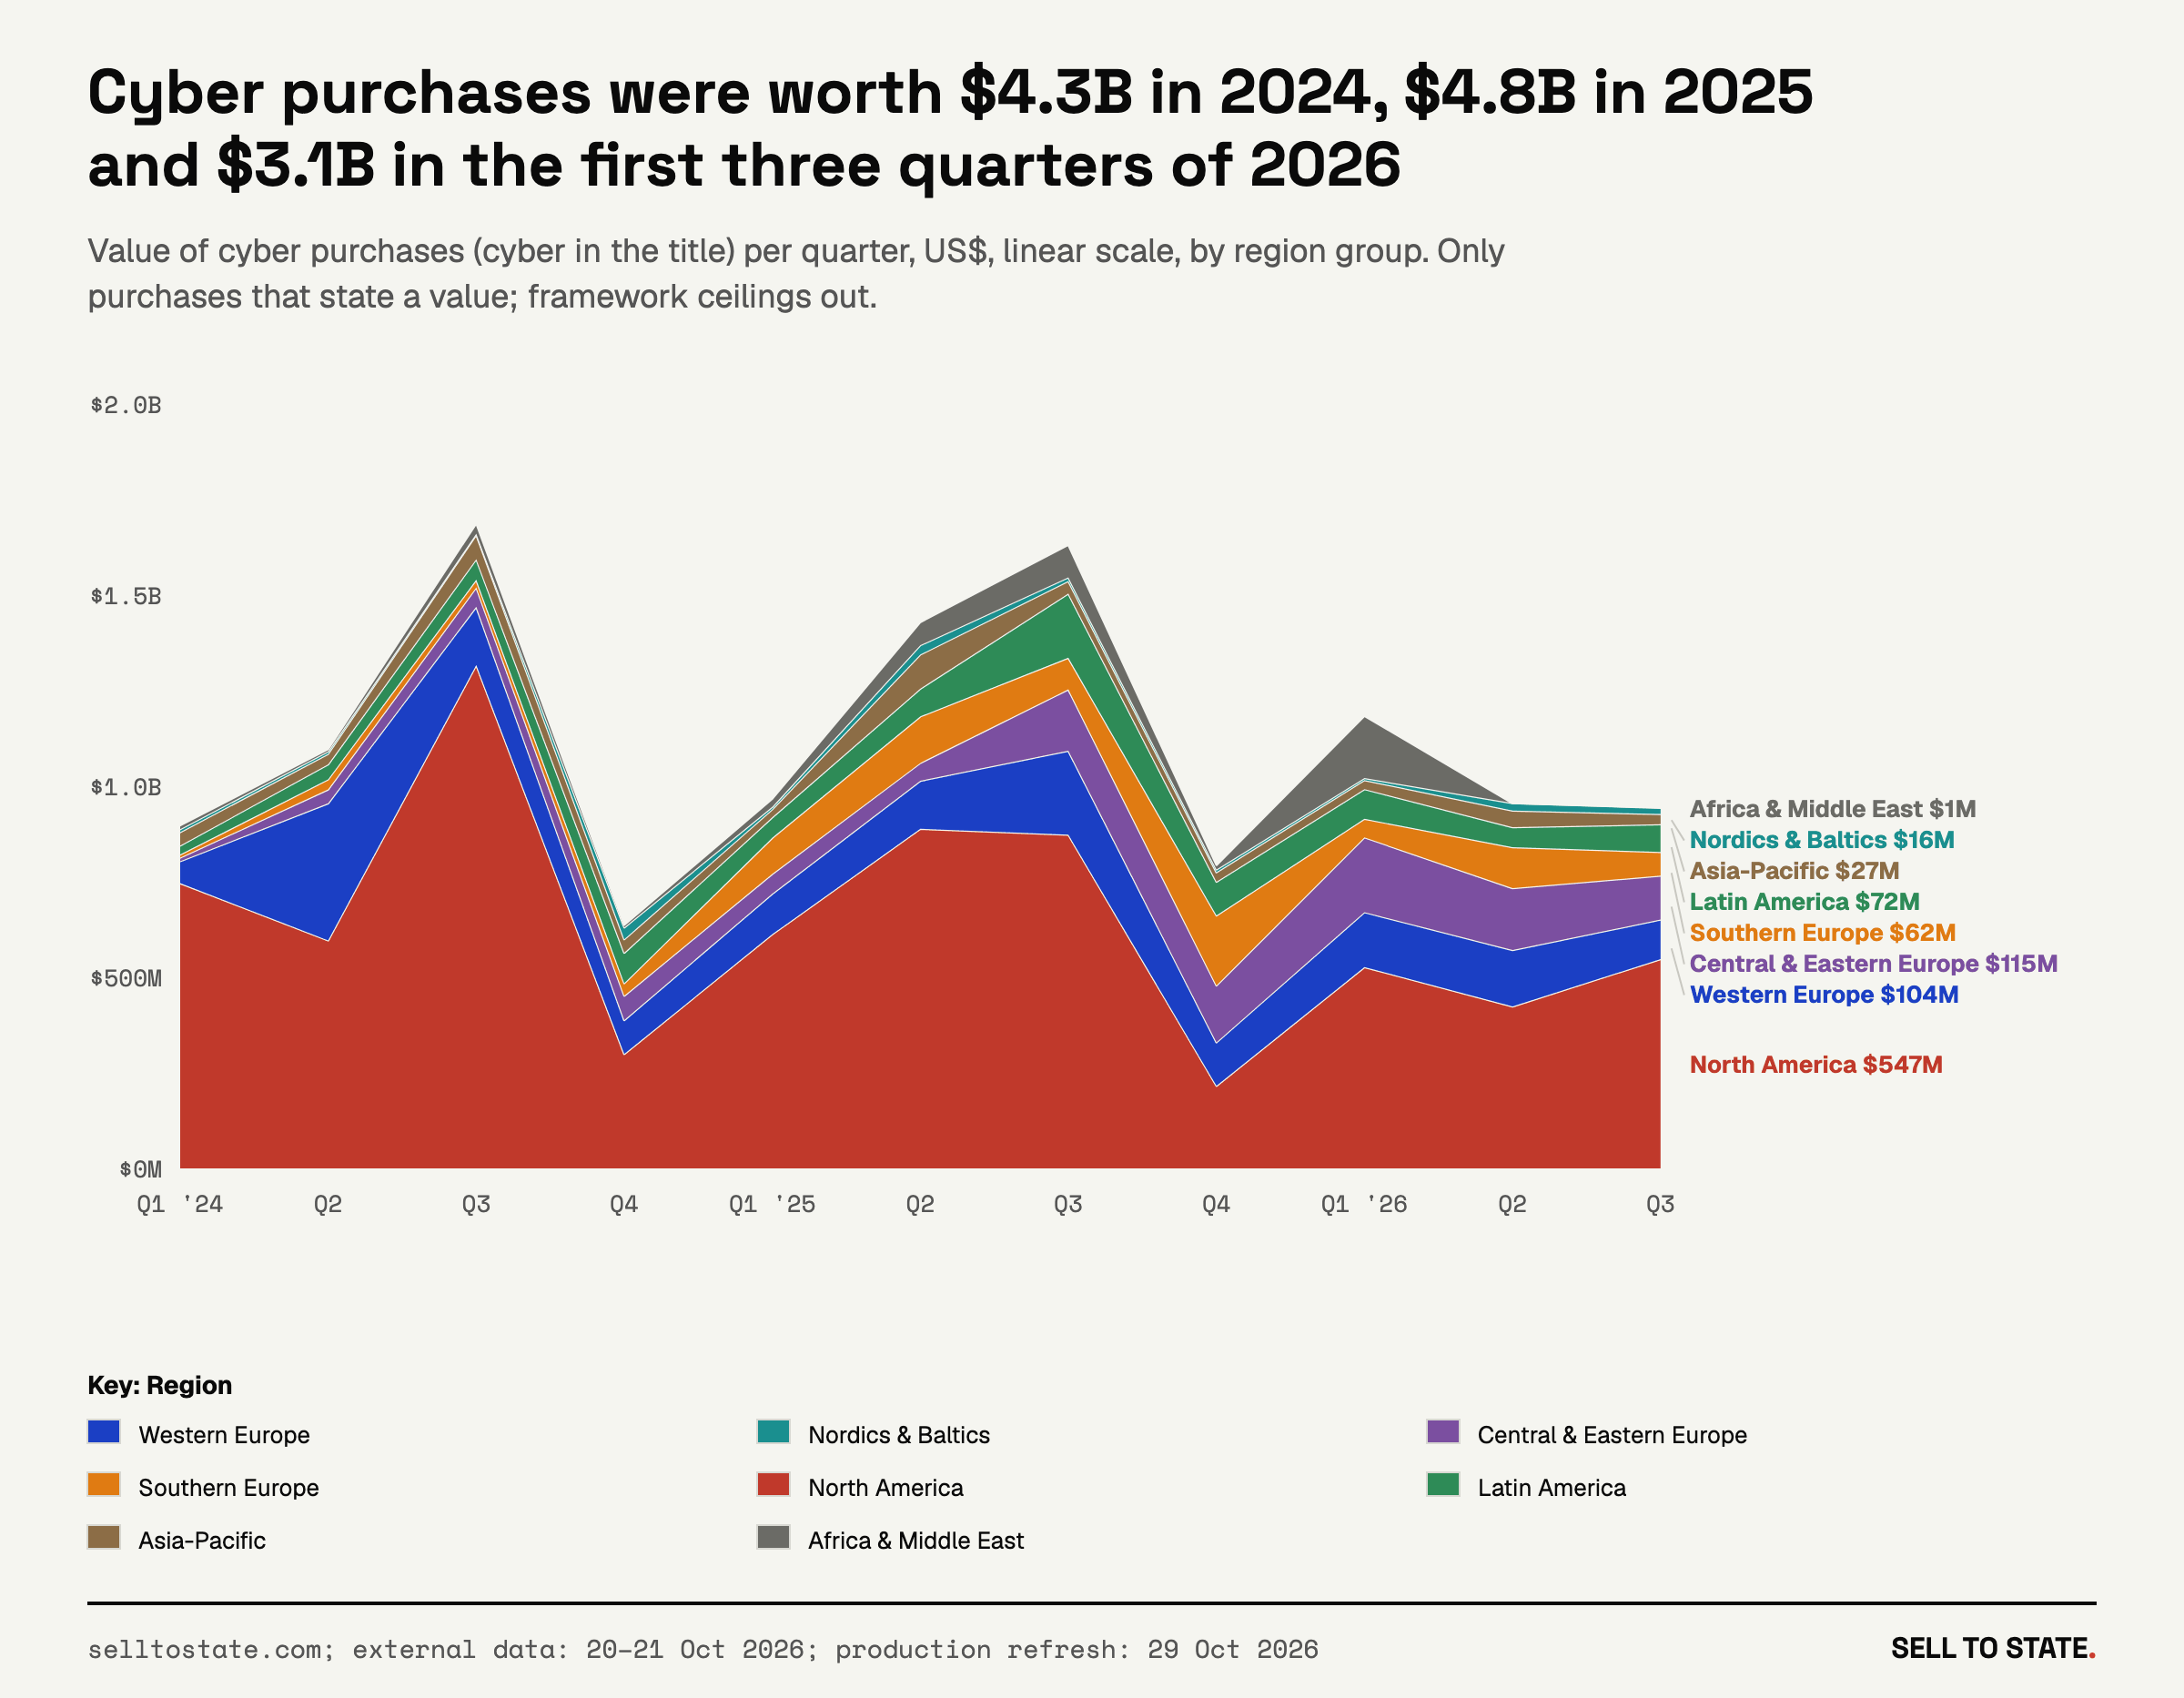
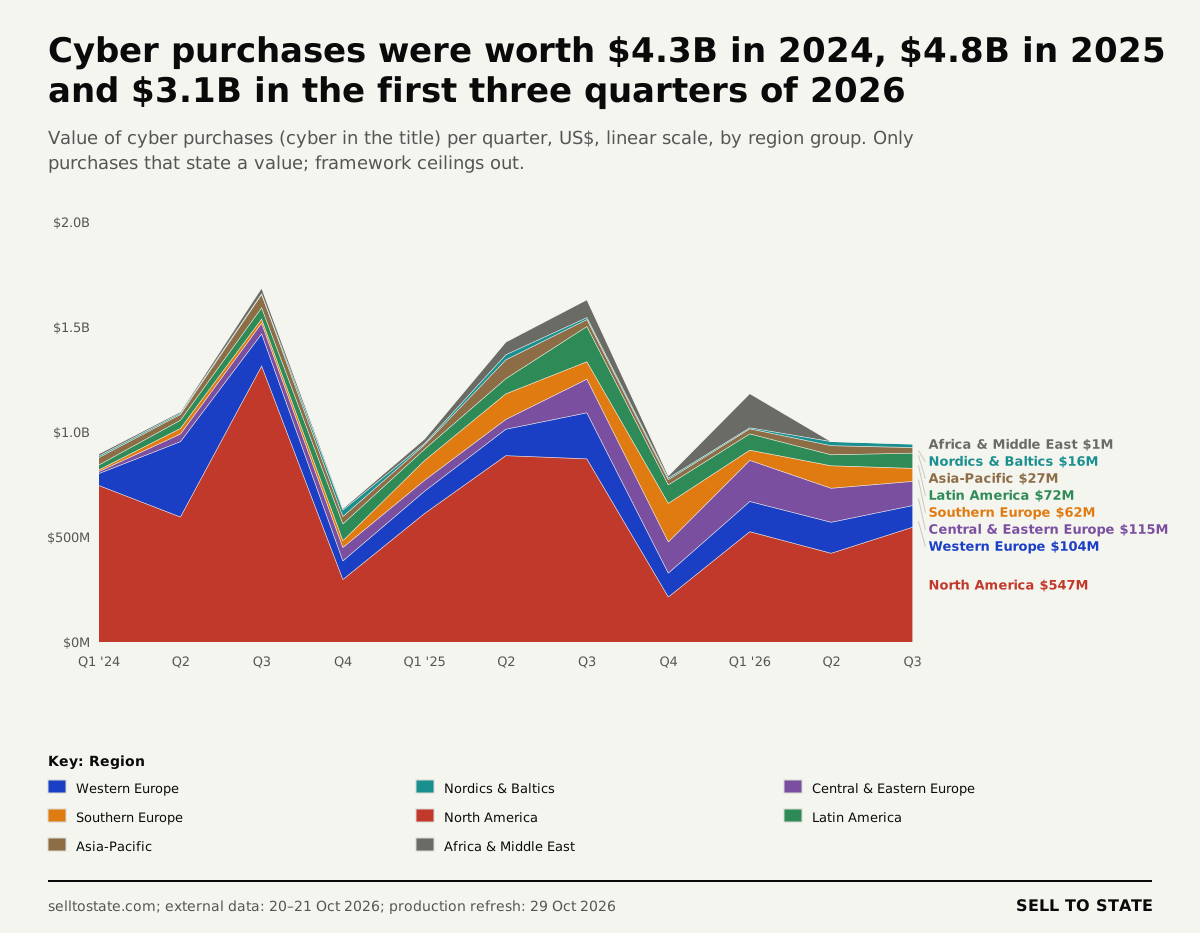
V3: Cyber purchases were worth $4.3B in 2024, $4.8B in 2025 and $3.1B in the first three quarters of 2026. PNG · SVG
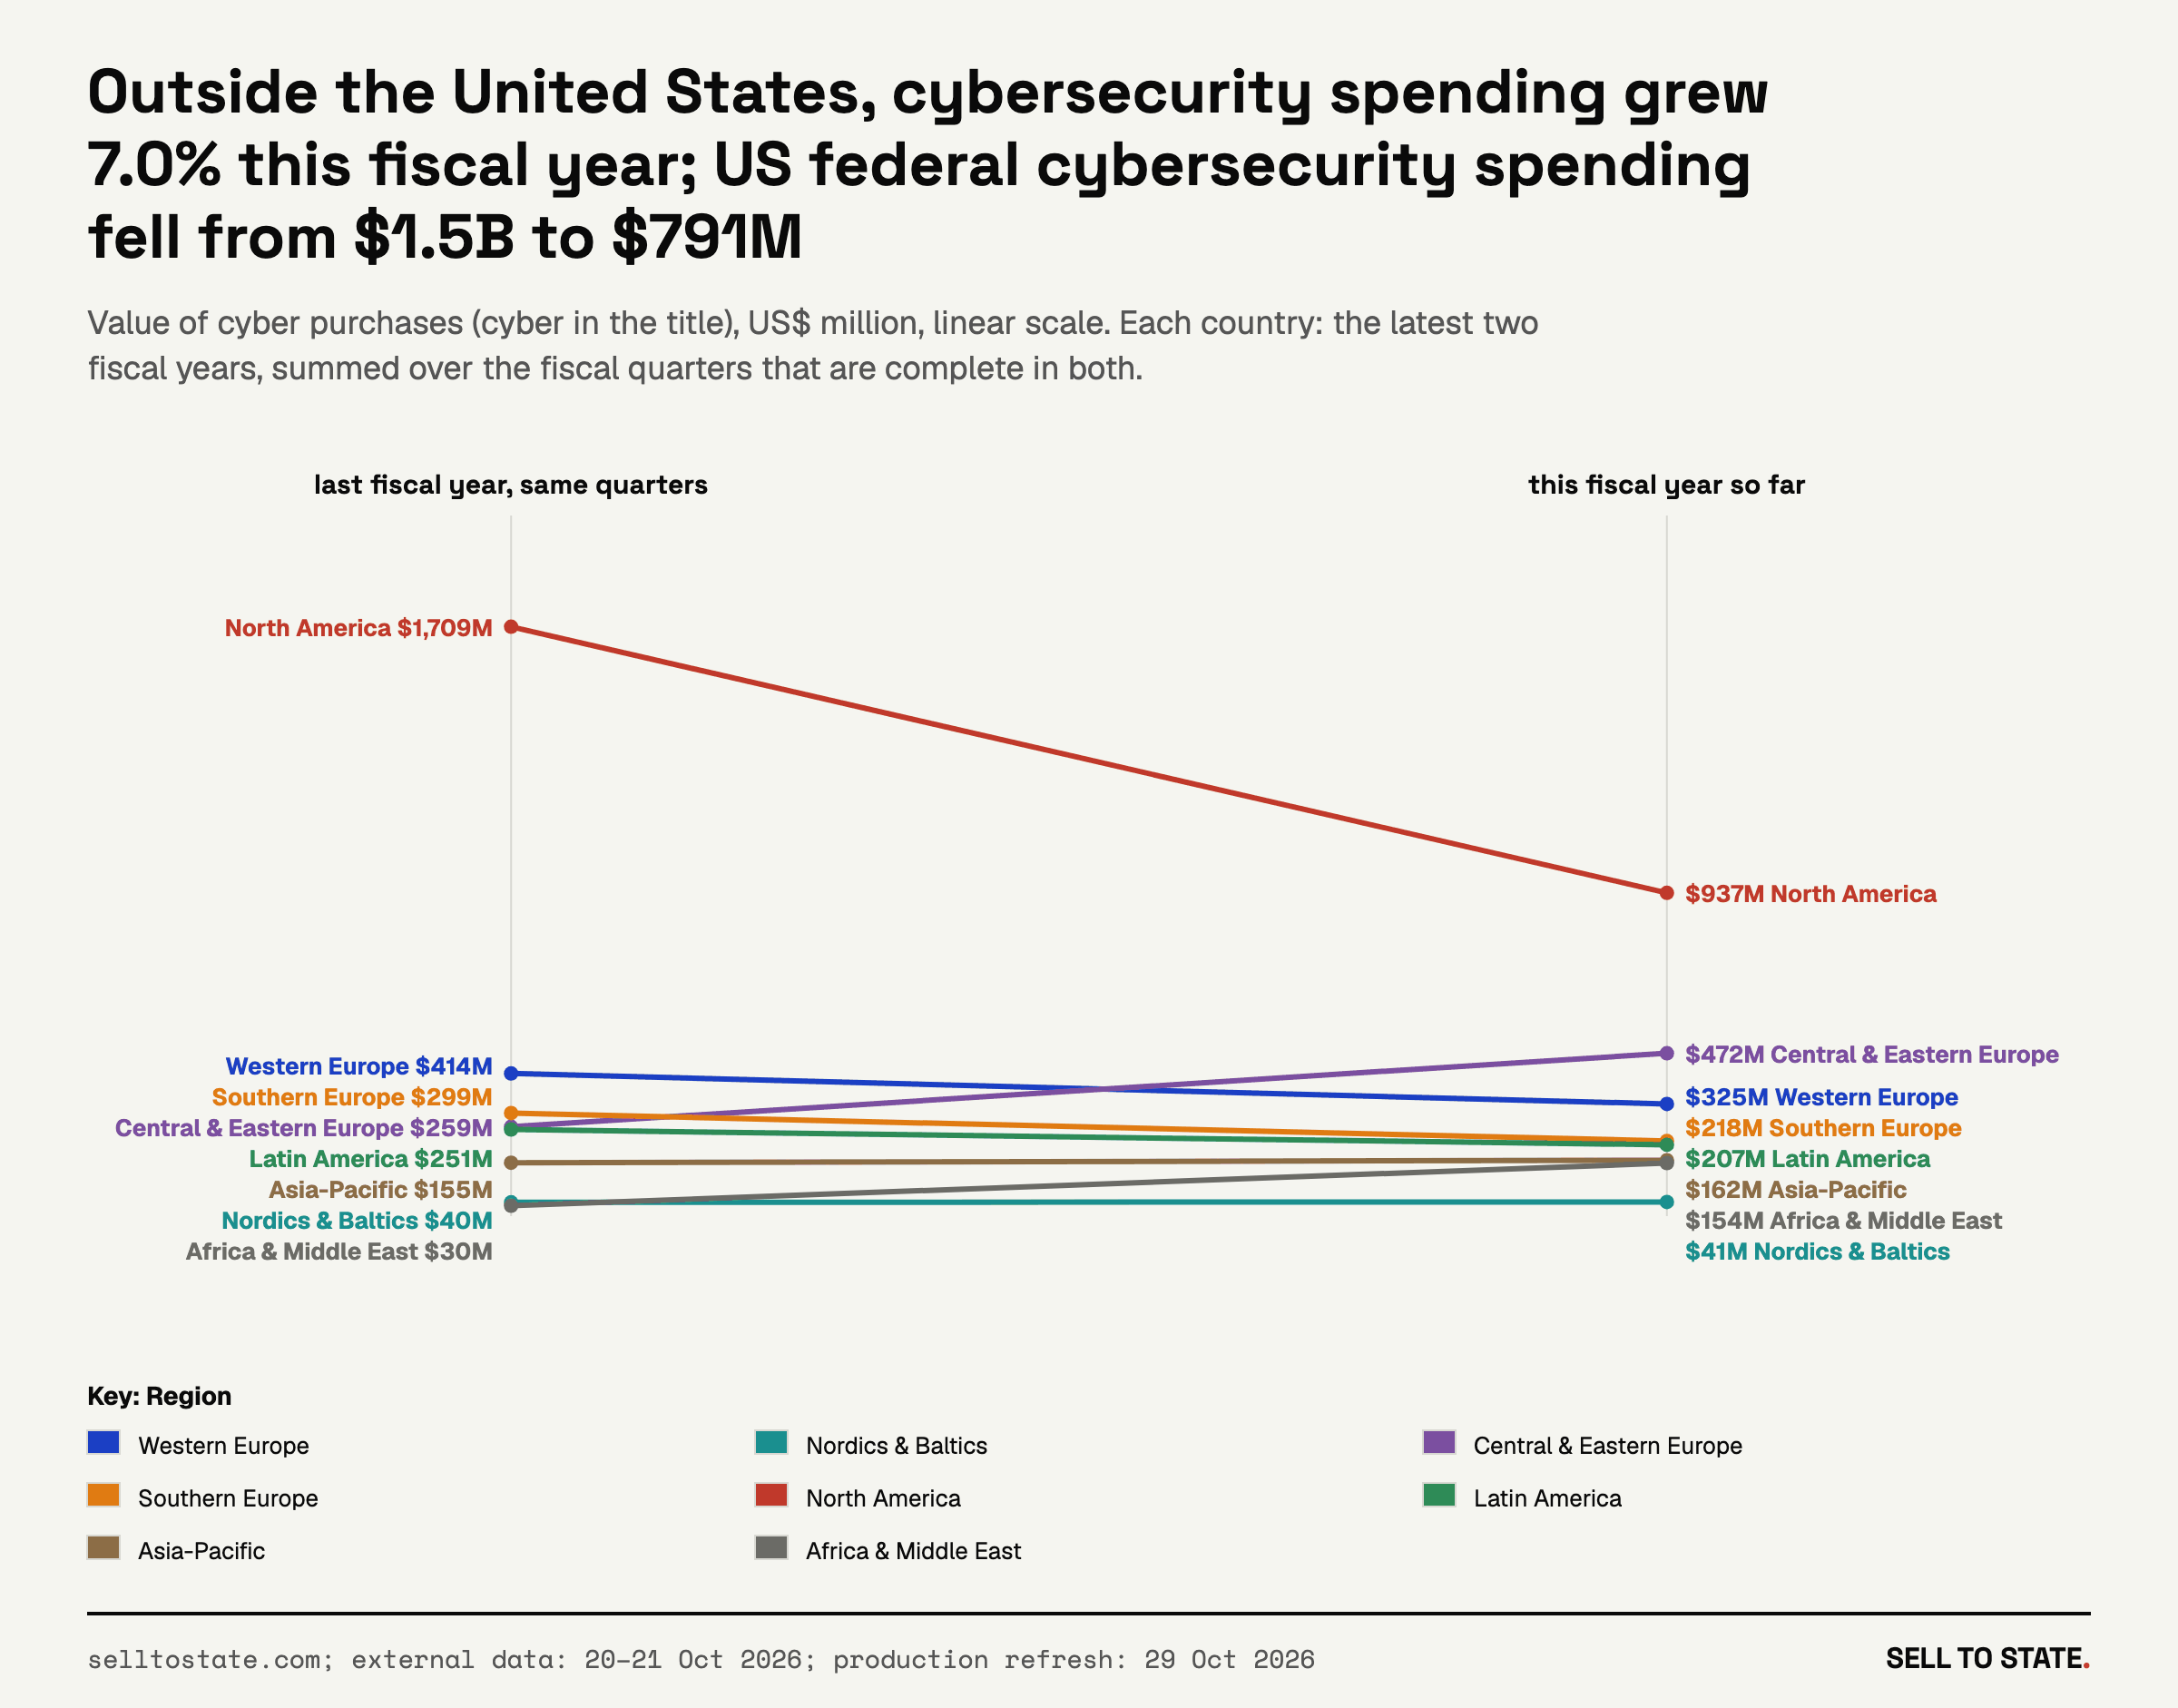
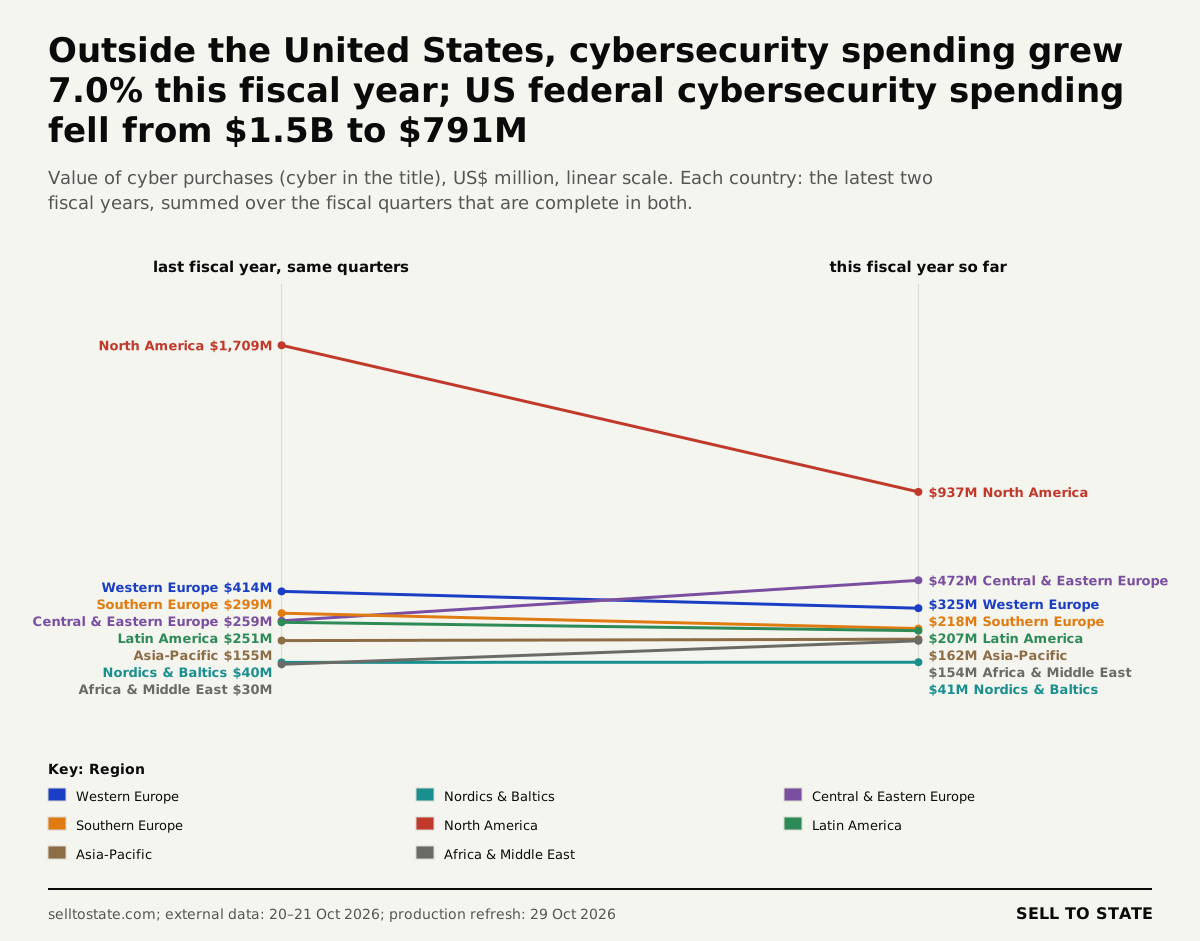
V4: Outside the United States, cybersecurity spending grew 7.0% this fiscal year; US federal cybersecurity spending fell from $1.5B to $791M. PNG · SVG
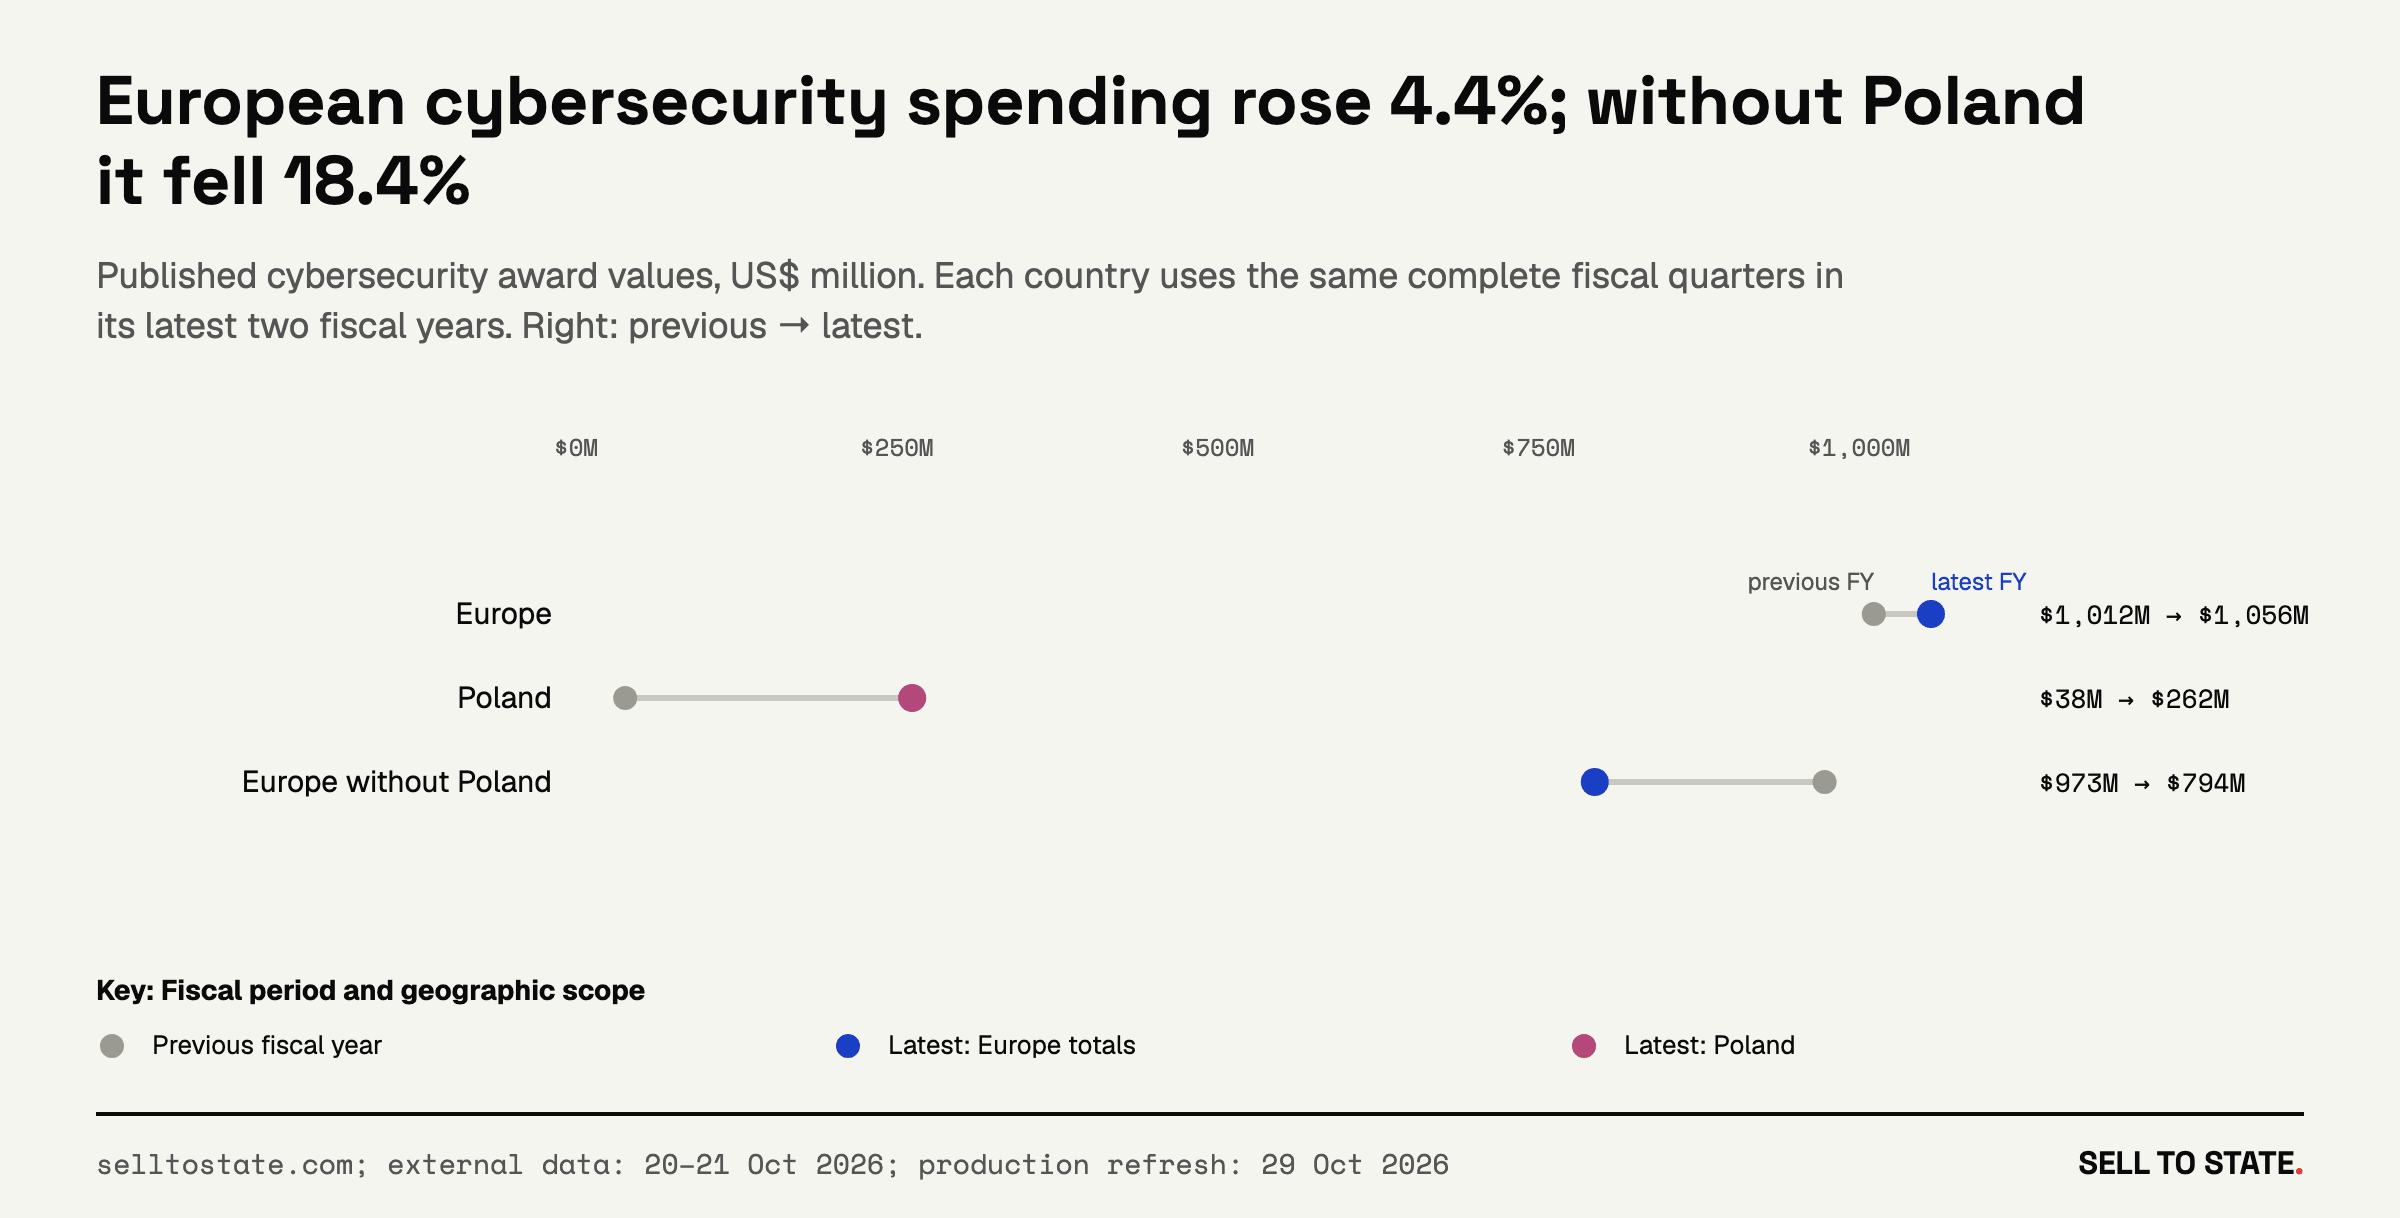
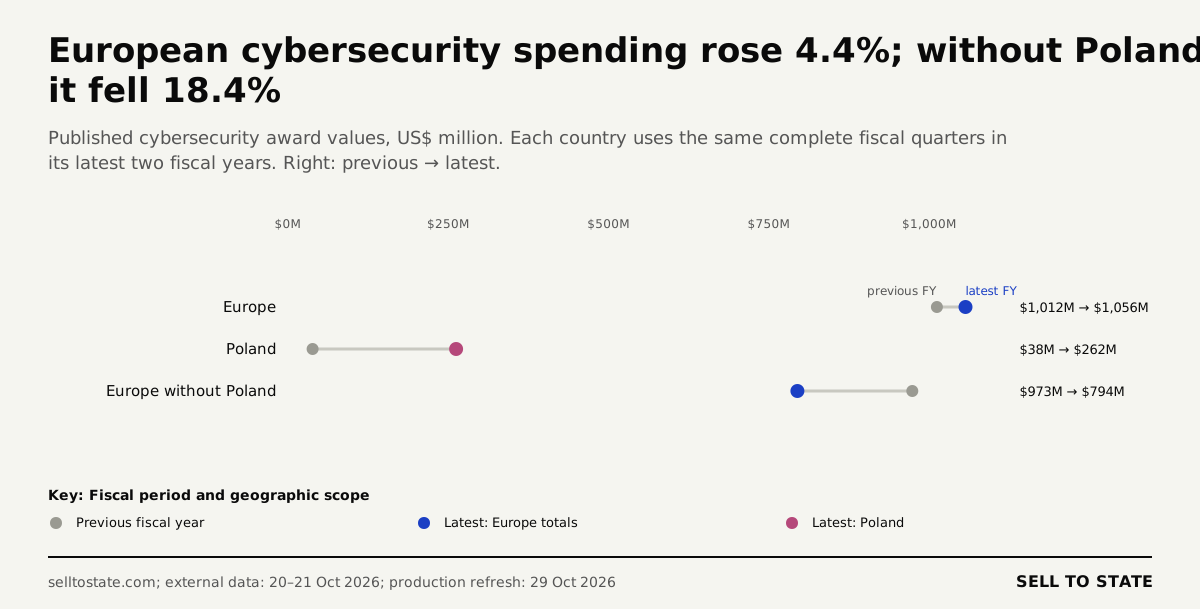
V5: European cybersecurity spending rose 4.4%; without Poland it fell 18.4%. PNG · SVG
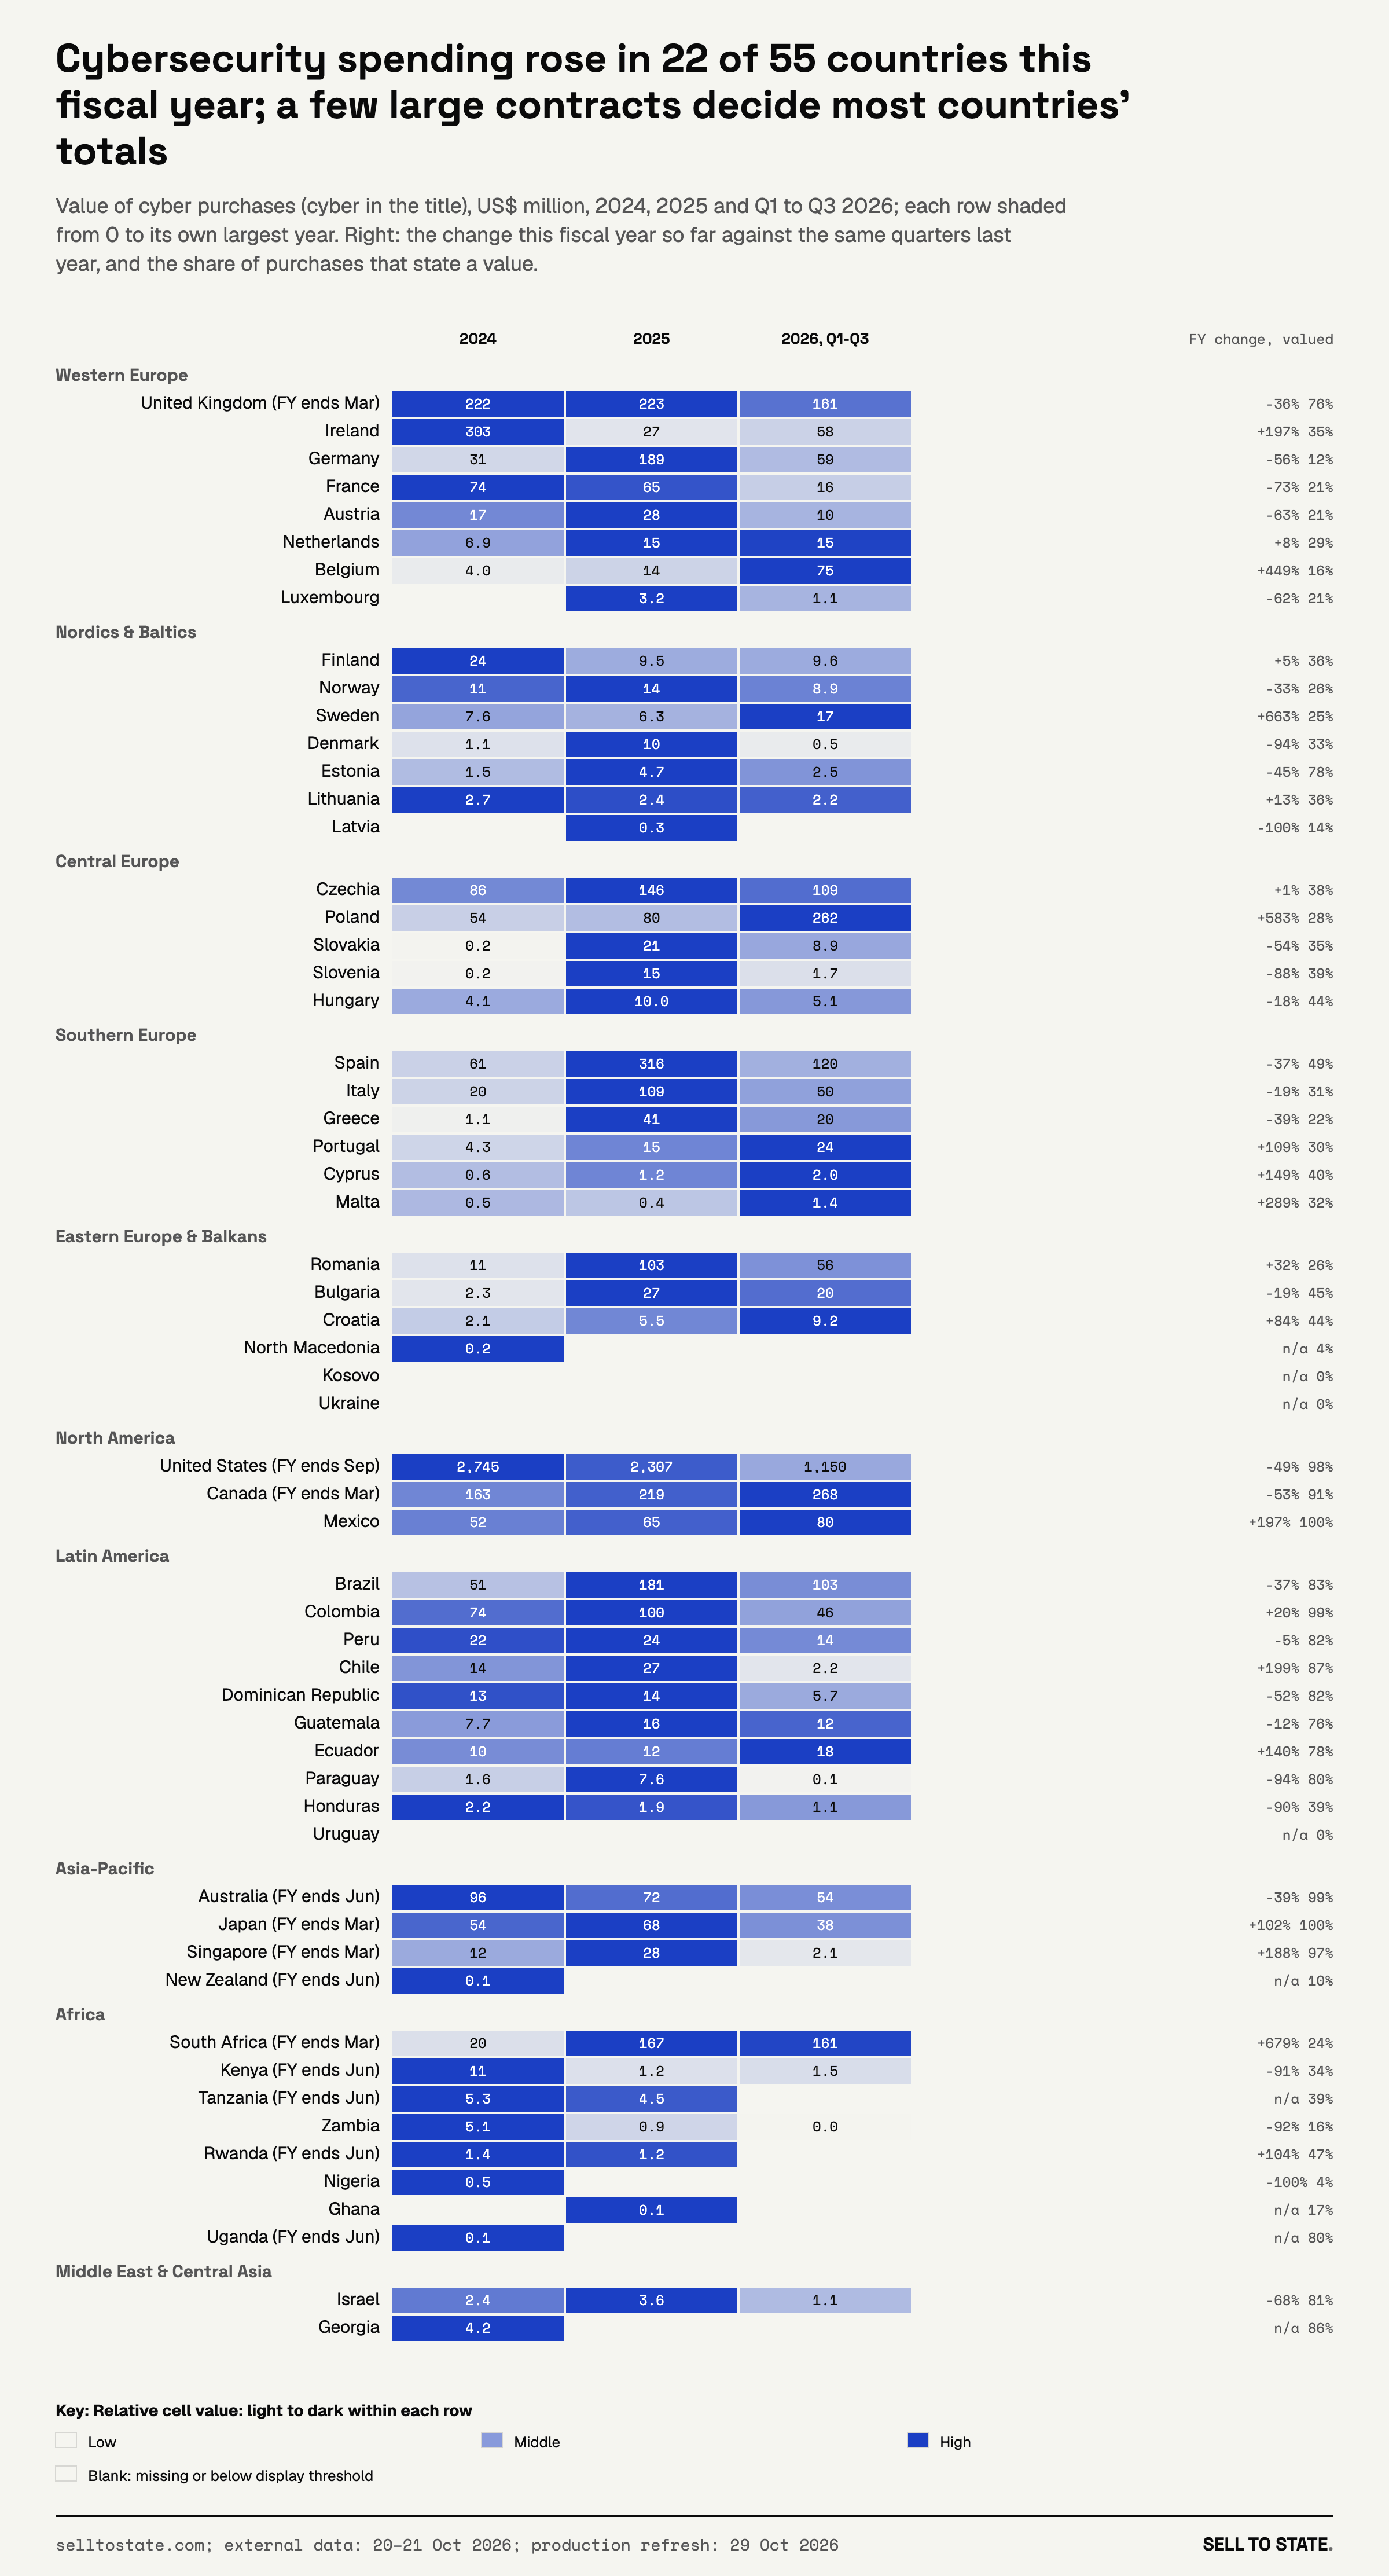
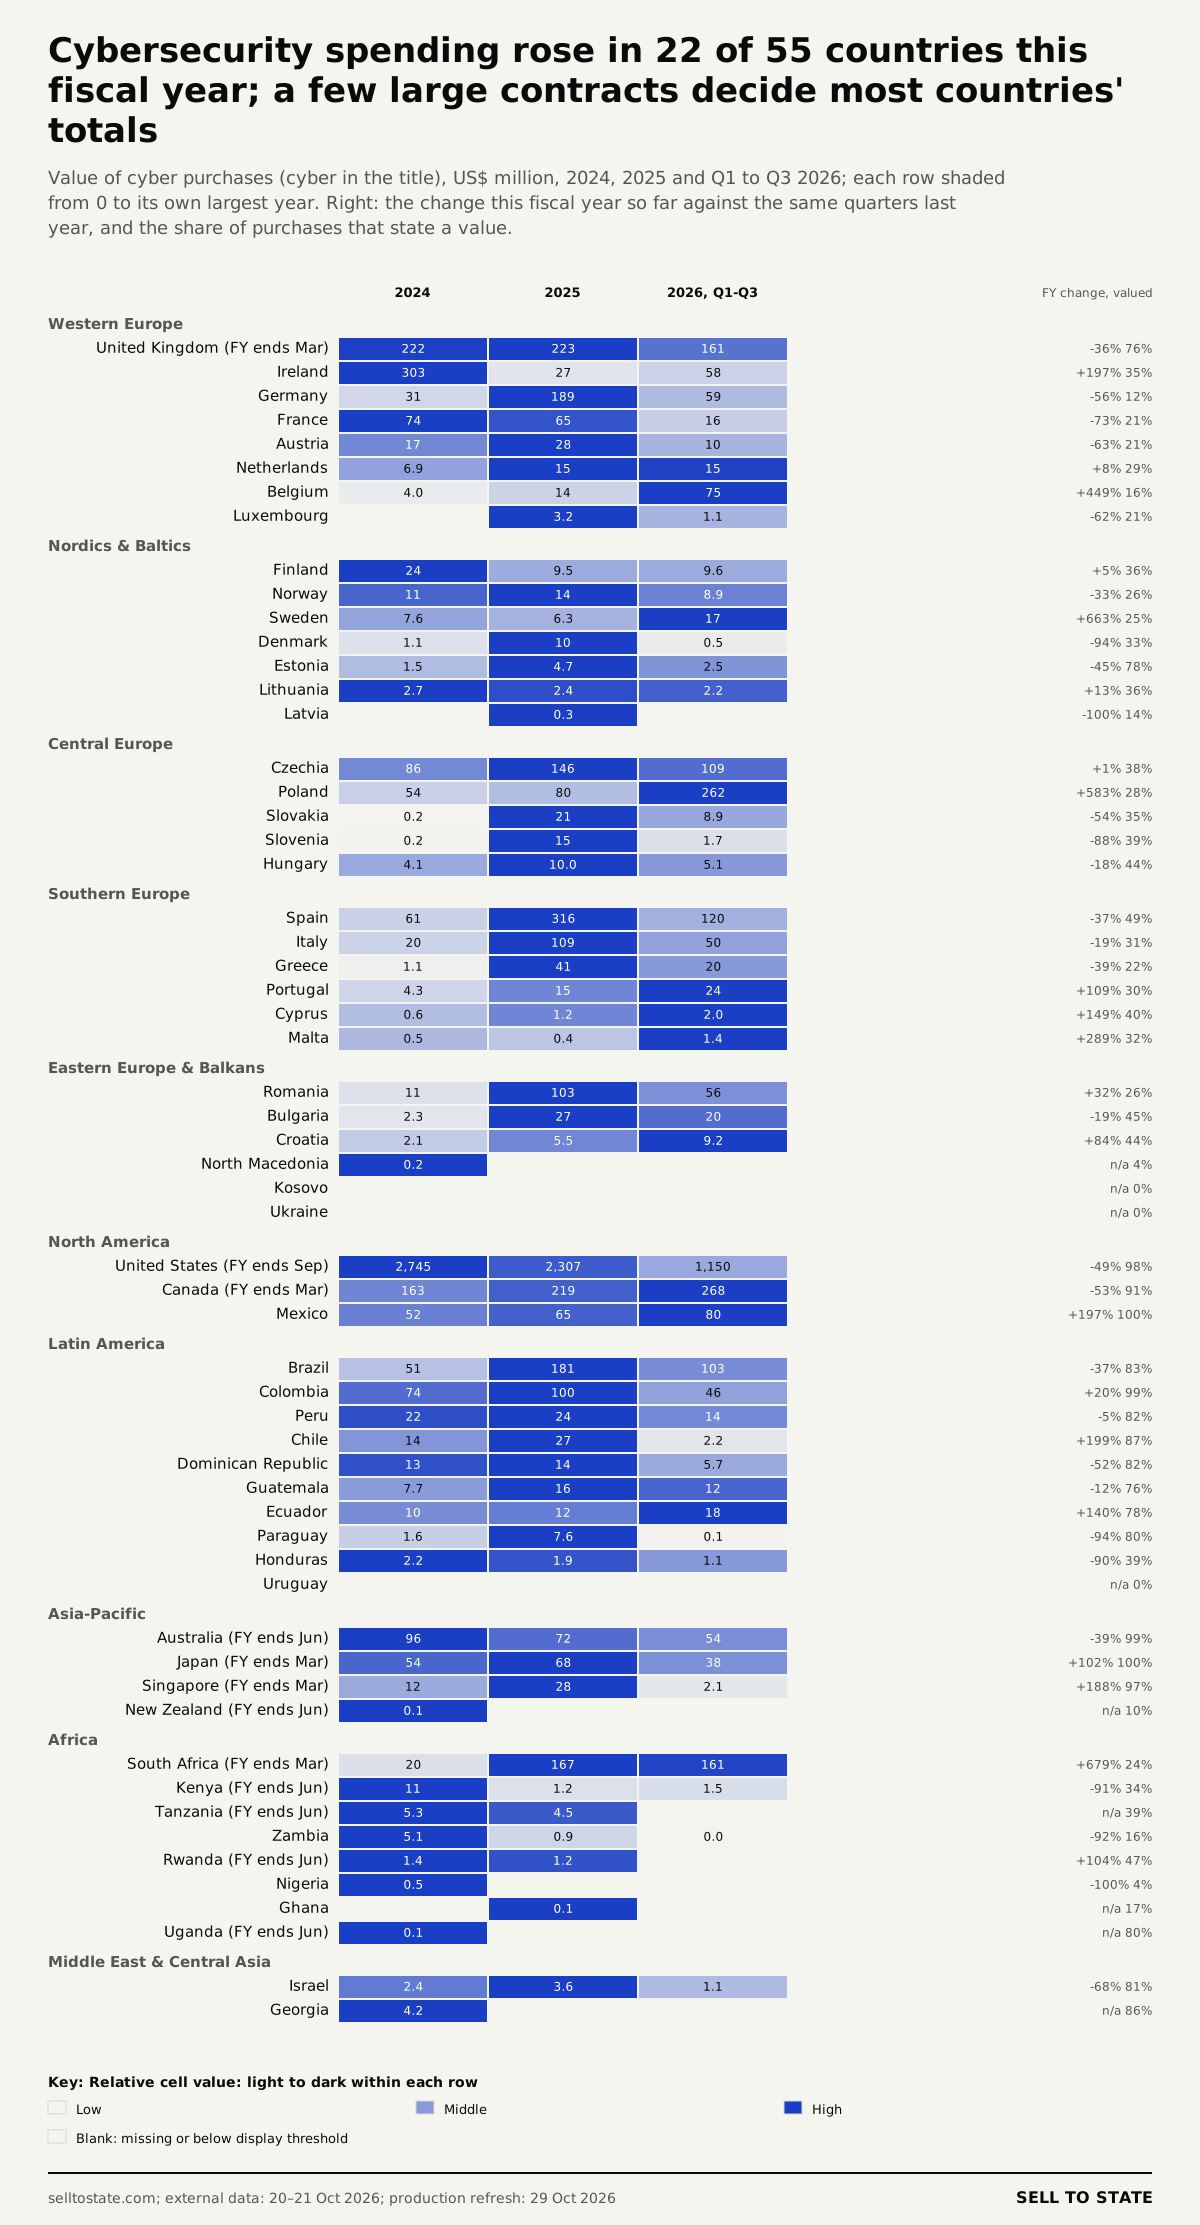
V6: Cybersecurity spending rose in 22 of 55 countries this fiscal year; a few large contracts decide most countries' totals. PNG · SVG
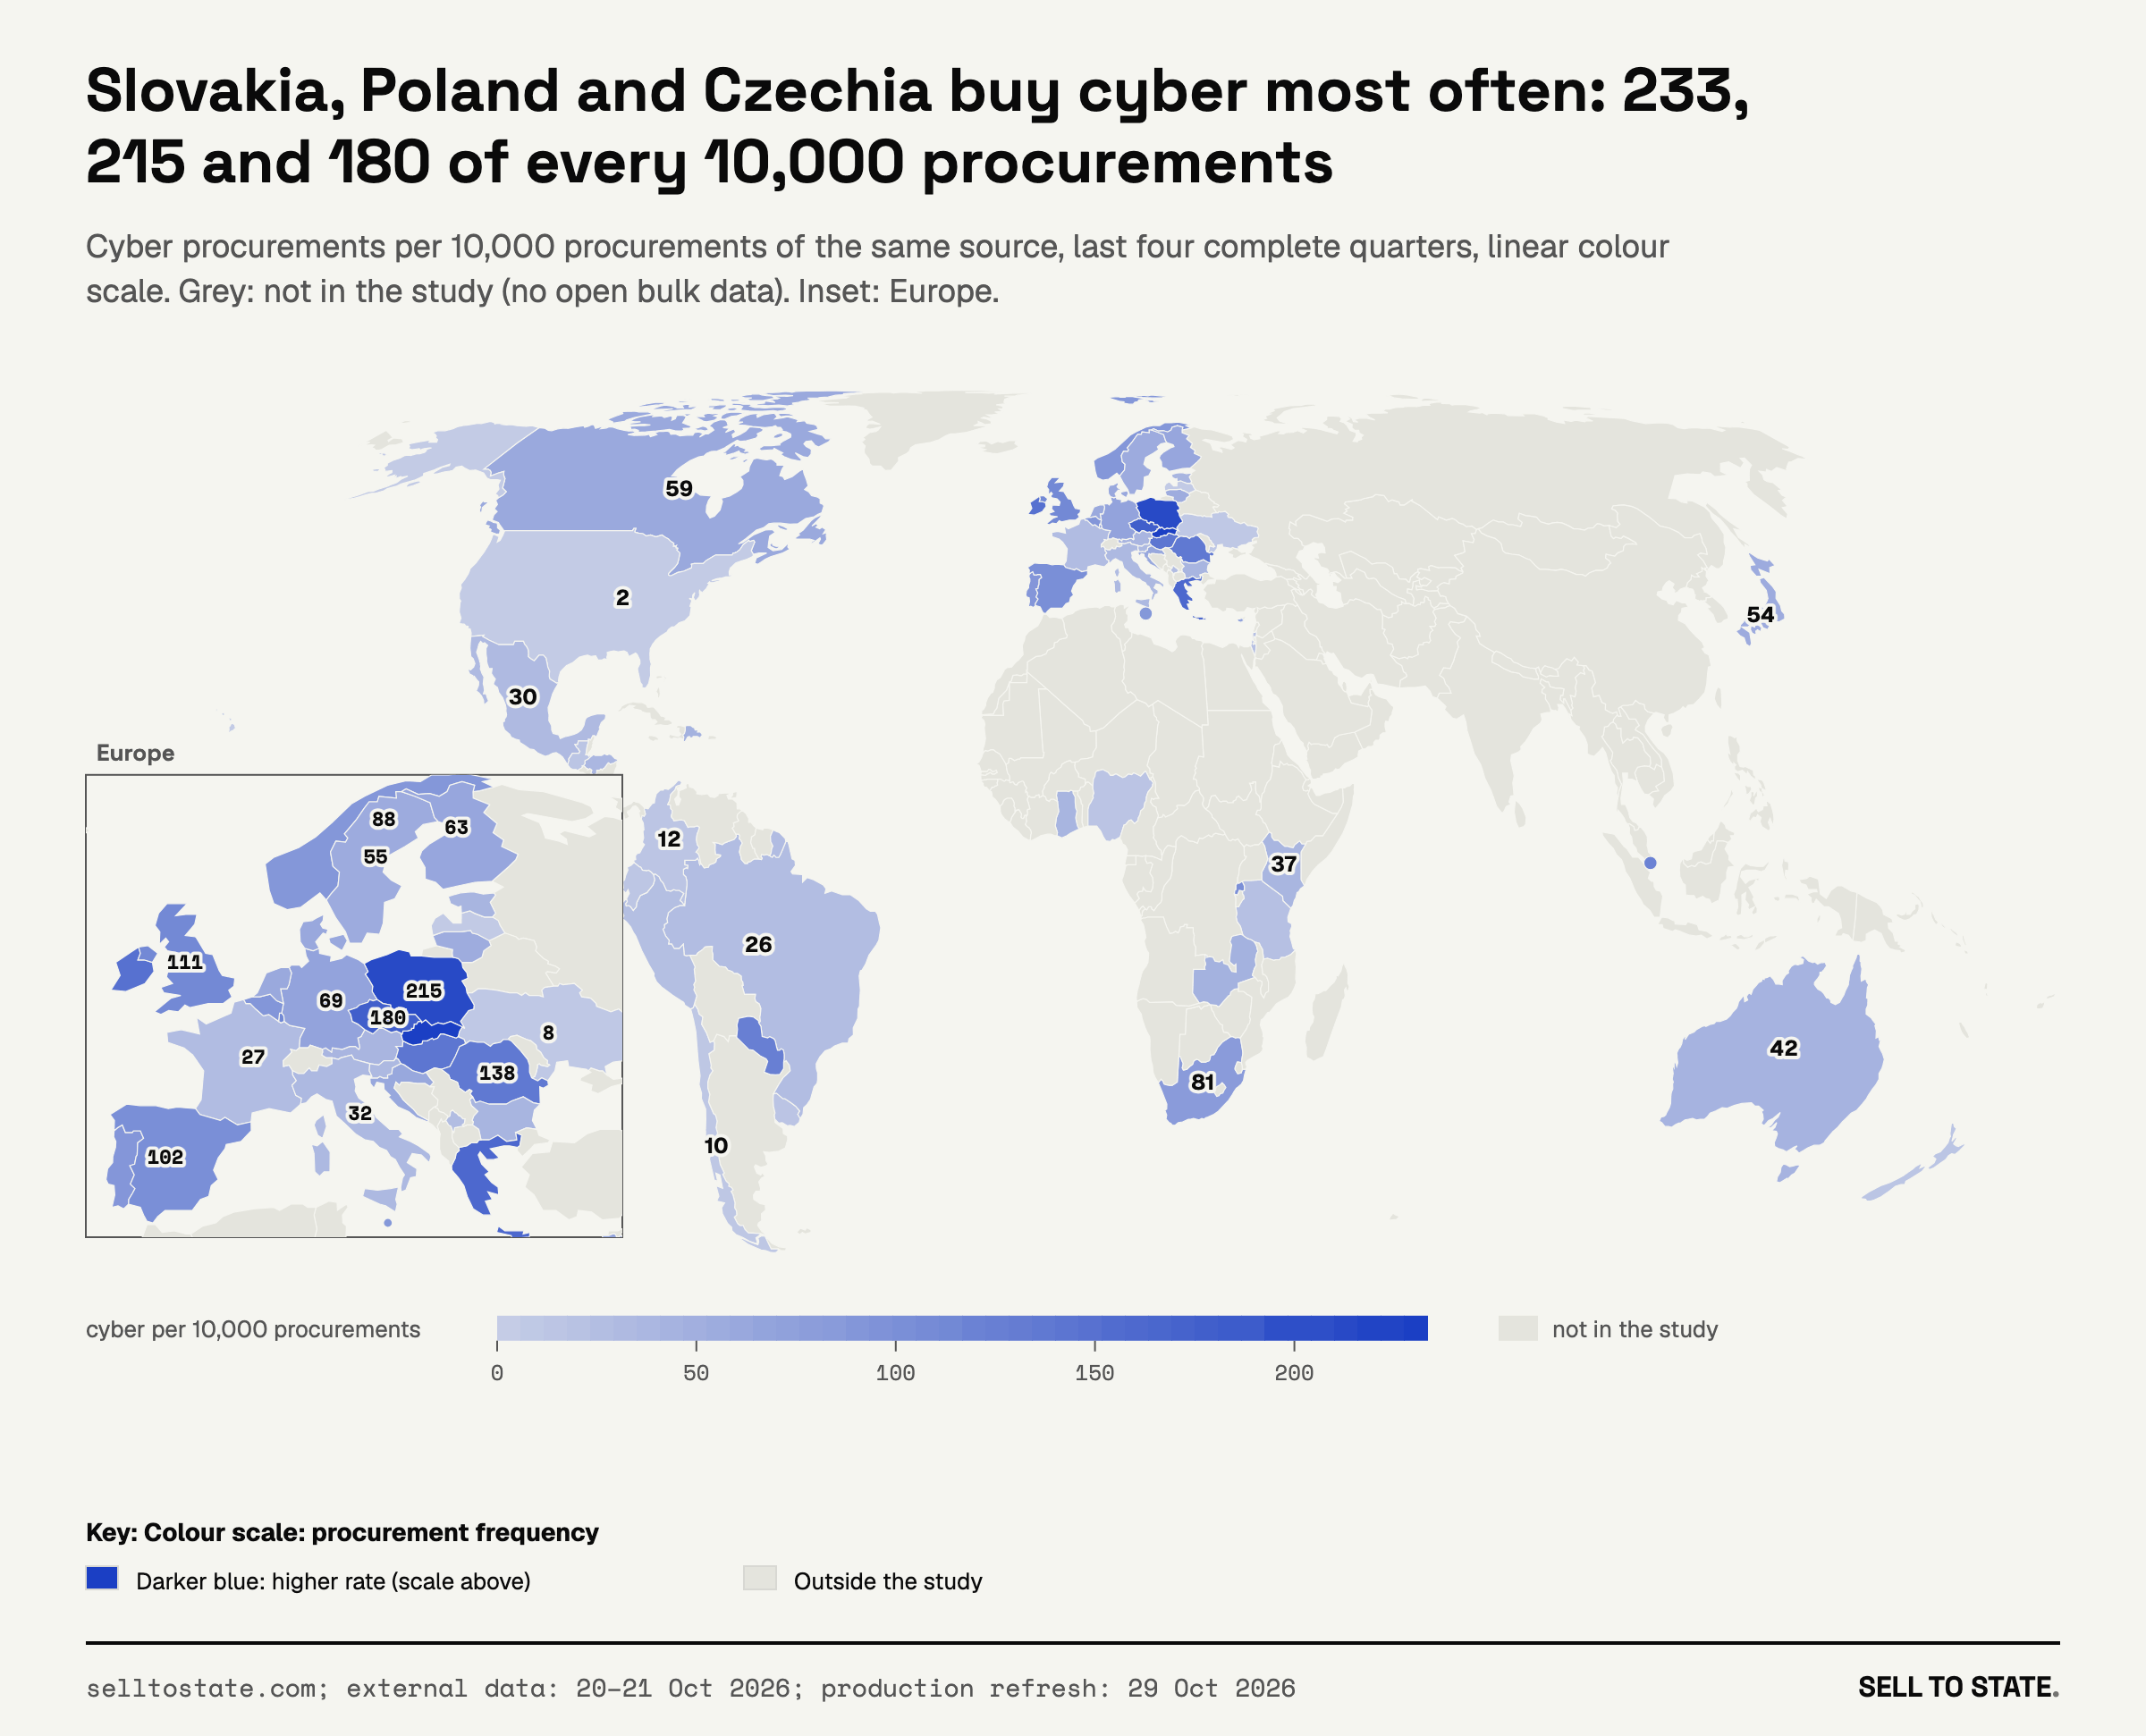
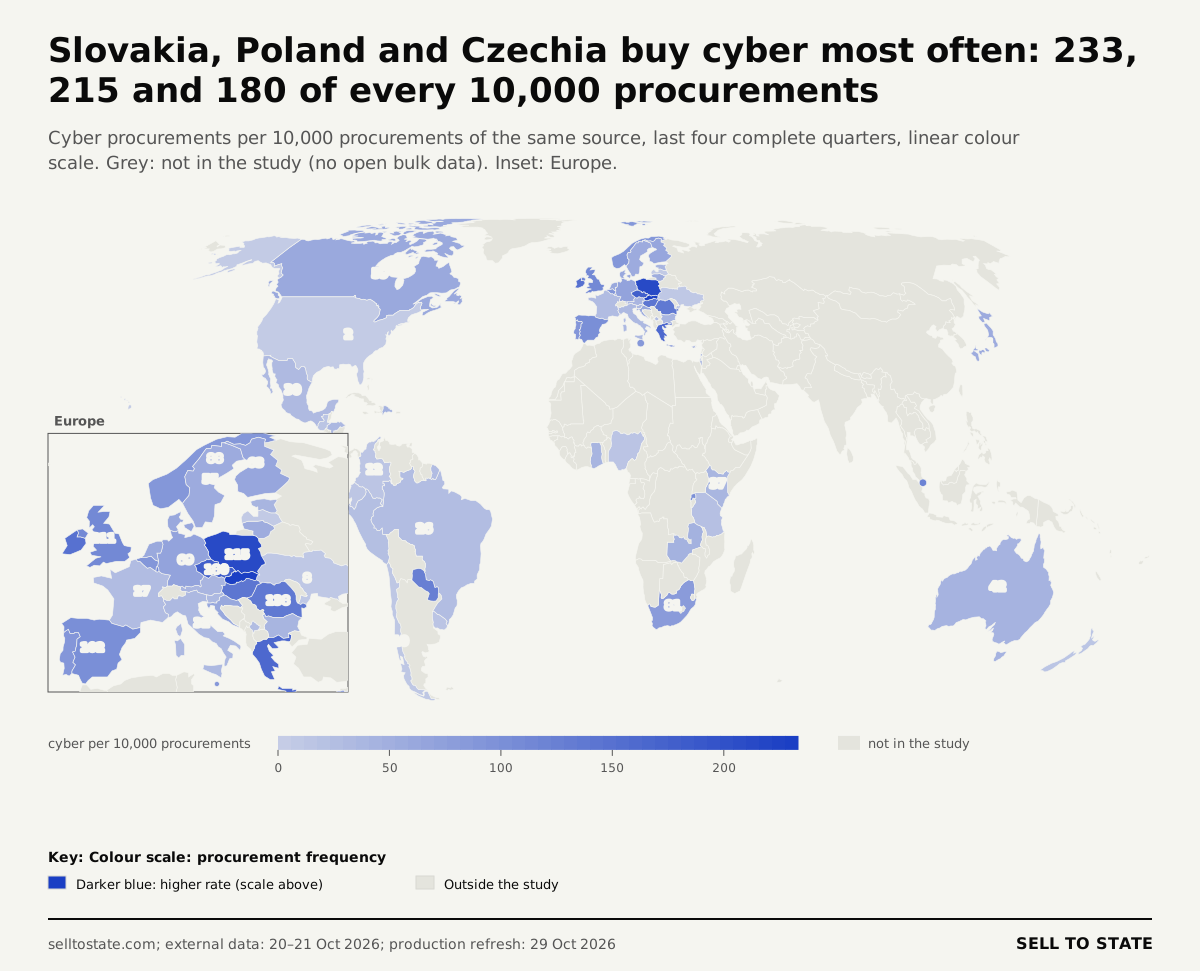
V7: Slovakia, Poland and Czechia buy cyber most often: 233, 215 and 180 of every 10,000 procurements. PNG · SVG
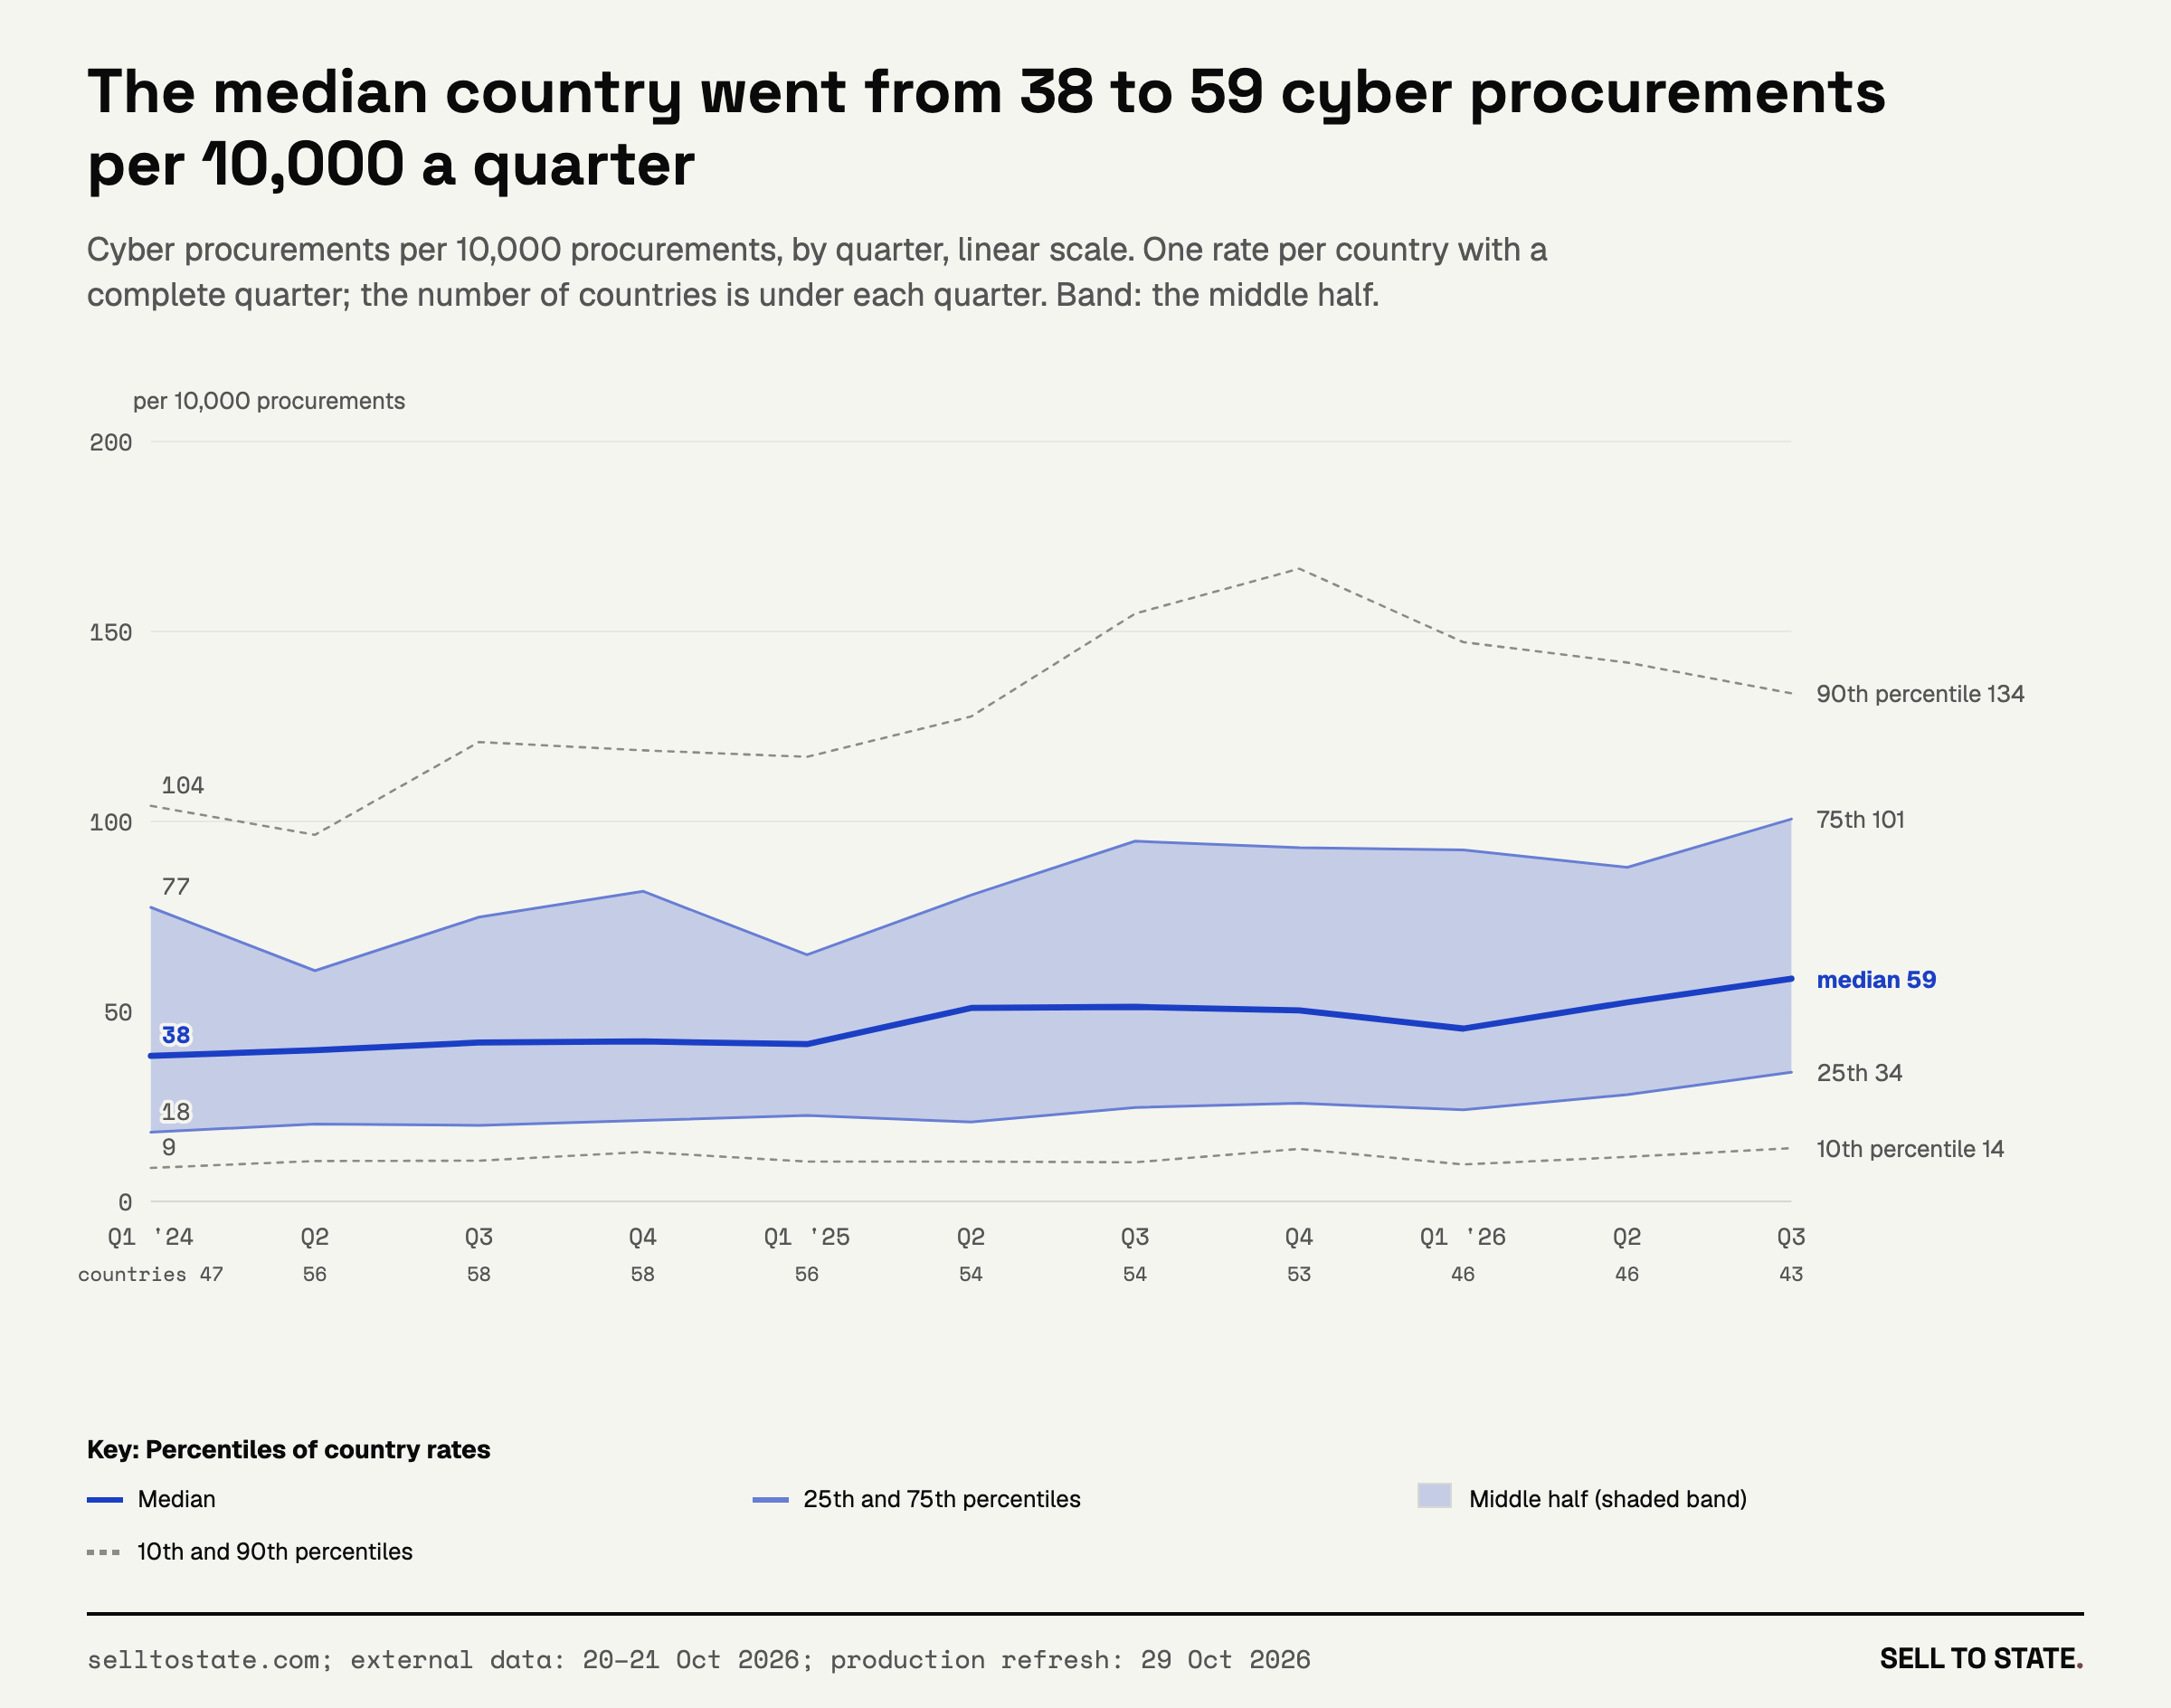
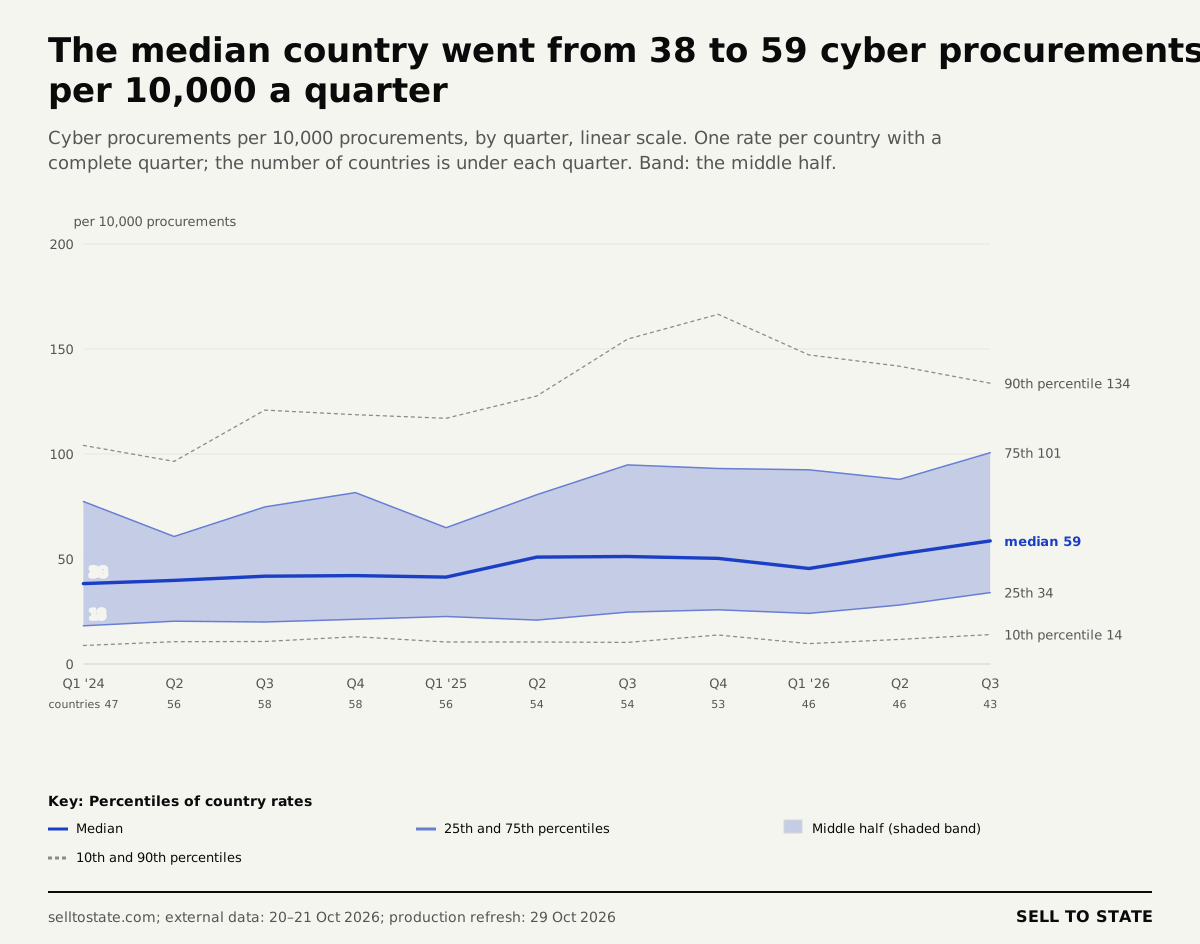
V8: The median country went from 38 to 59 cyber procurements per 10,000 a quarter. PNG · SVG
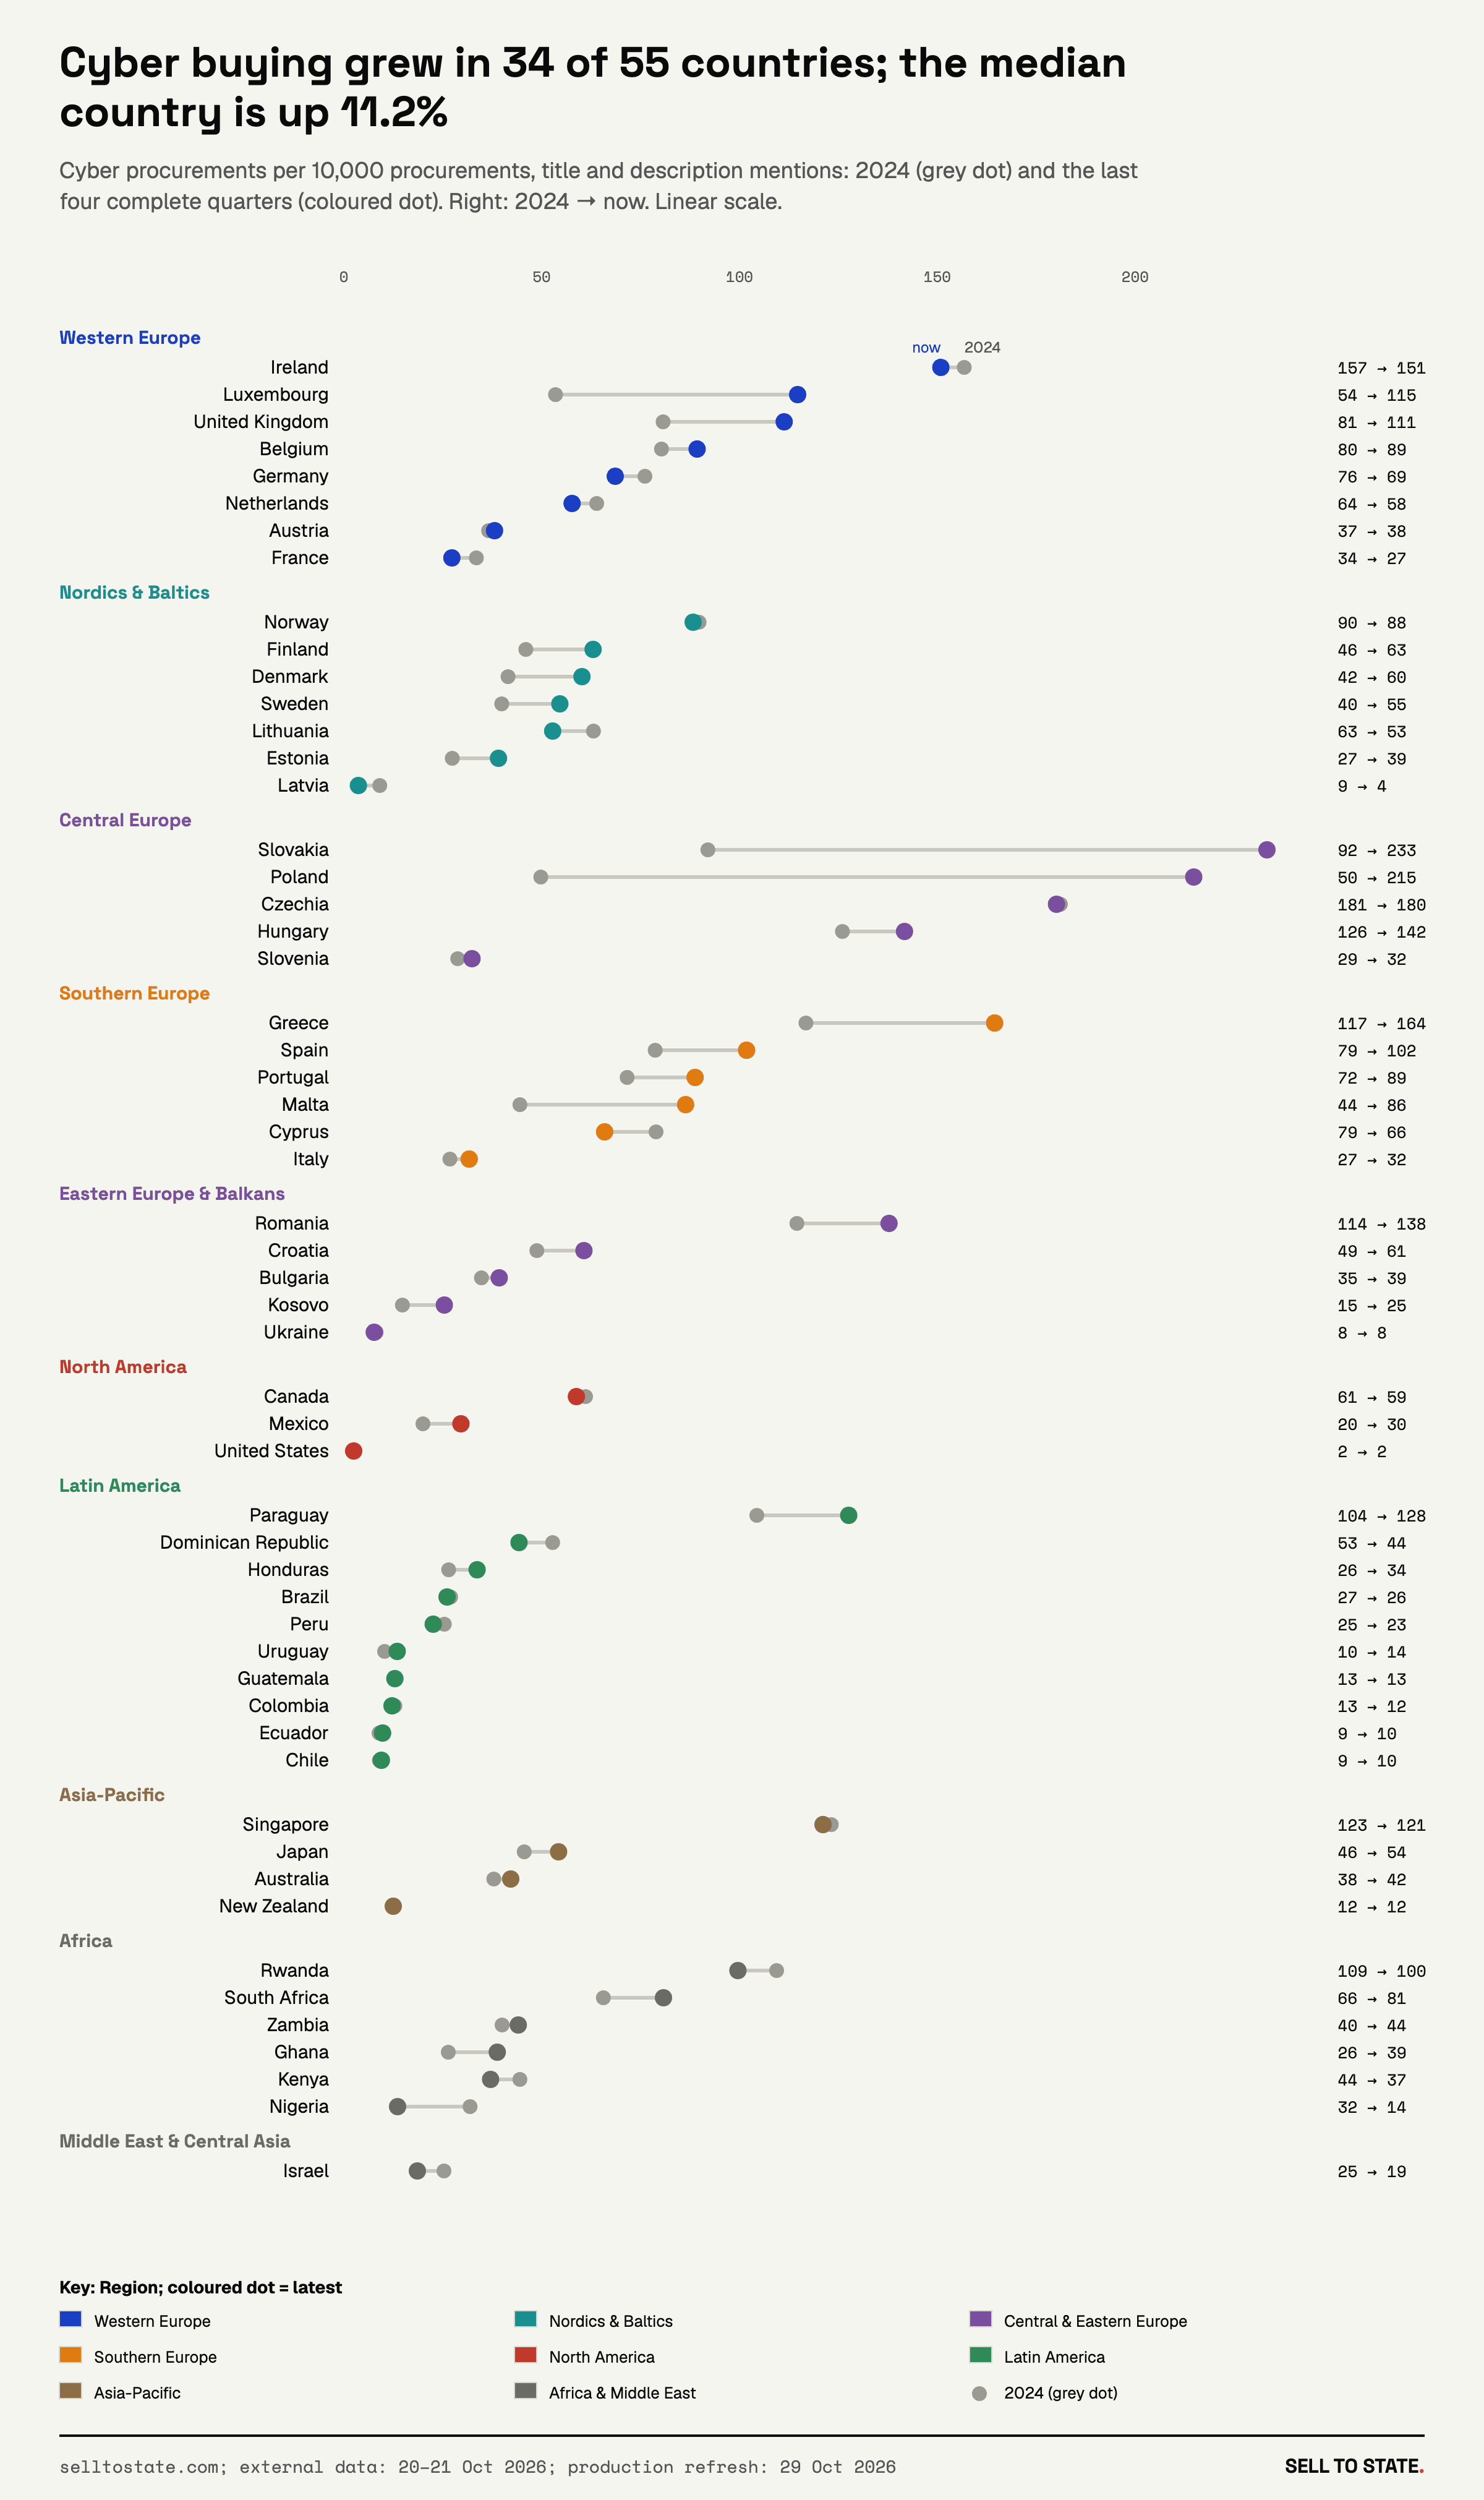
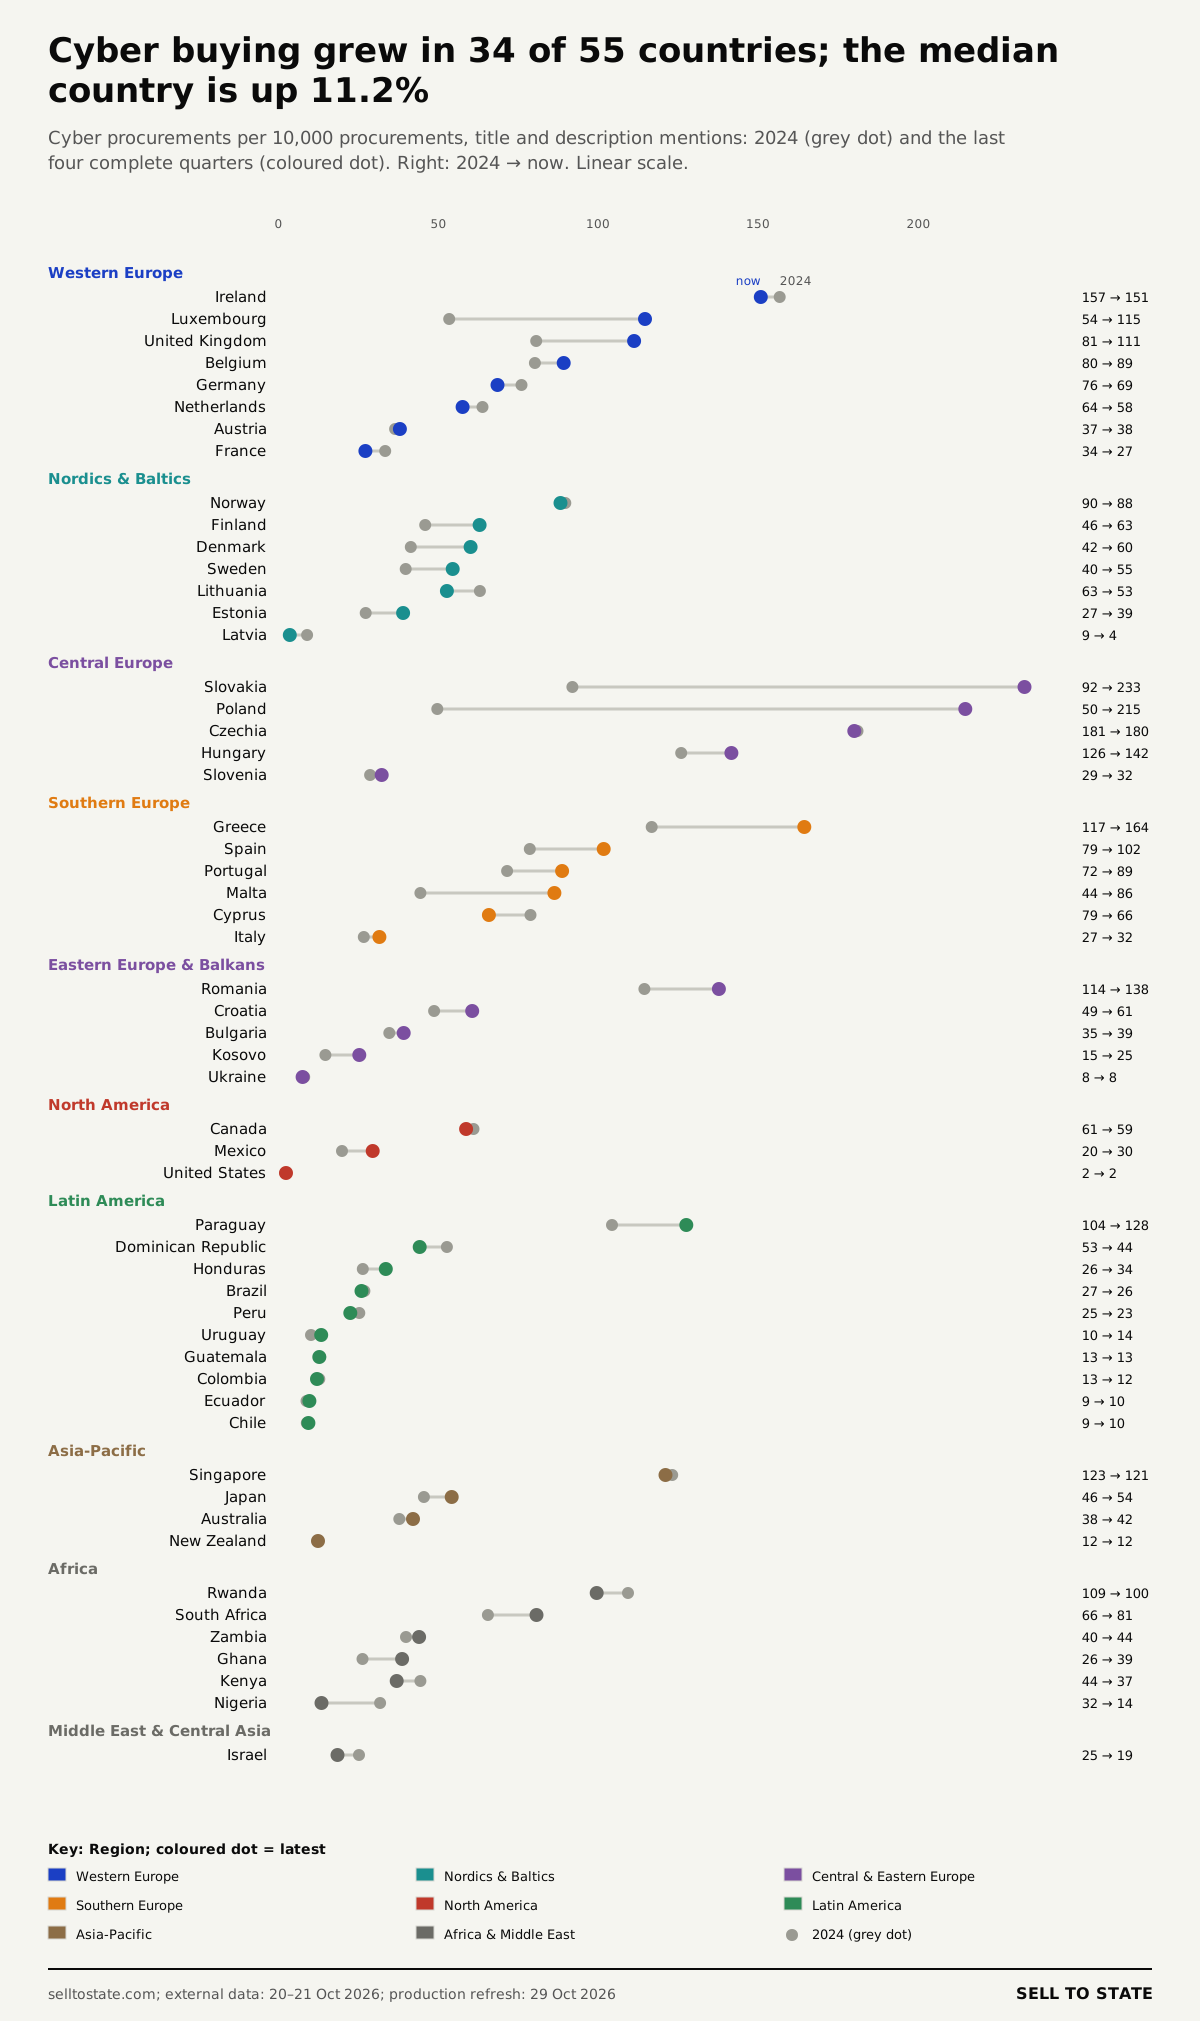
V9: Cyber buying grew in 34 of 55 countries; the median country is up 11.2%. PNG · SVG
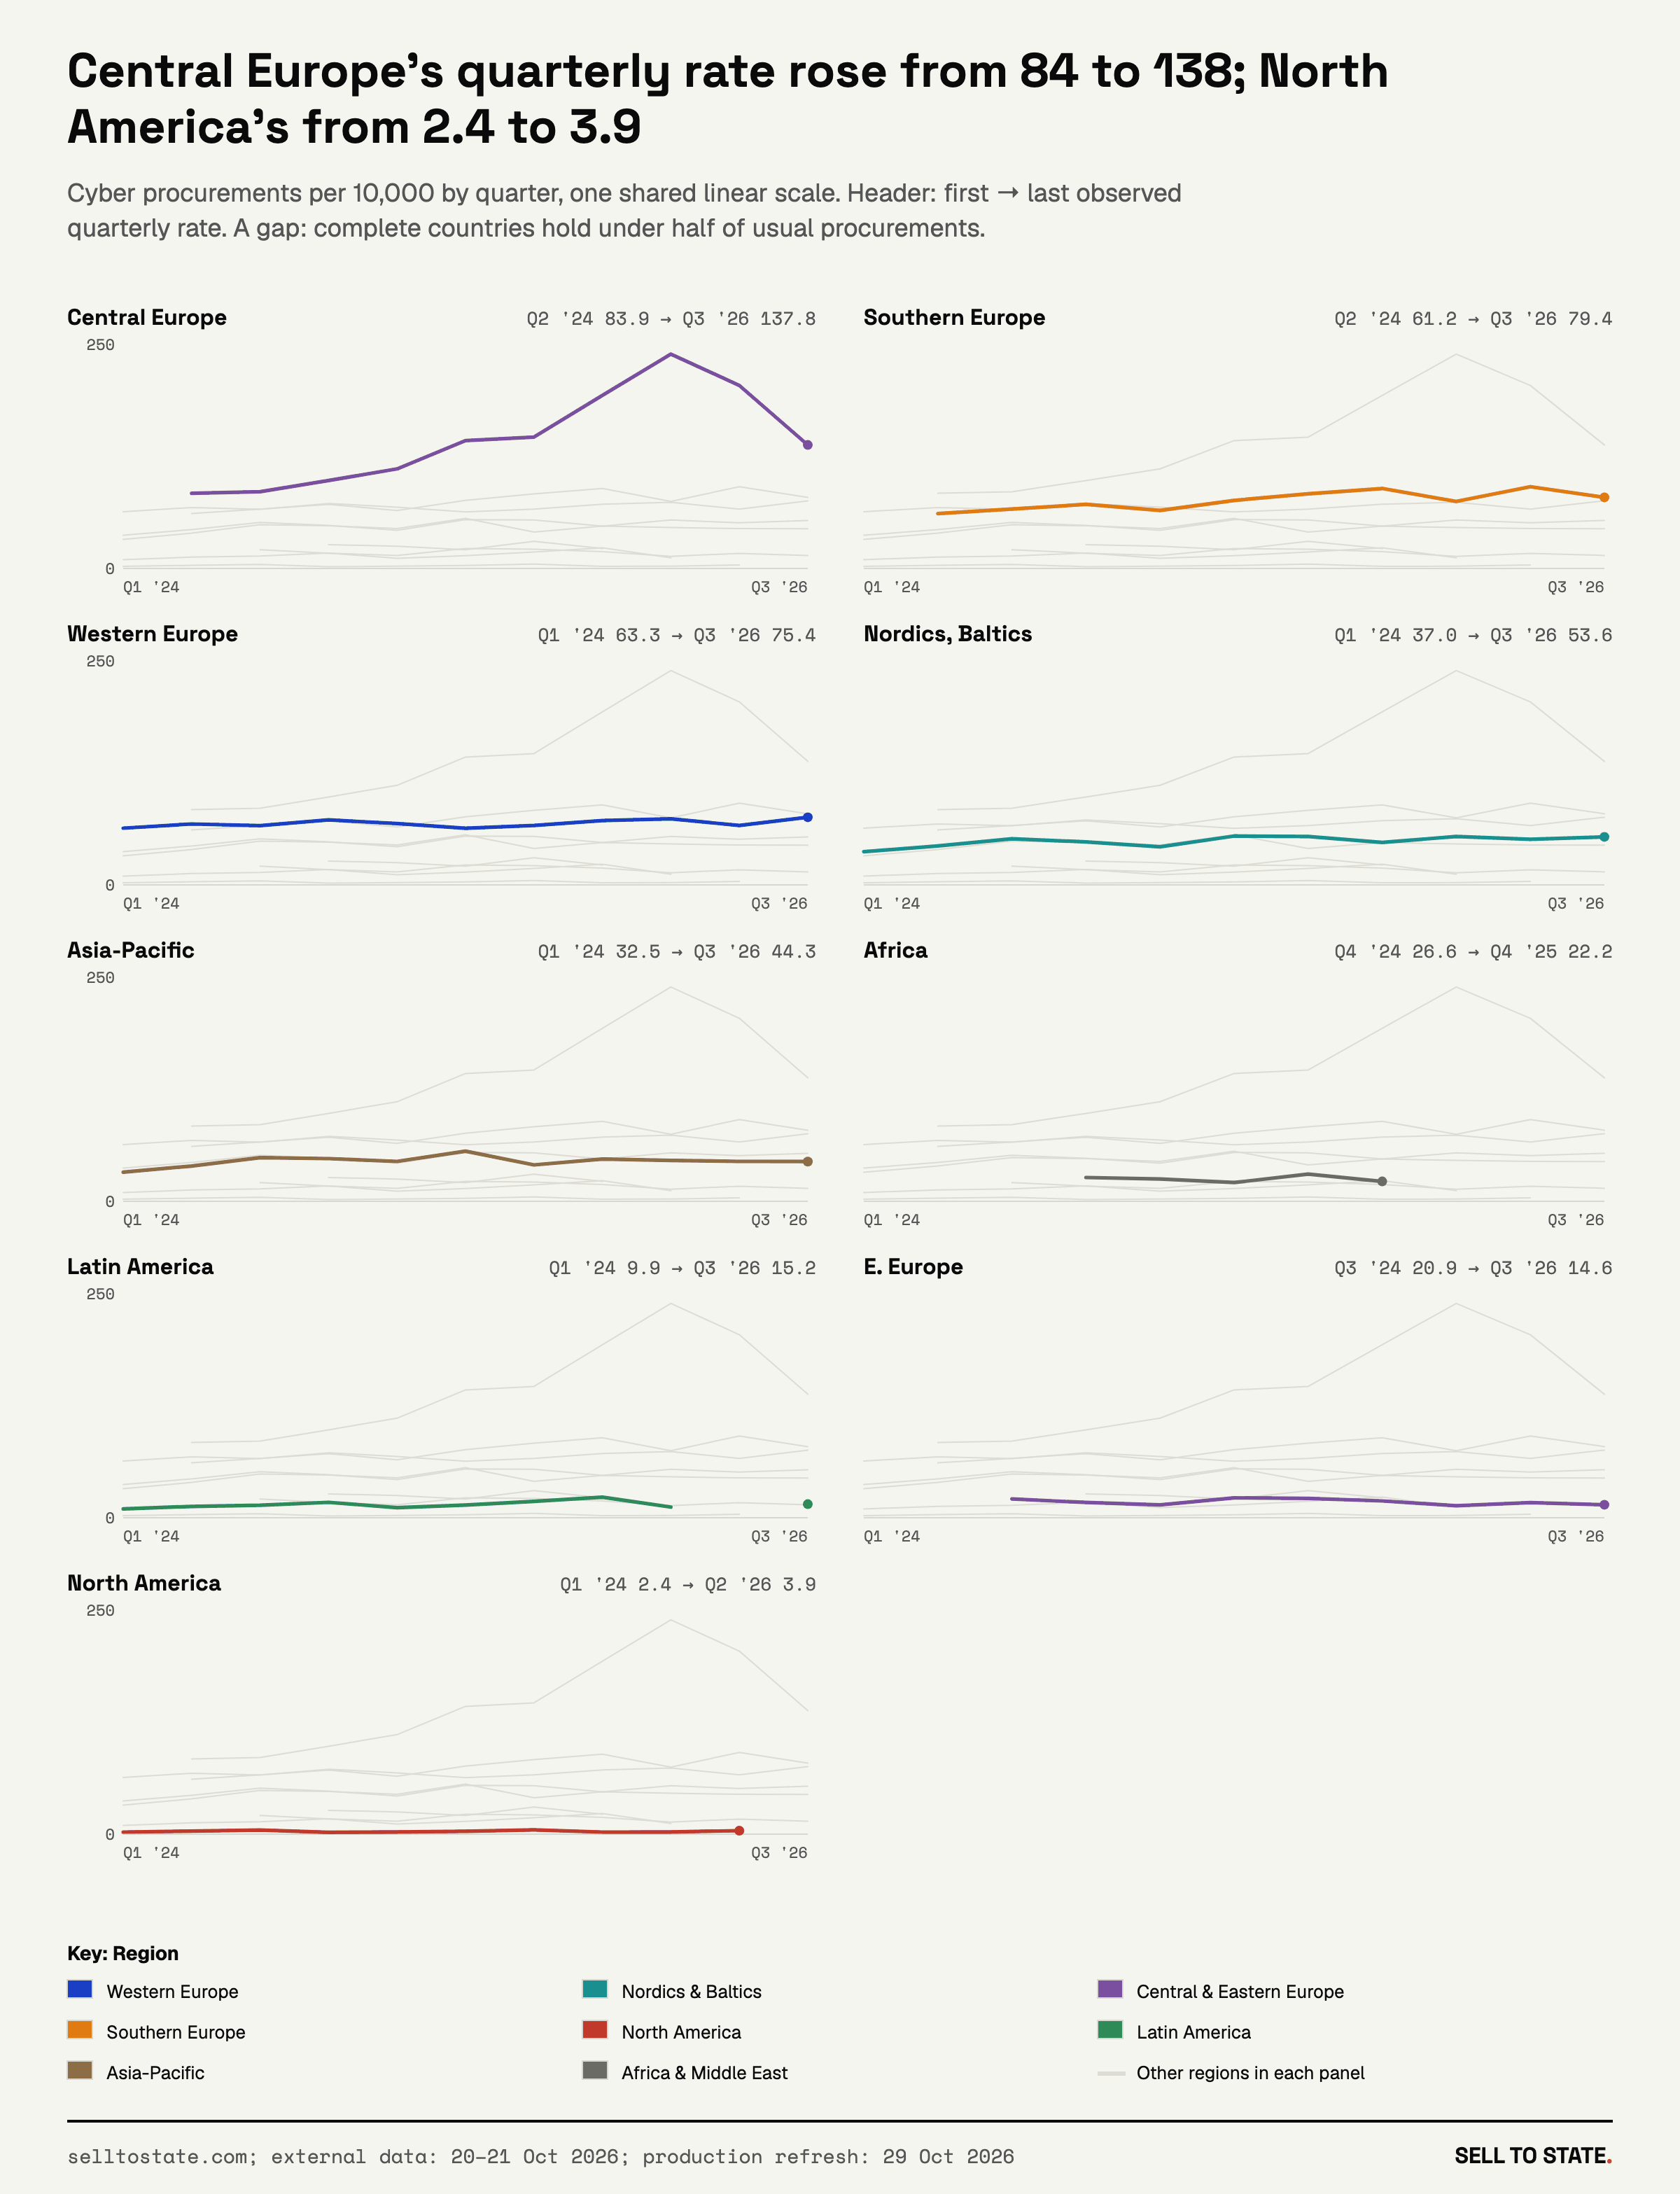
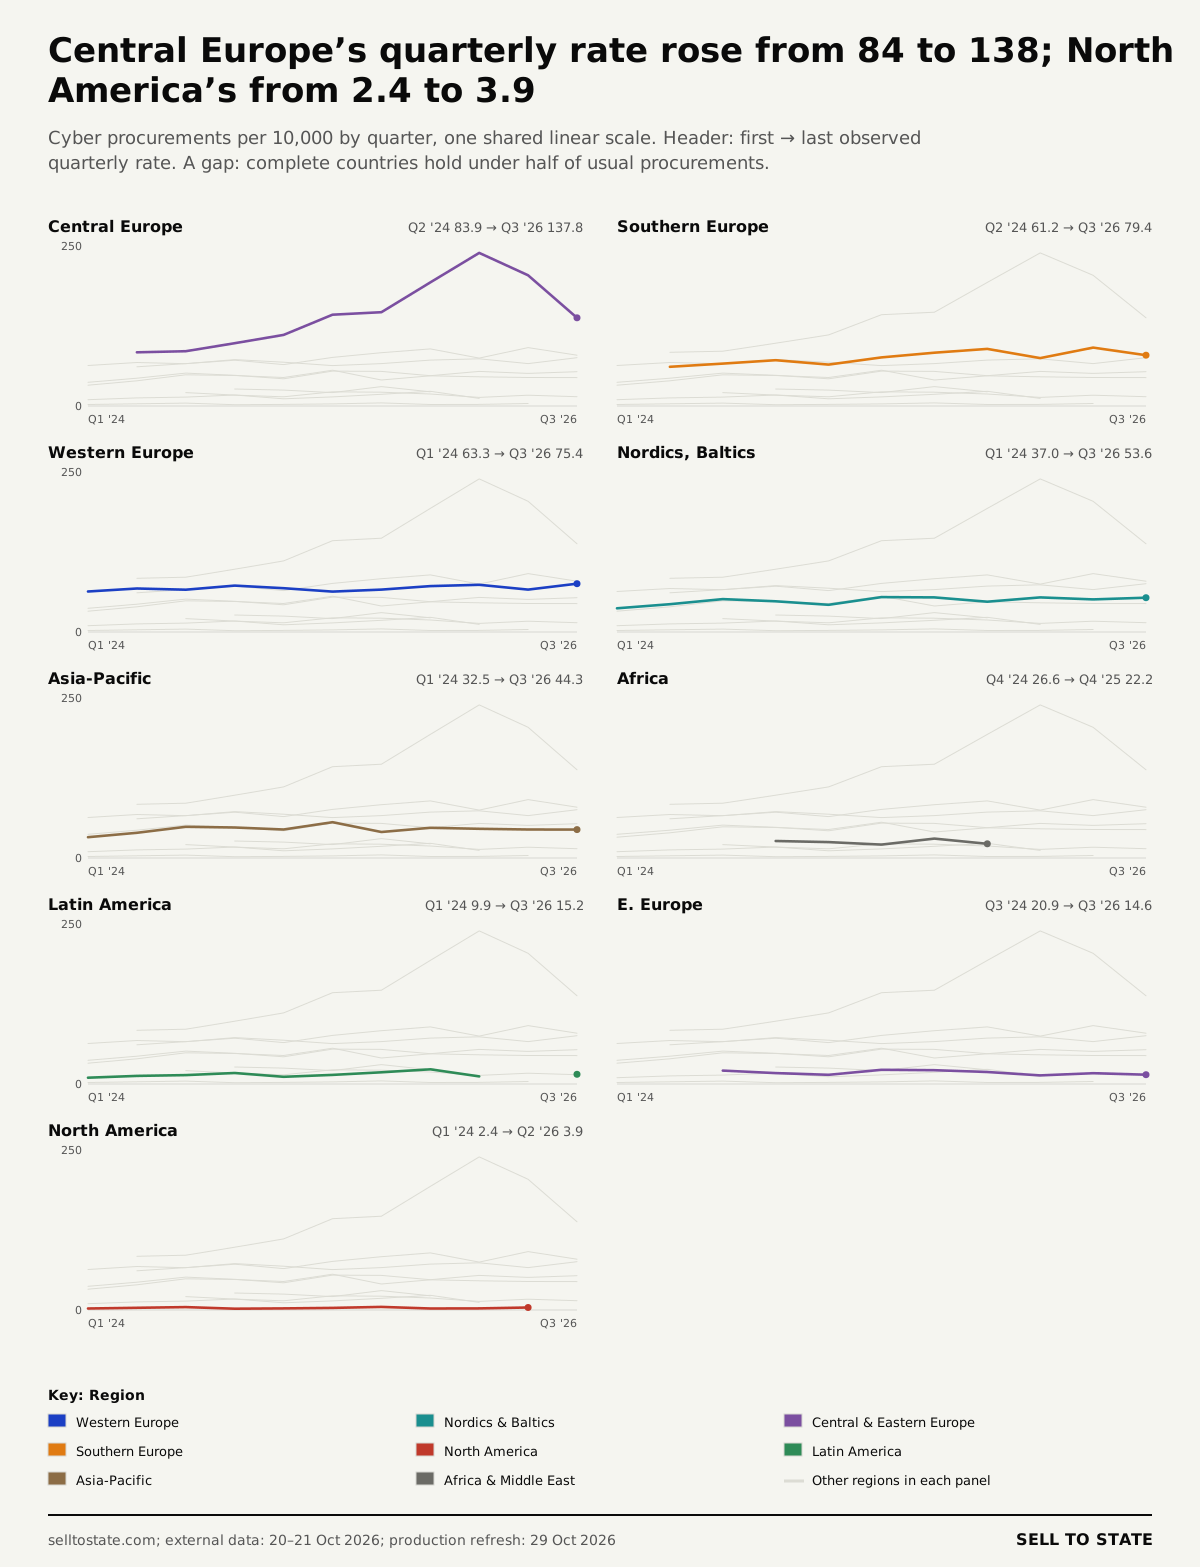
V10: Central Europe’s quarterly rate rose from 84 to 138; North America’s from 2.4 to 3.9. PNG · SVG
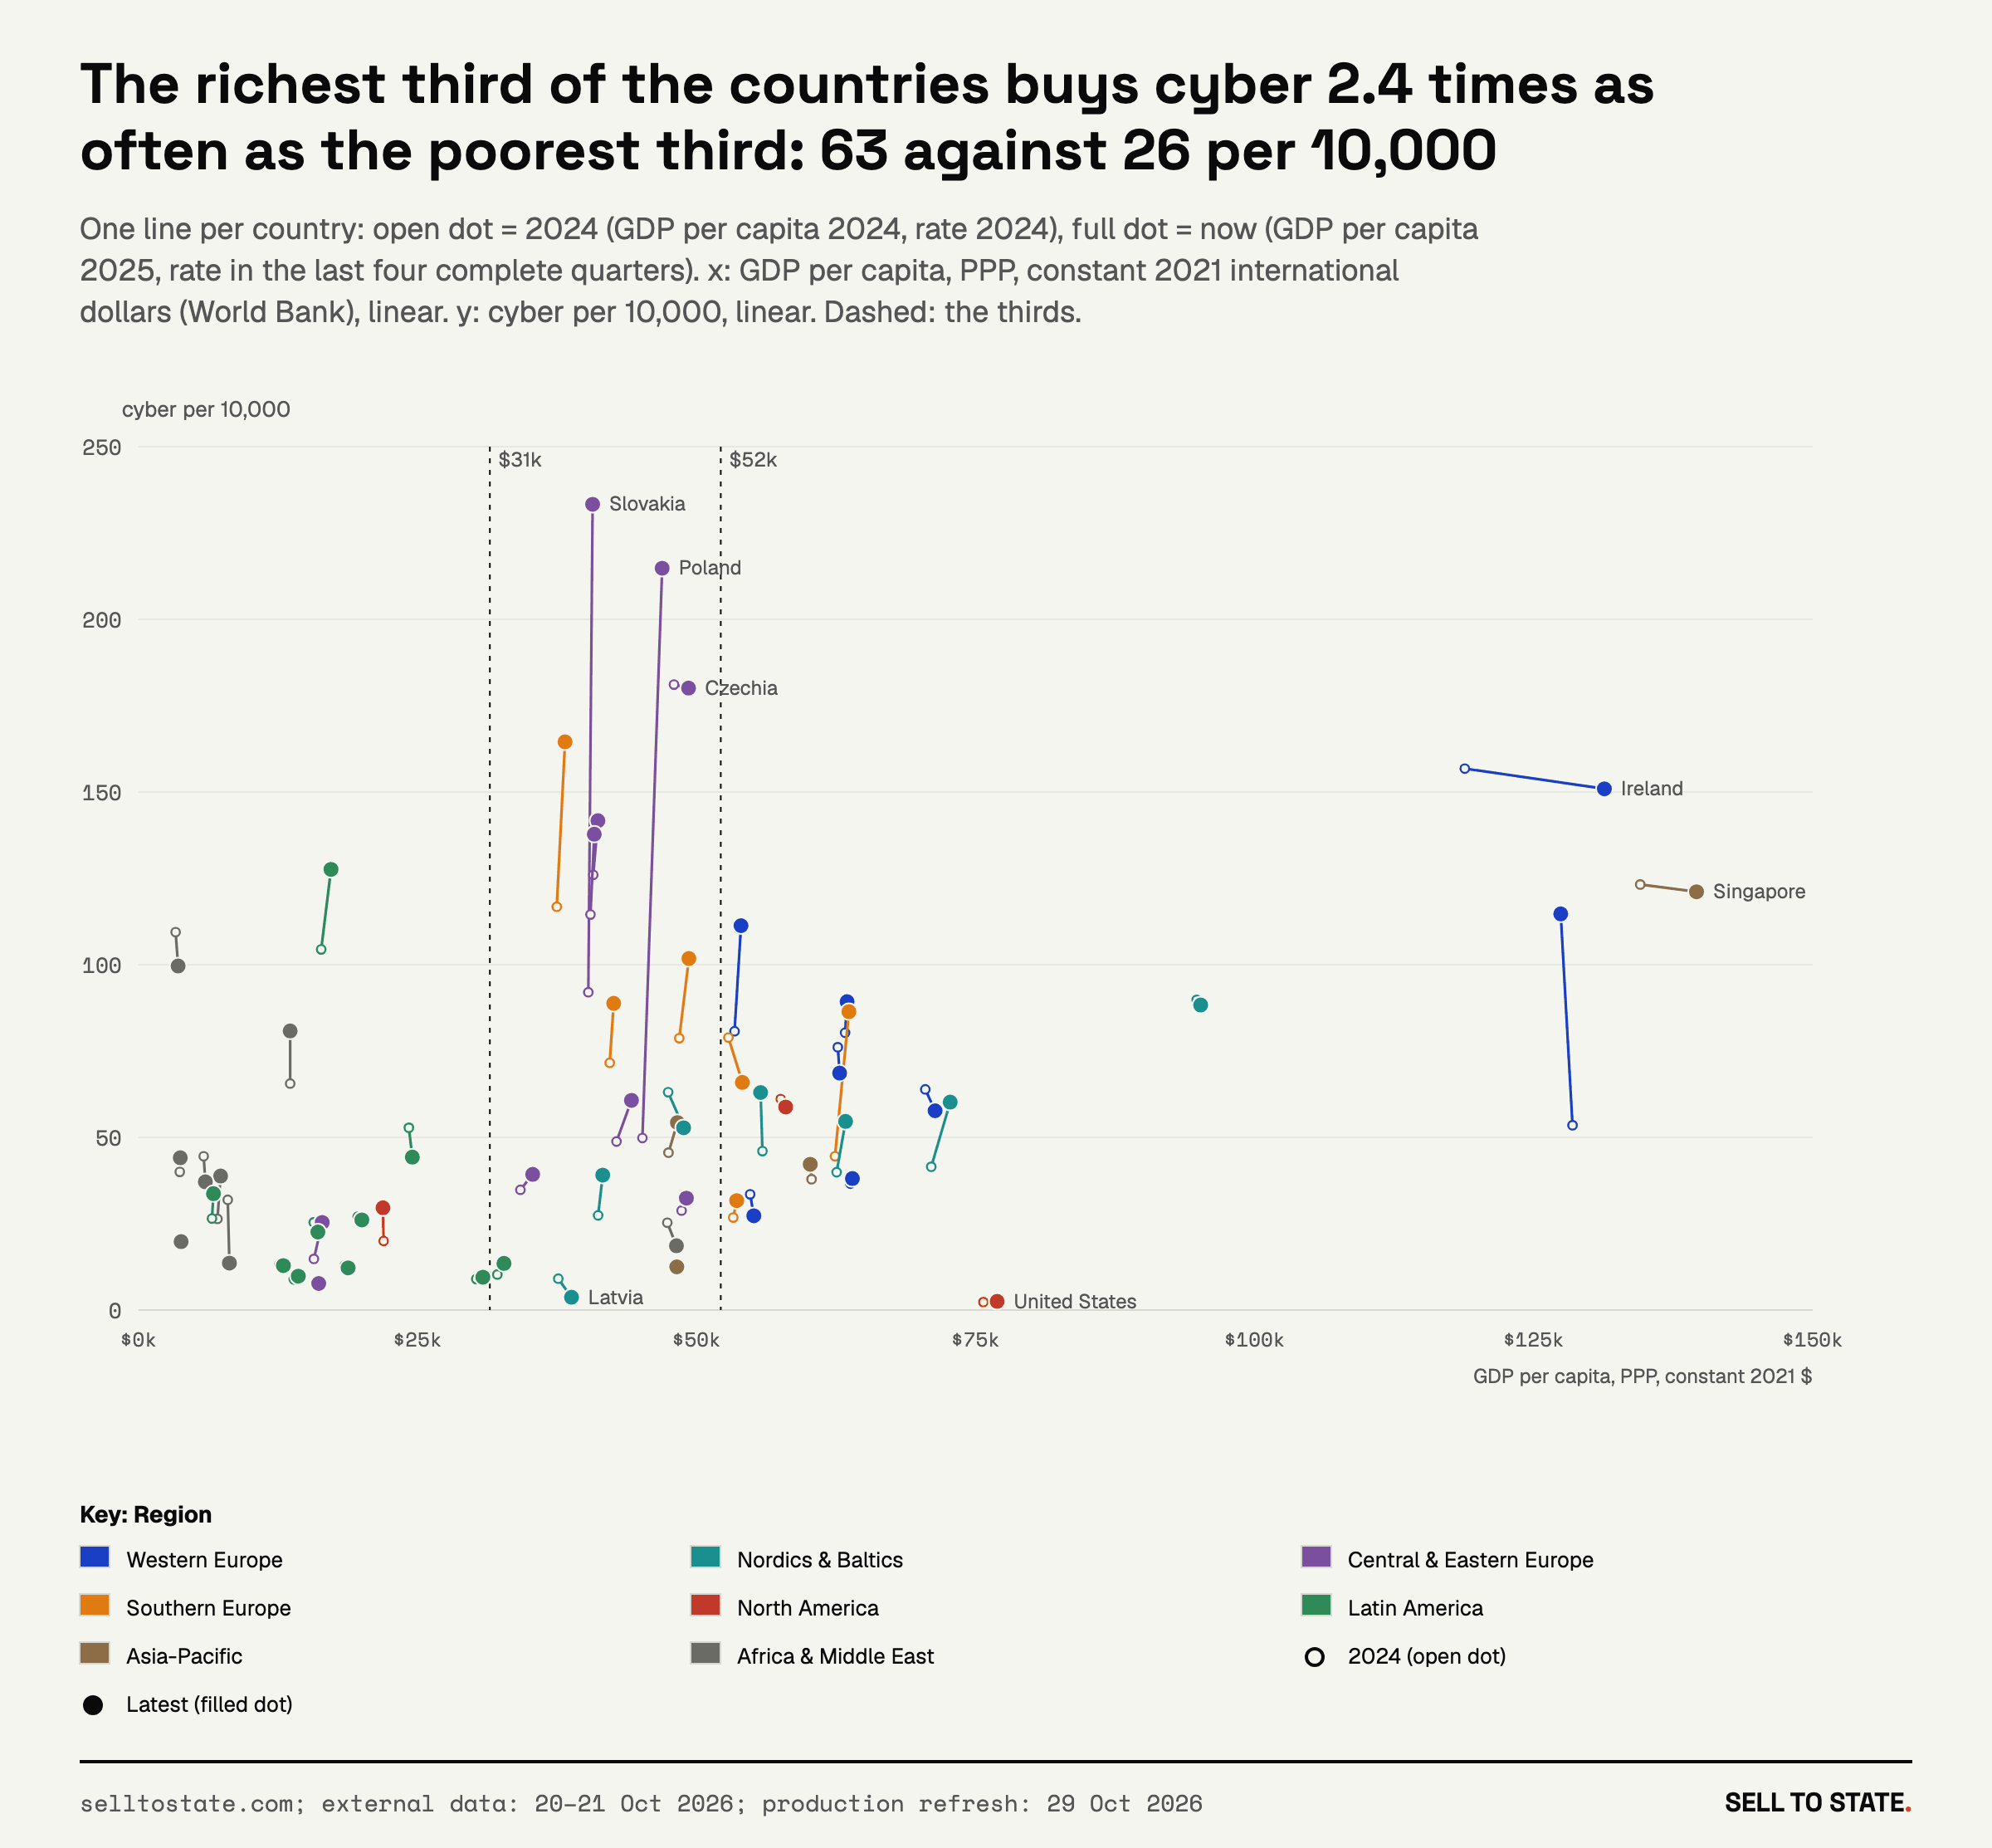
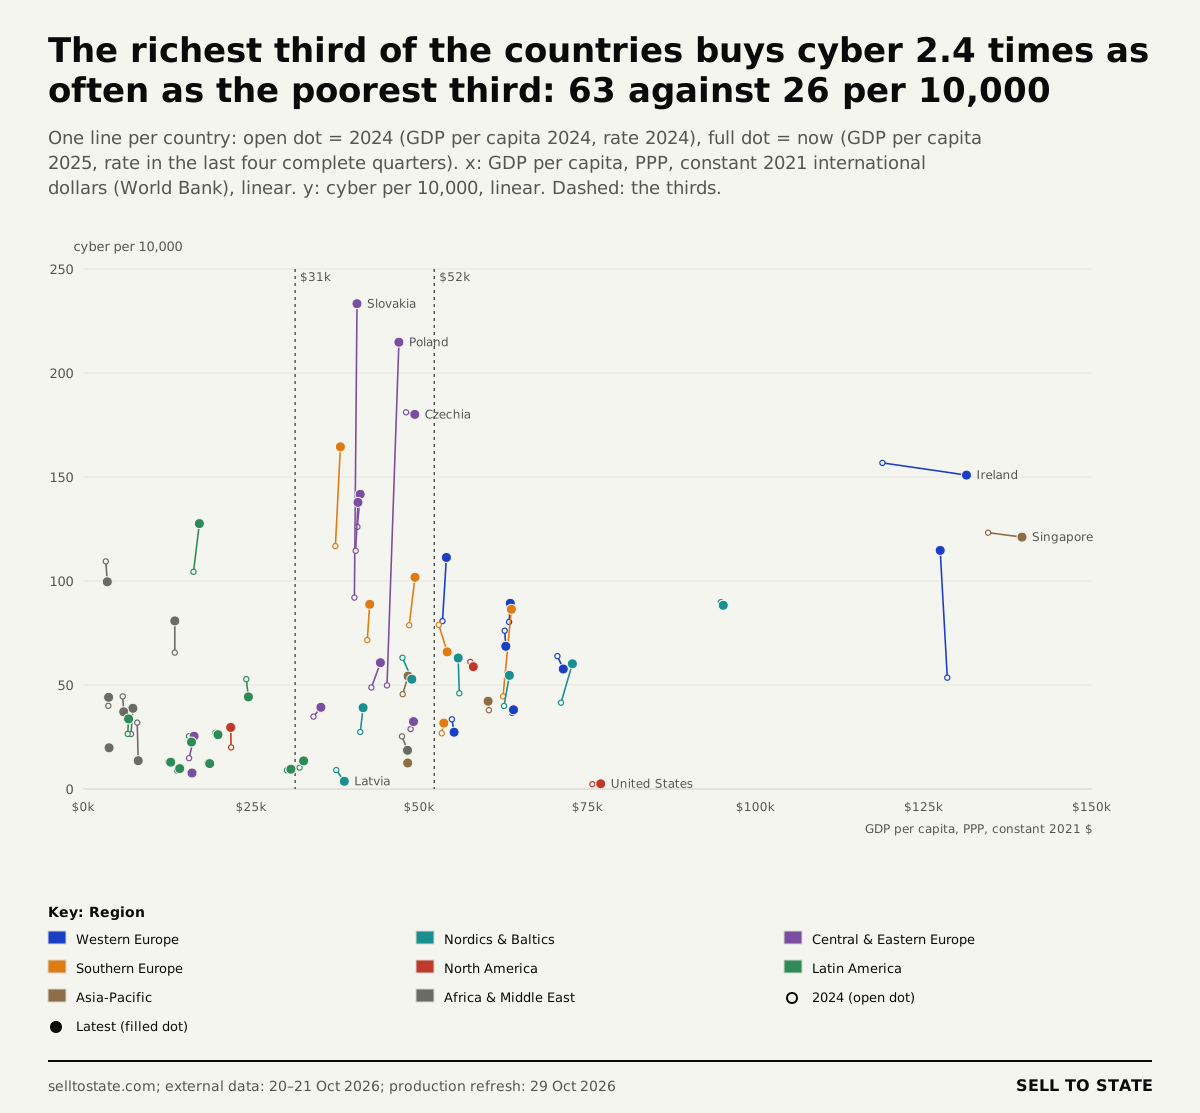
V11: The richest third of the countries buys cyber 2.4 times as often as the poorest third: 63 against 26 per 10,000. PNG · SVG
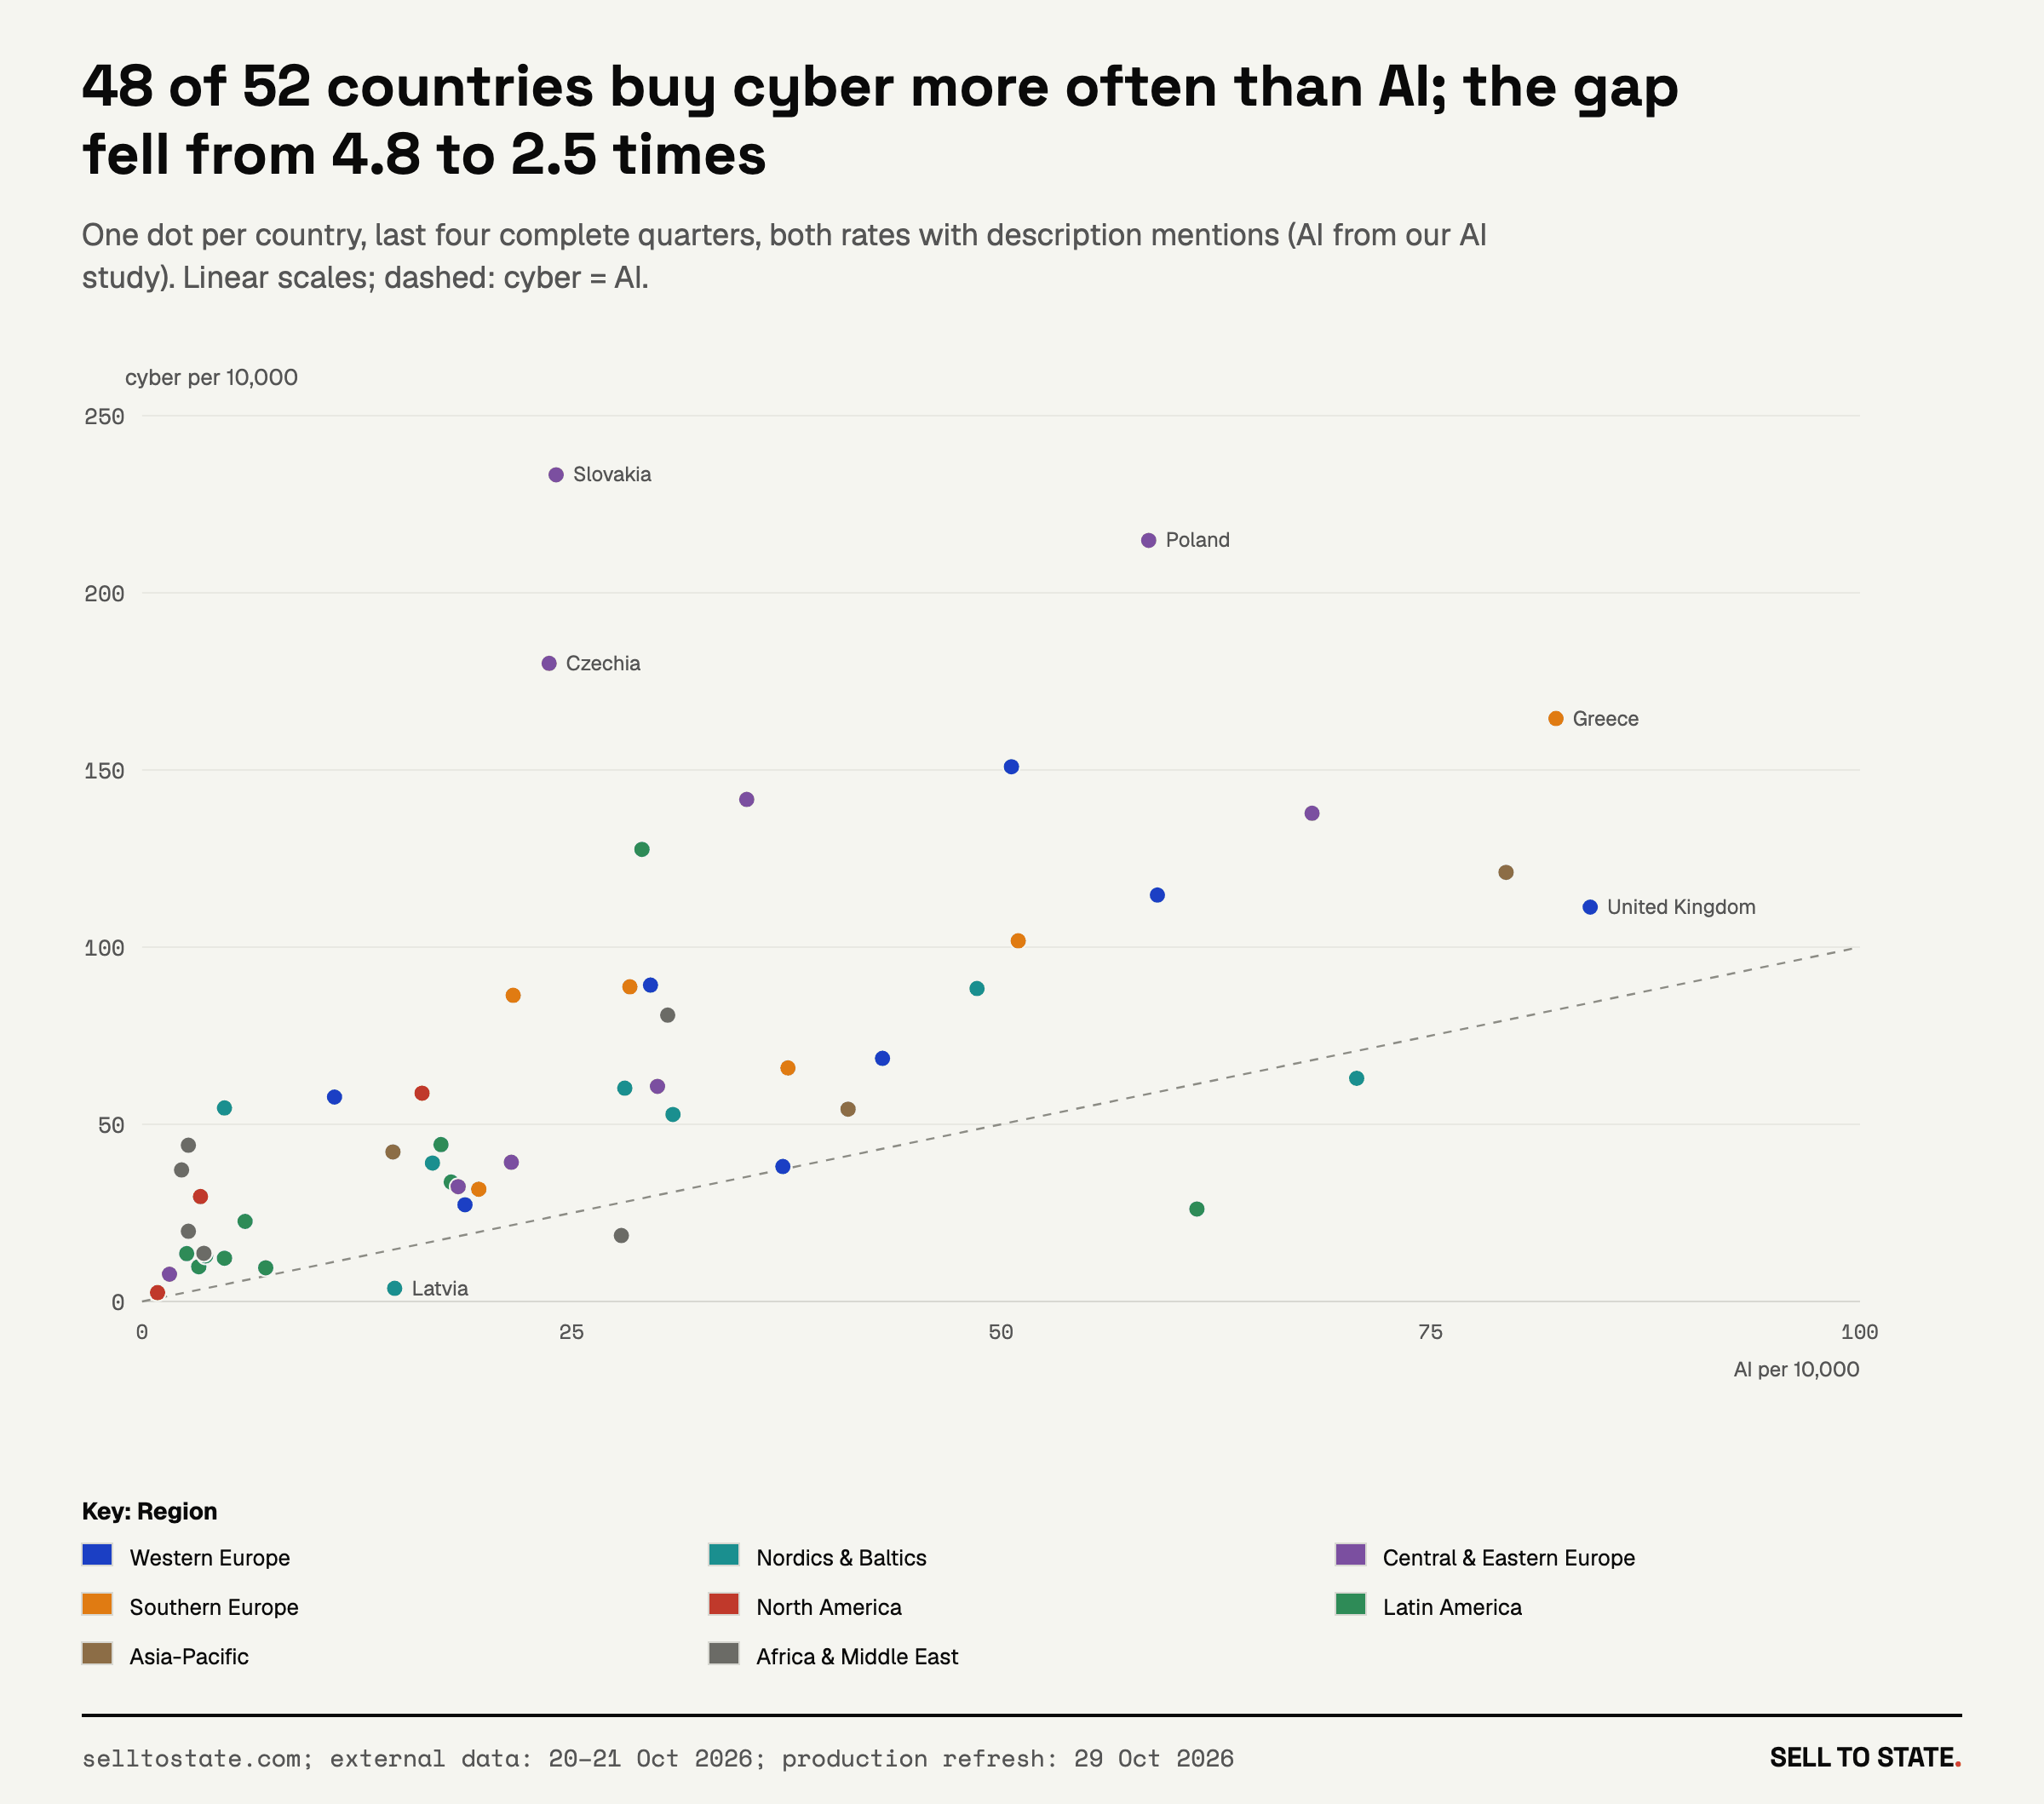
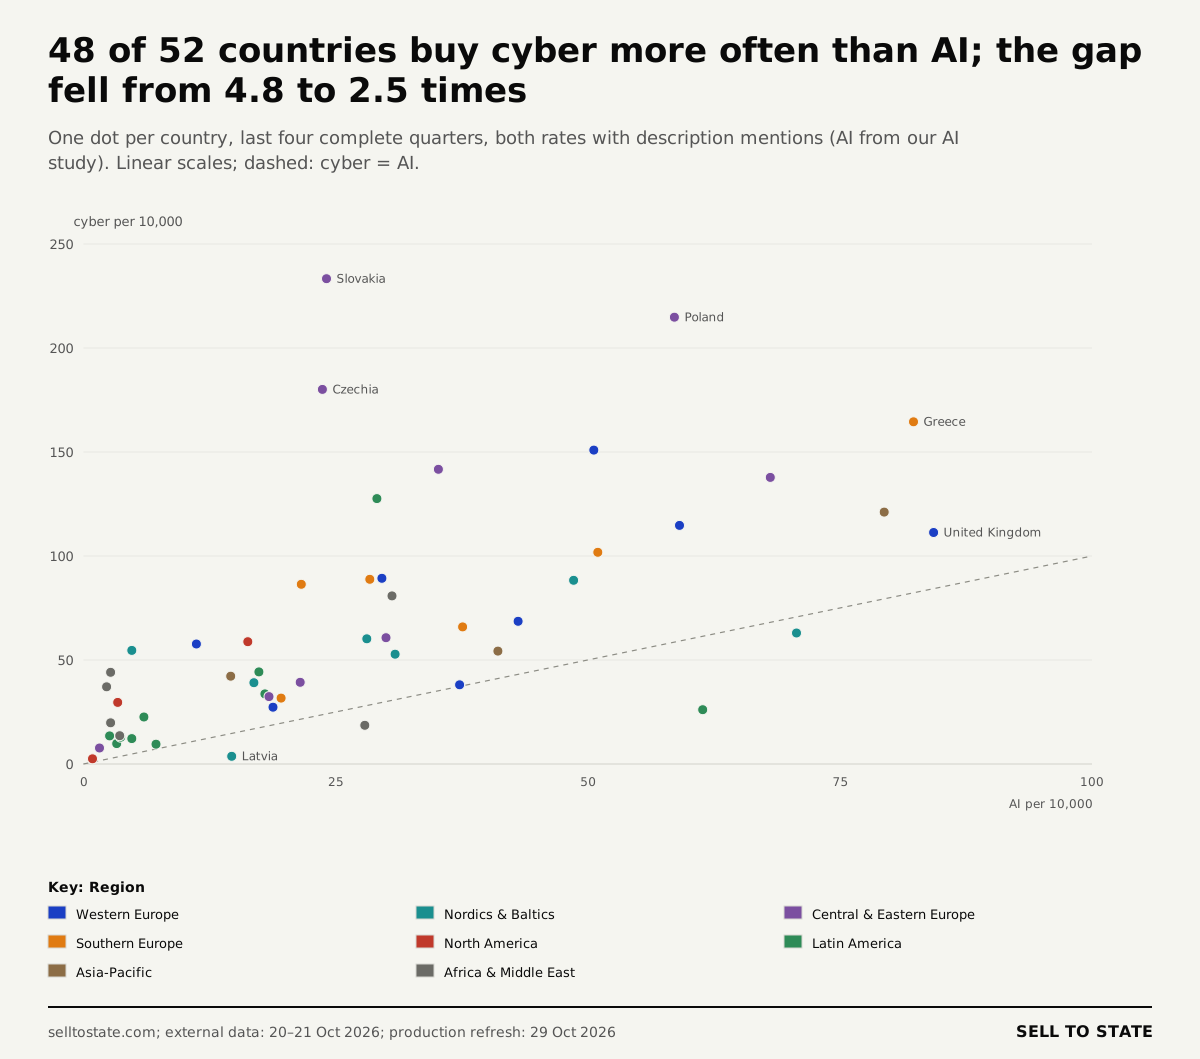
V12: 48 of 52 countries buy cyber more often than AI; the gap fell from 4.8 to 2.5 times. PNG · SVG
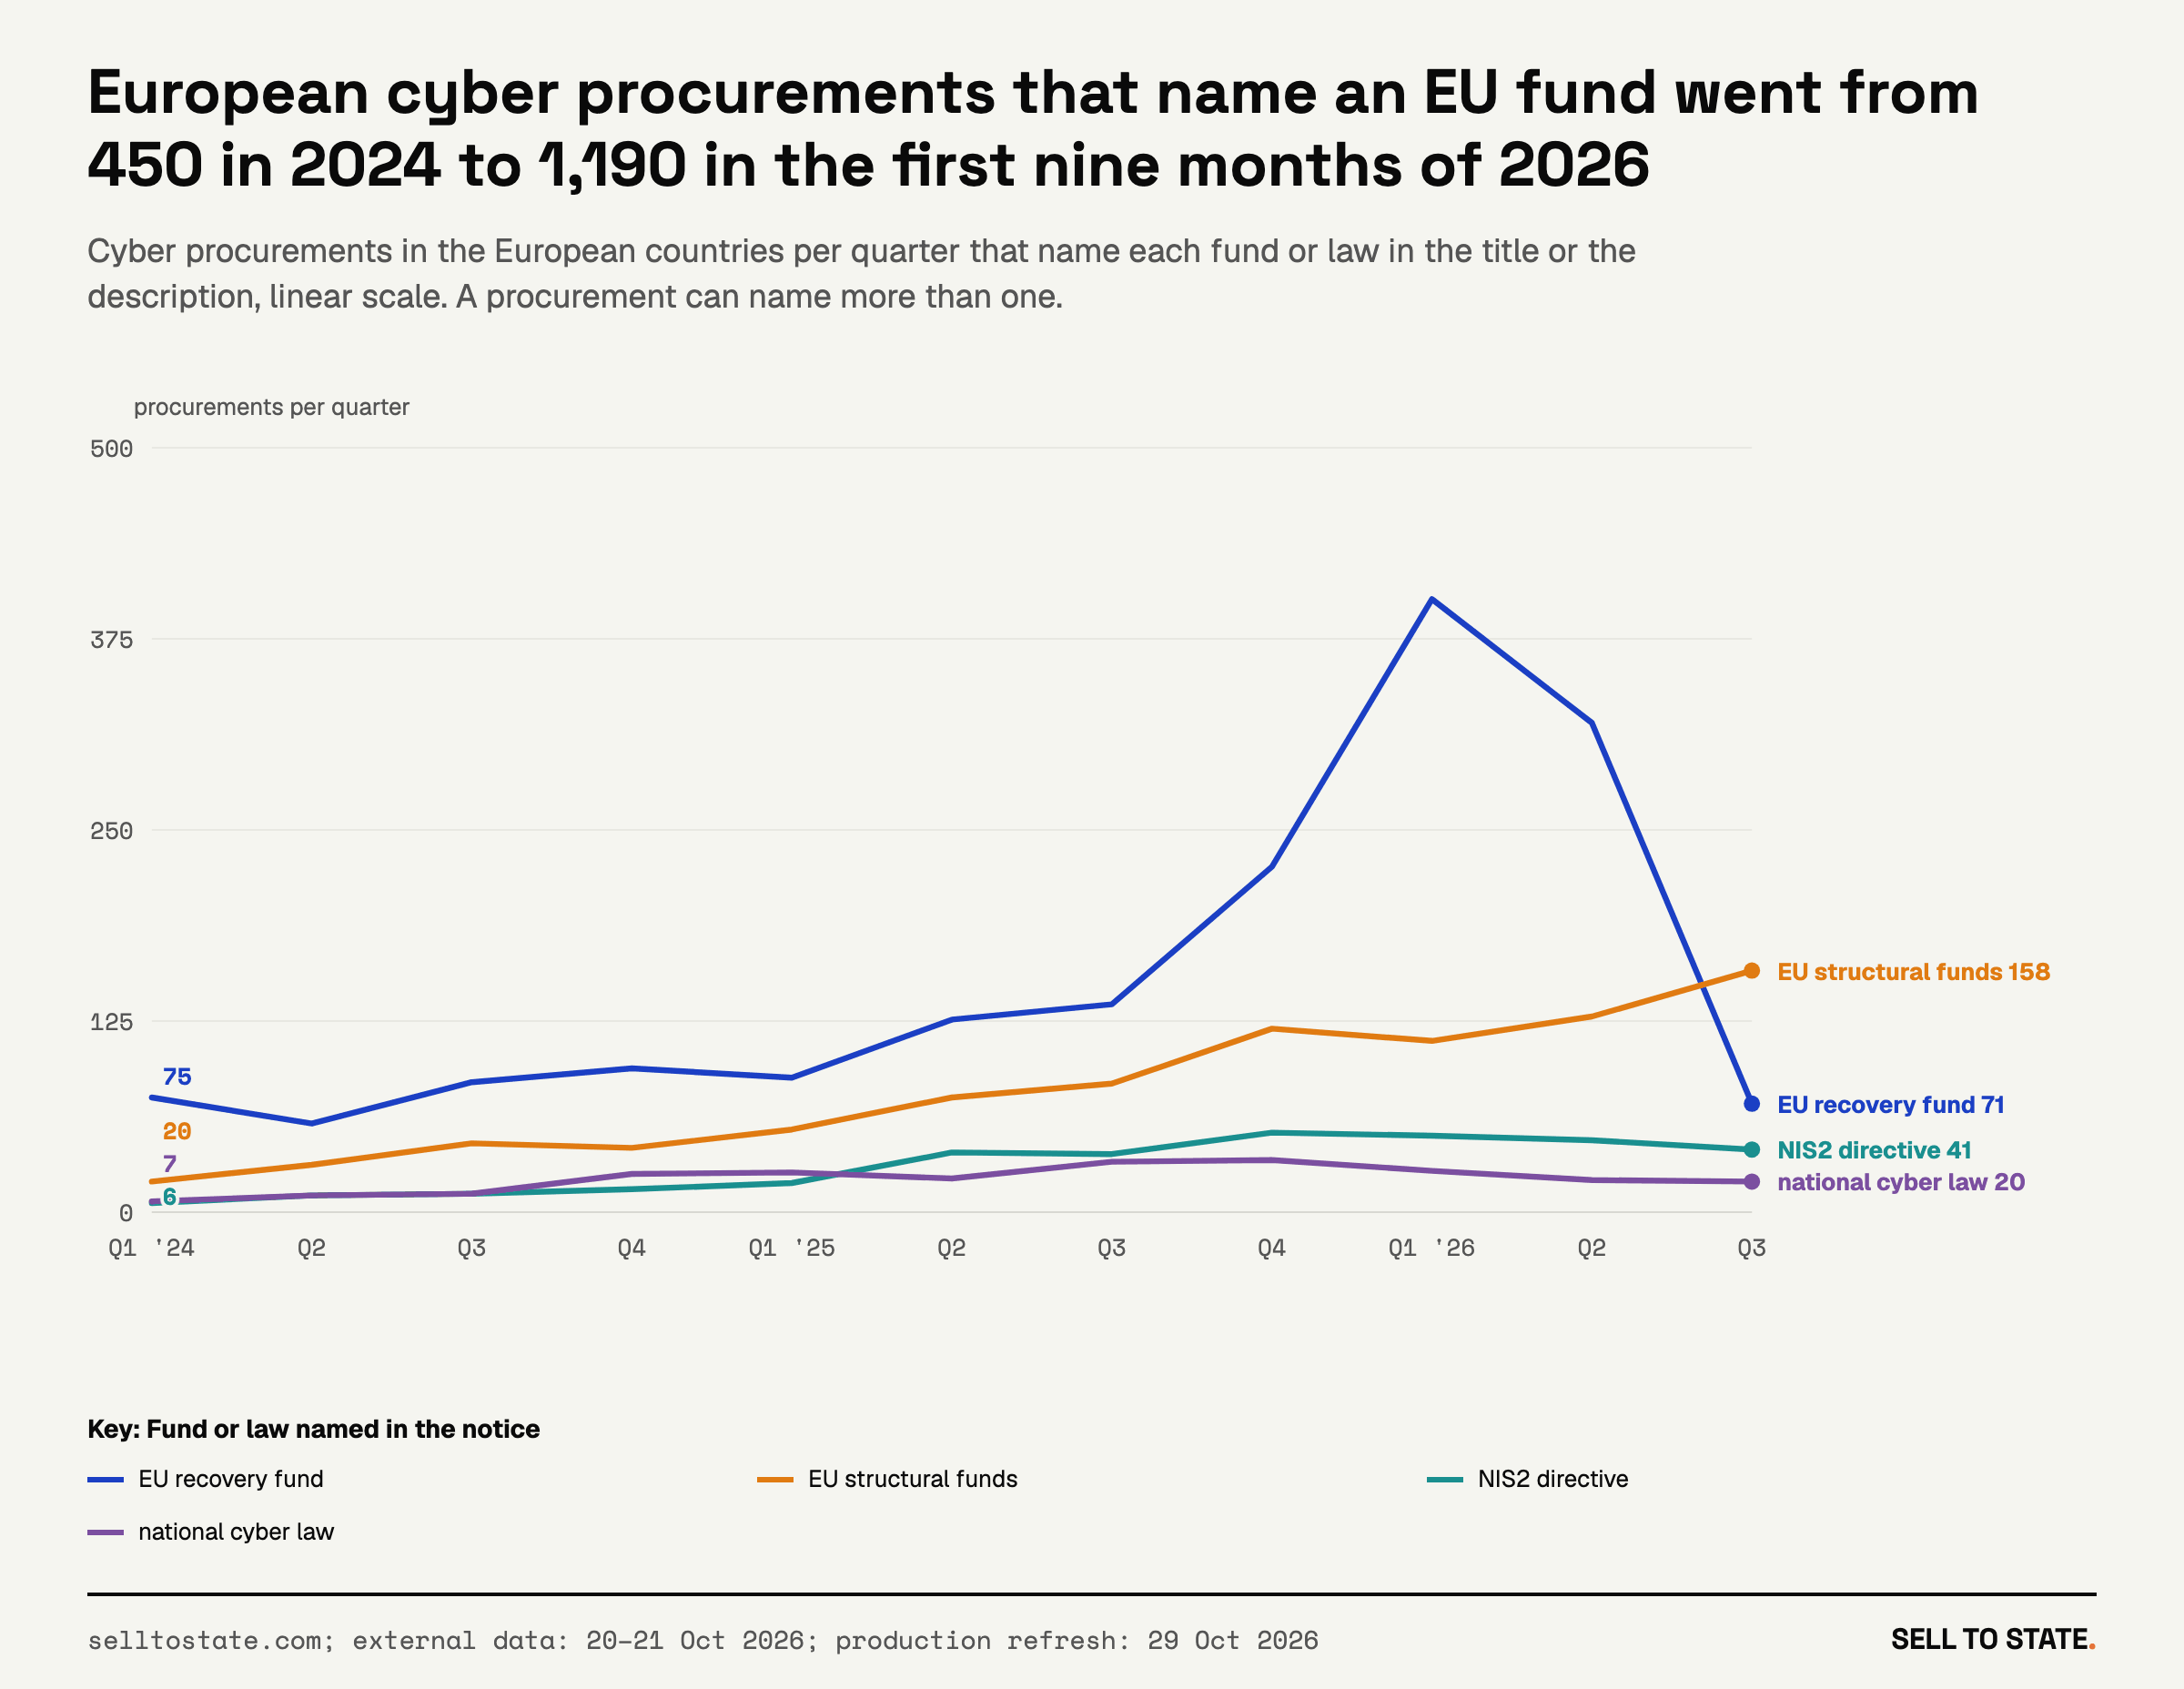
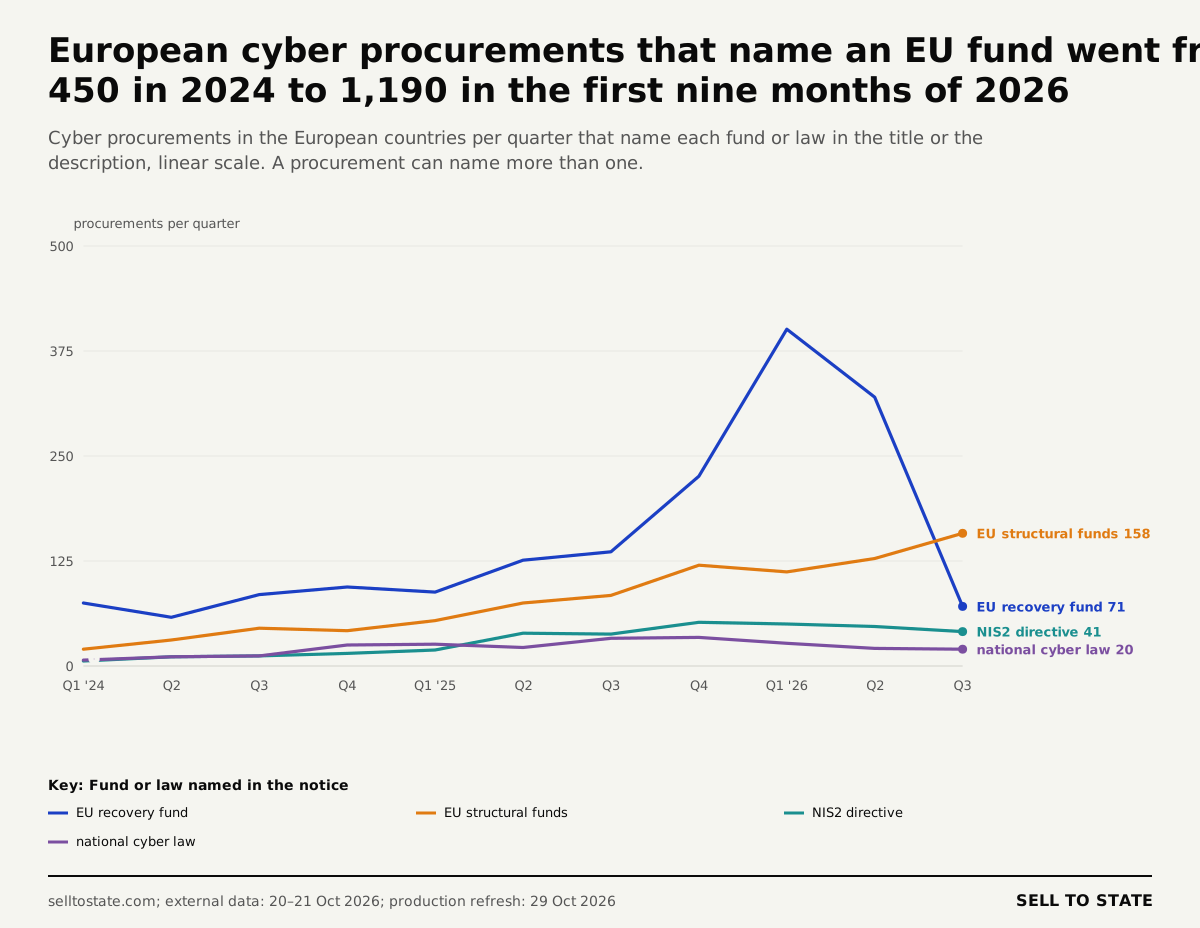
V13: European cyber procurements that name an EU fund went from 450 in 2024 to 1,190 in the first nine months of 2026. PNG · SVG
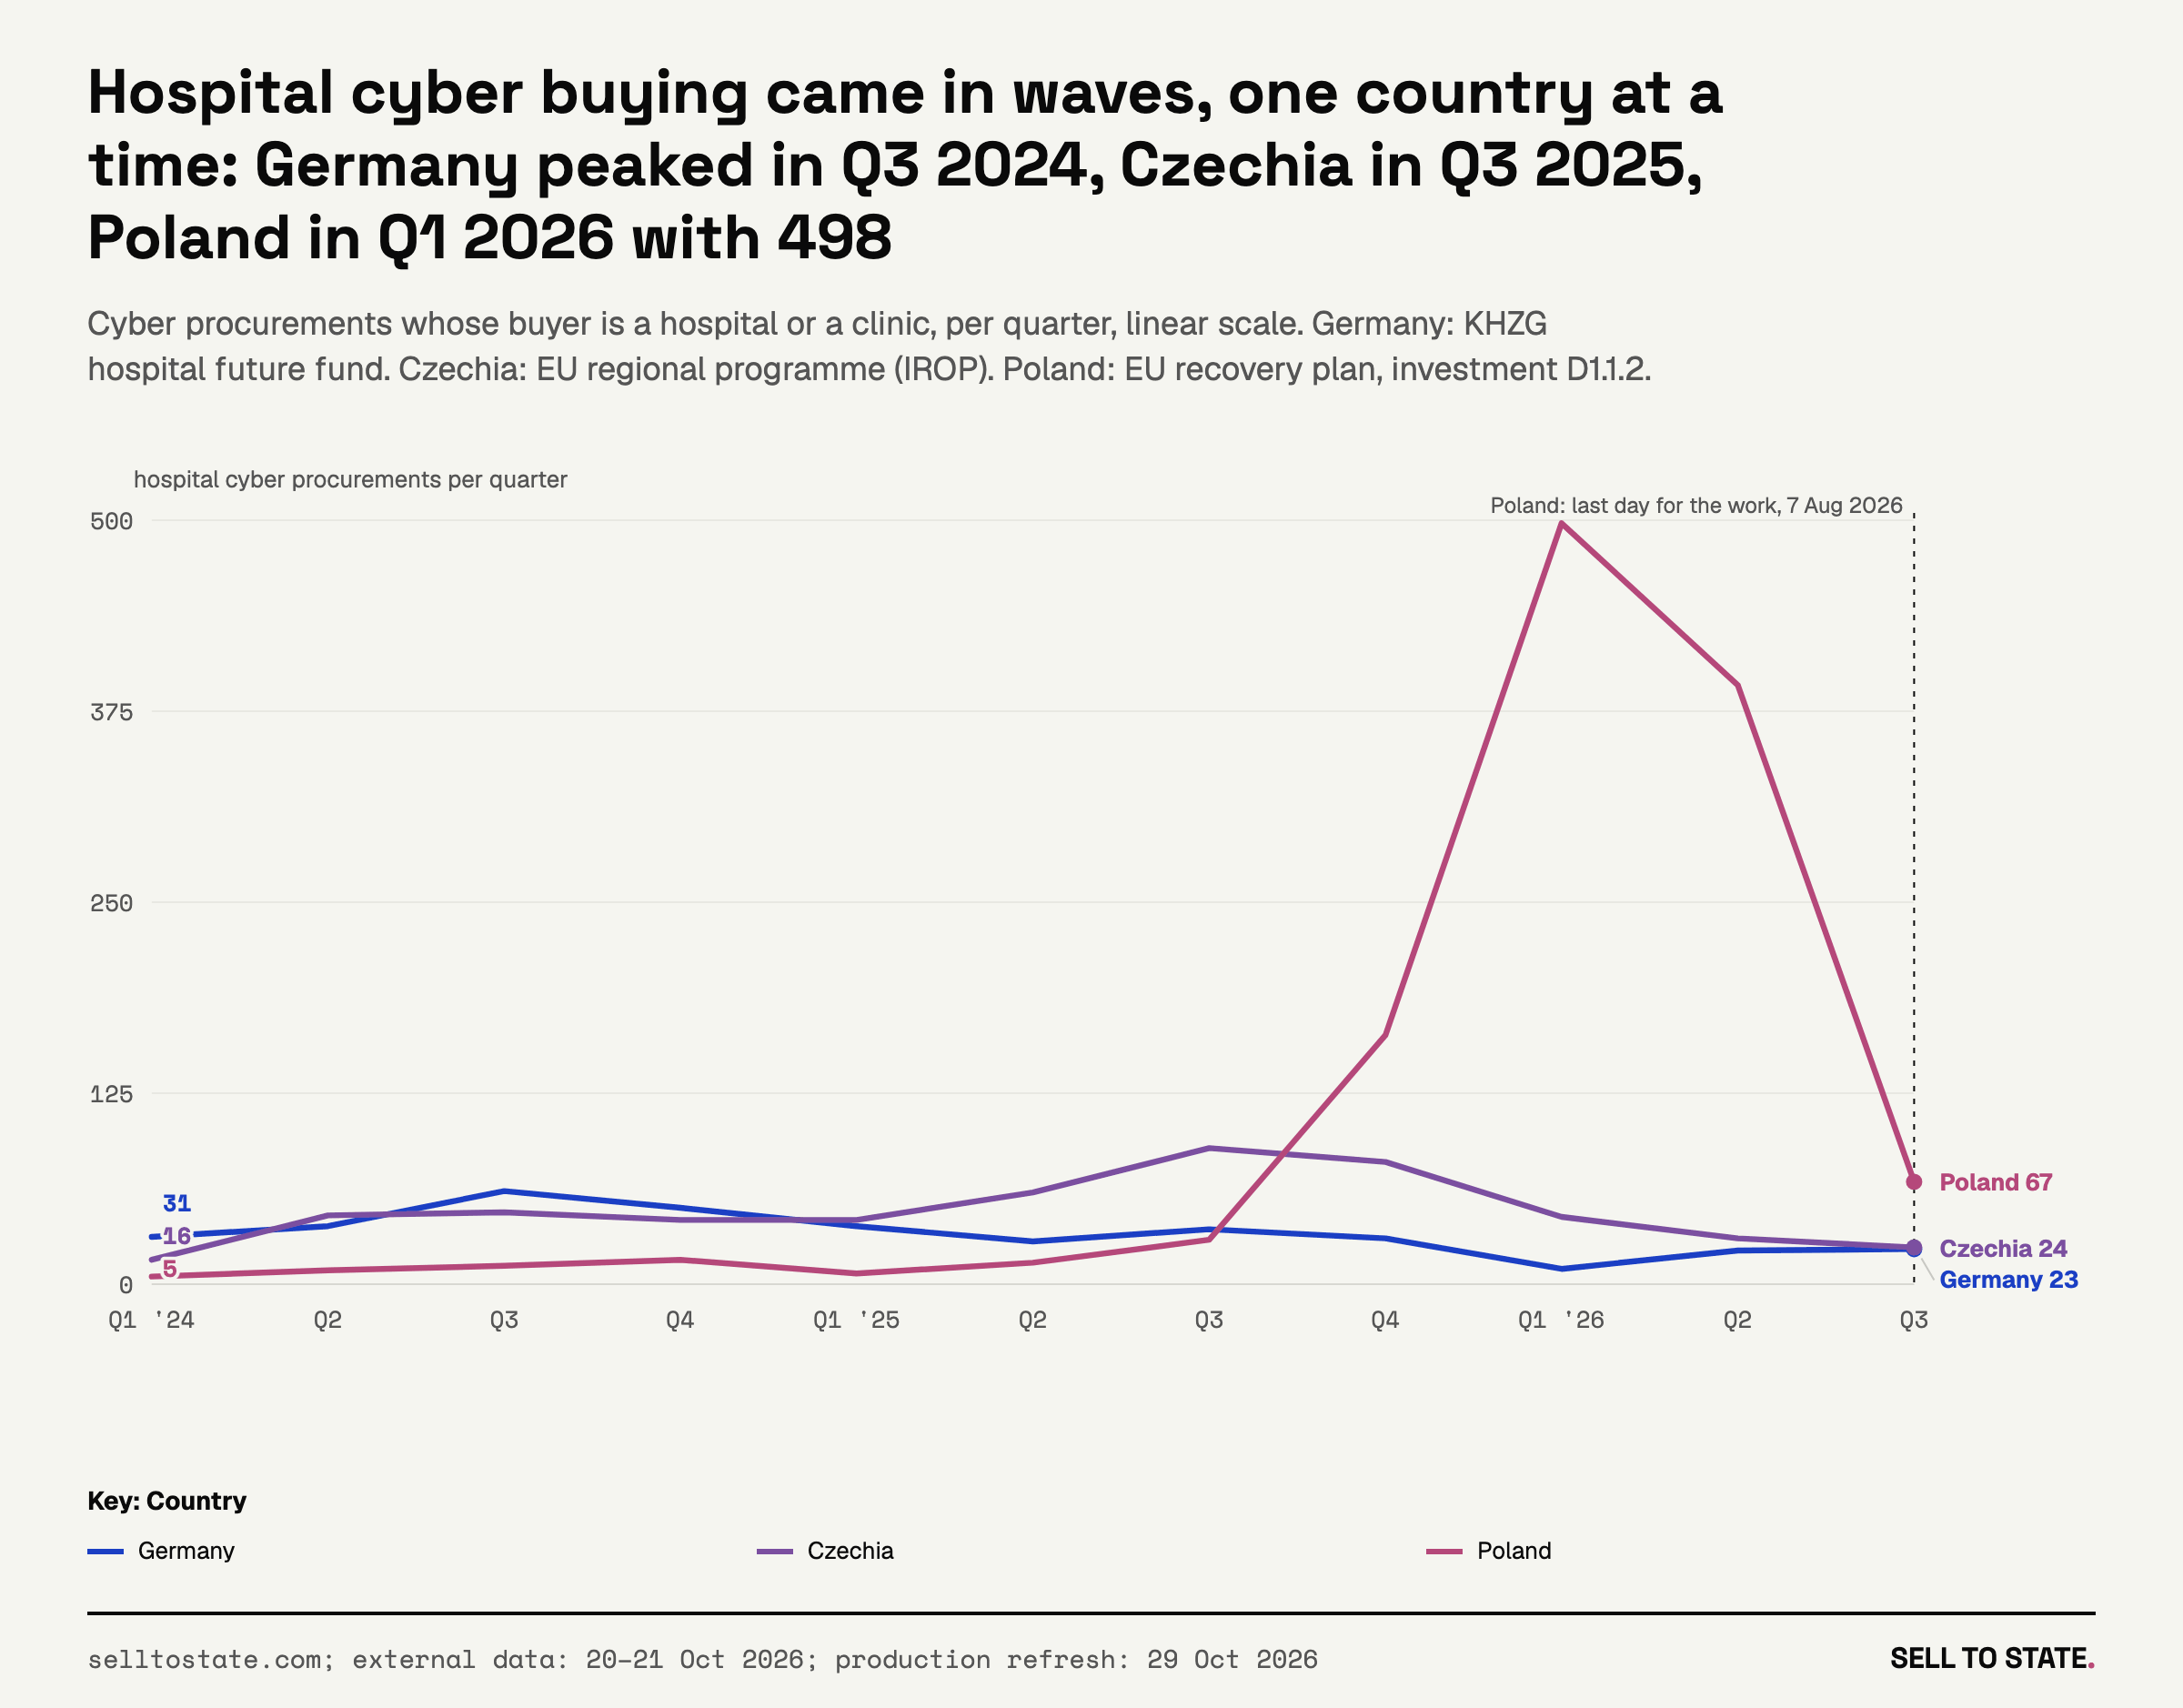
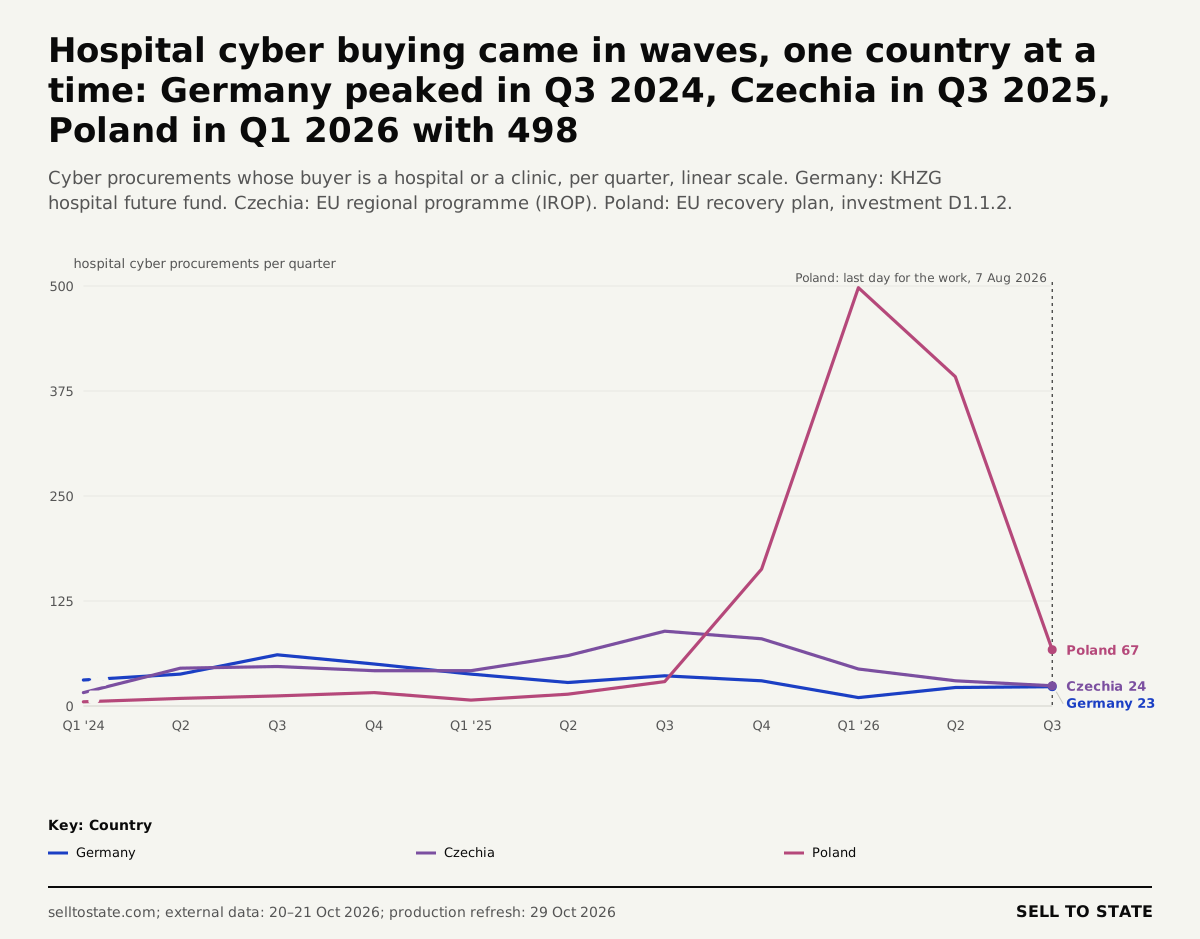
V14: Hospital cyber buying came in waves, one country at a time: Germany peaked in Q3 2024, Czechia in Q3 2025, Poland in Q1 2026 with 498. PNG · SVG
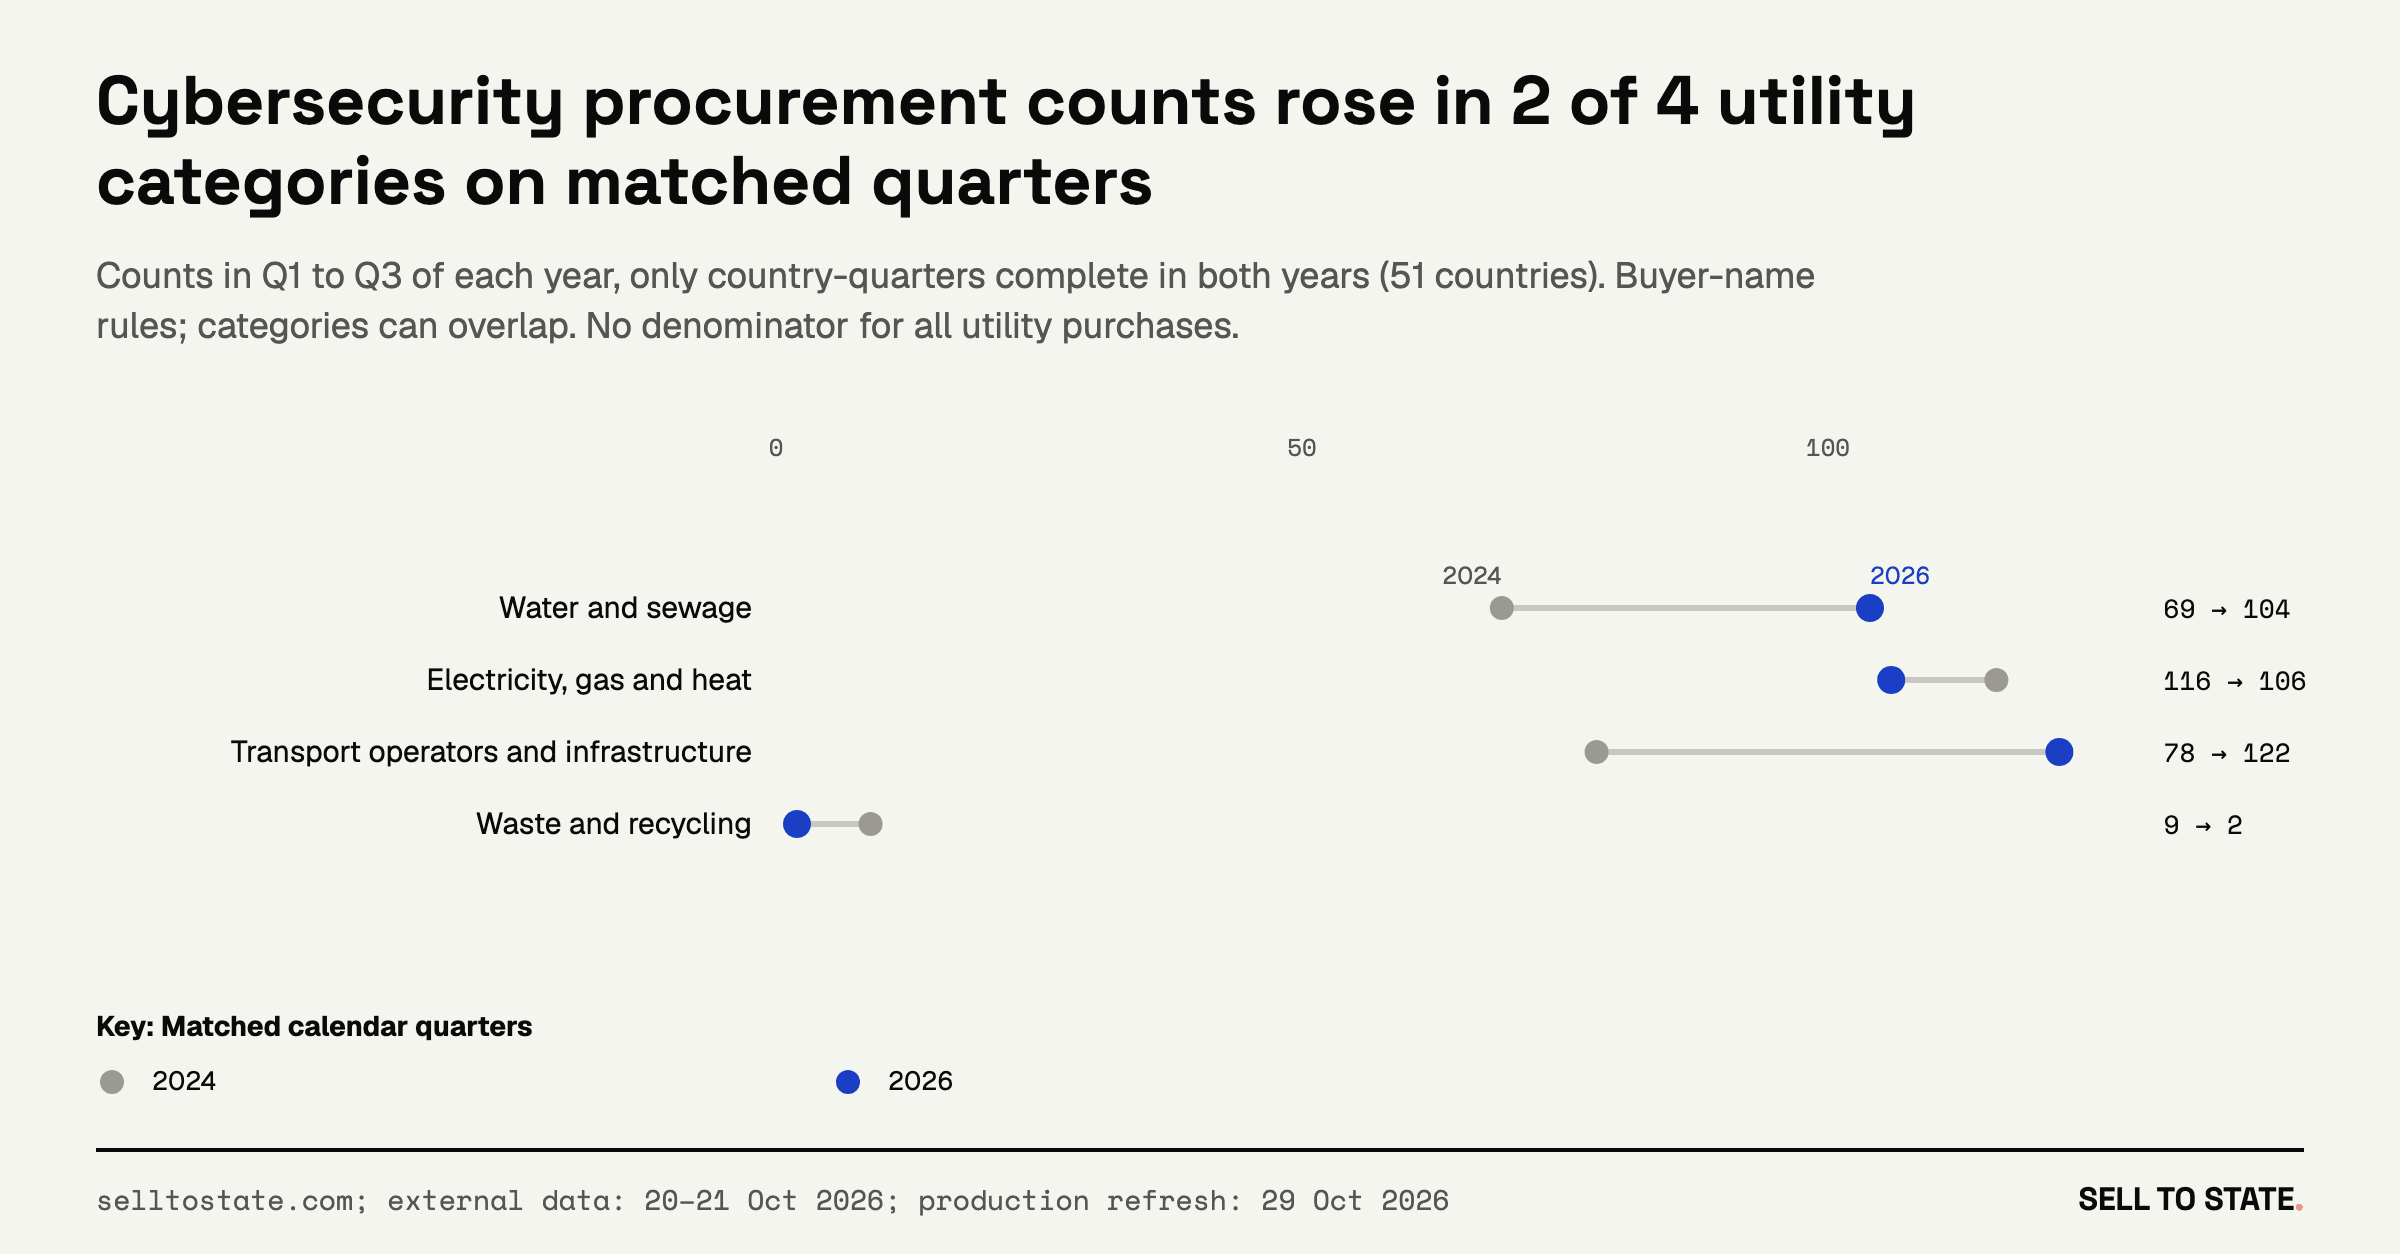
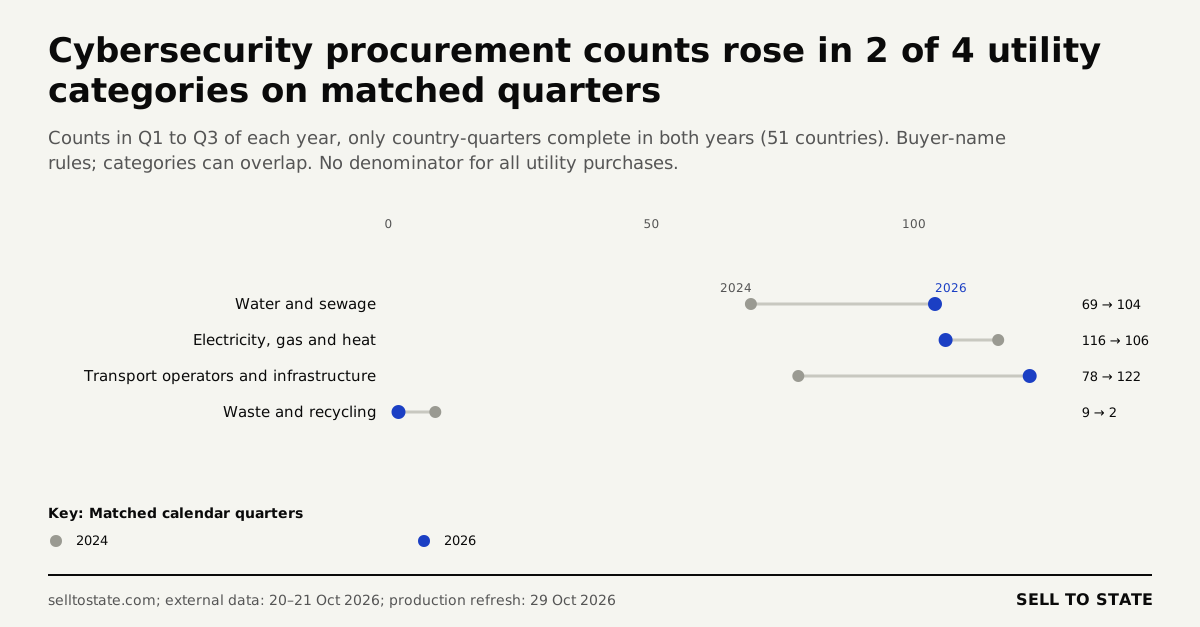
V15: Cybersecurity procurement counts rose in 2 of 4 utility categories on matched quarters. PNG · SVG
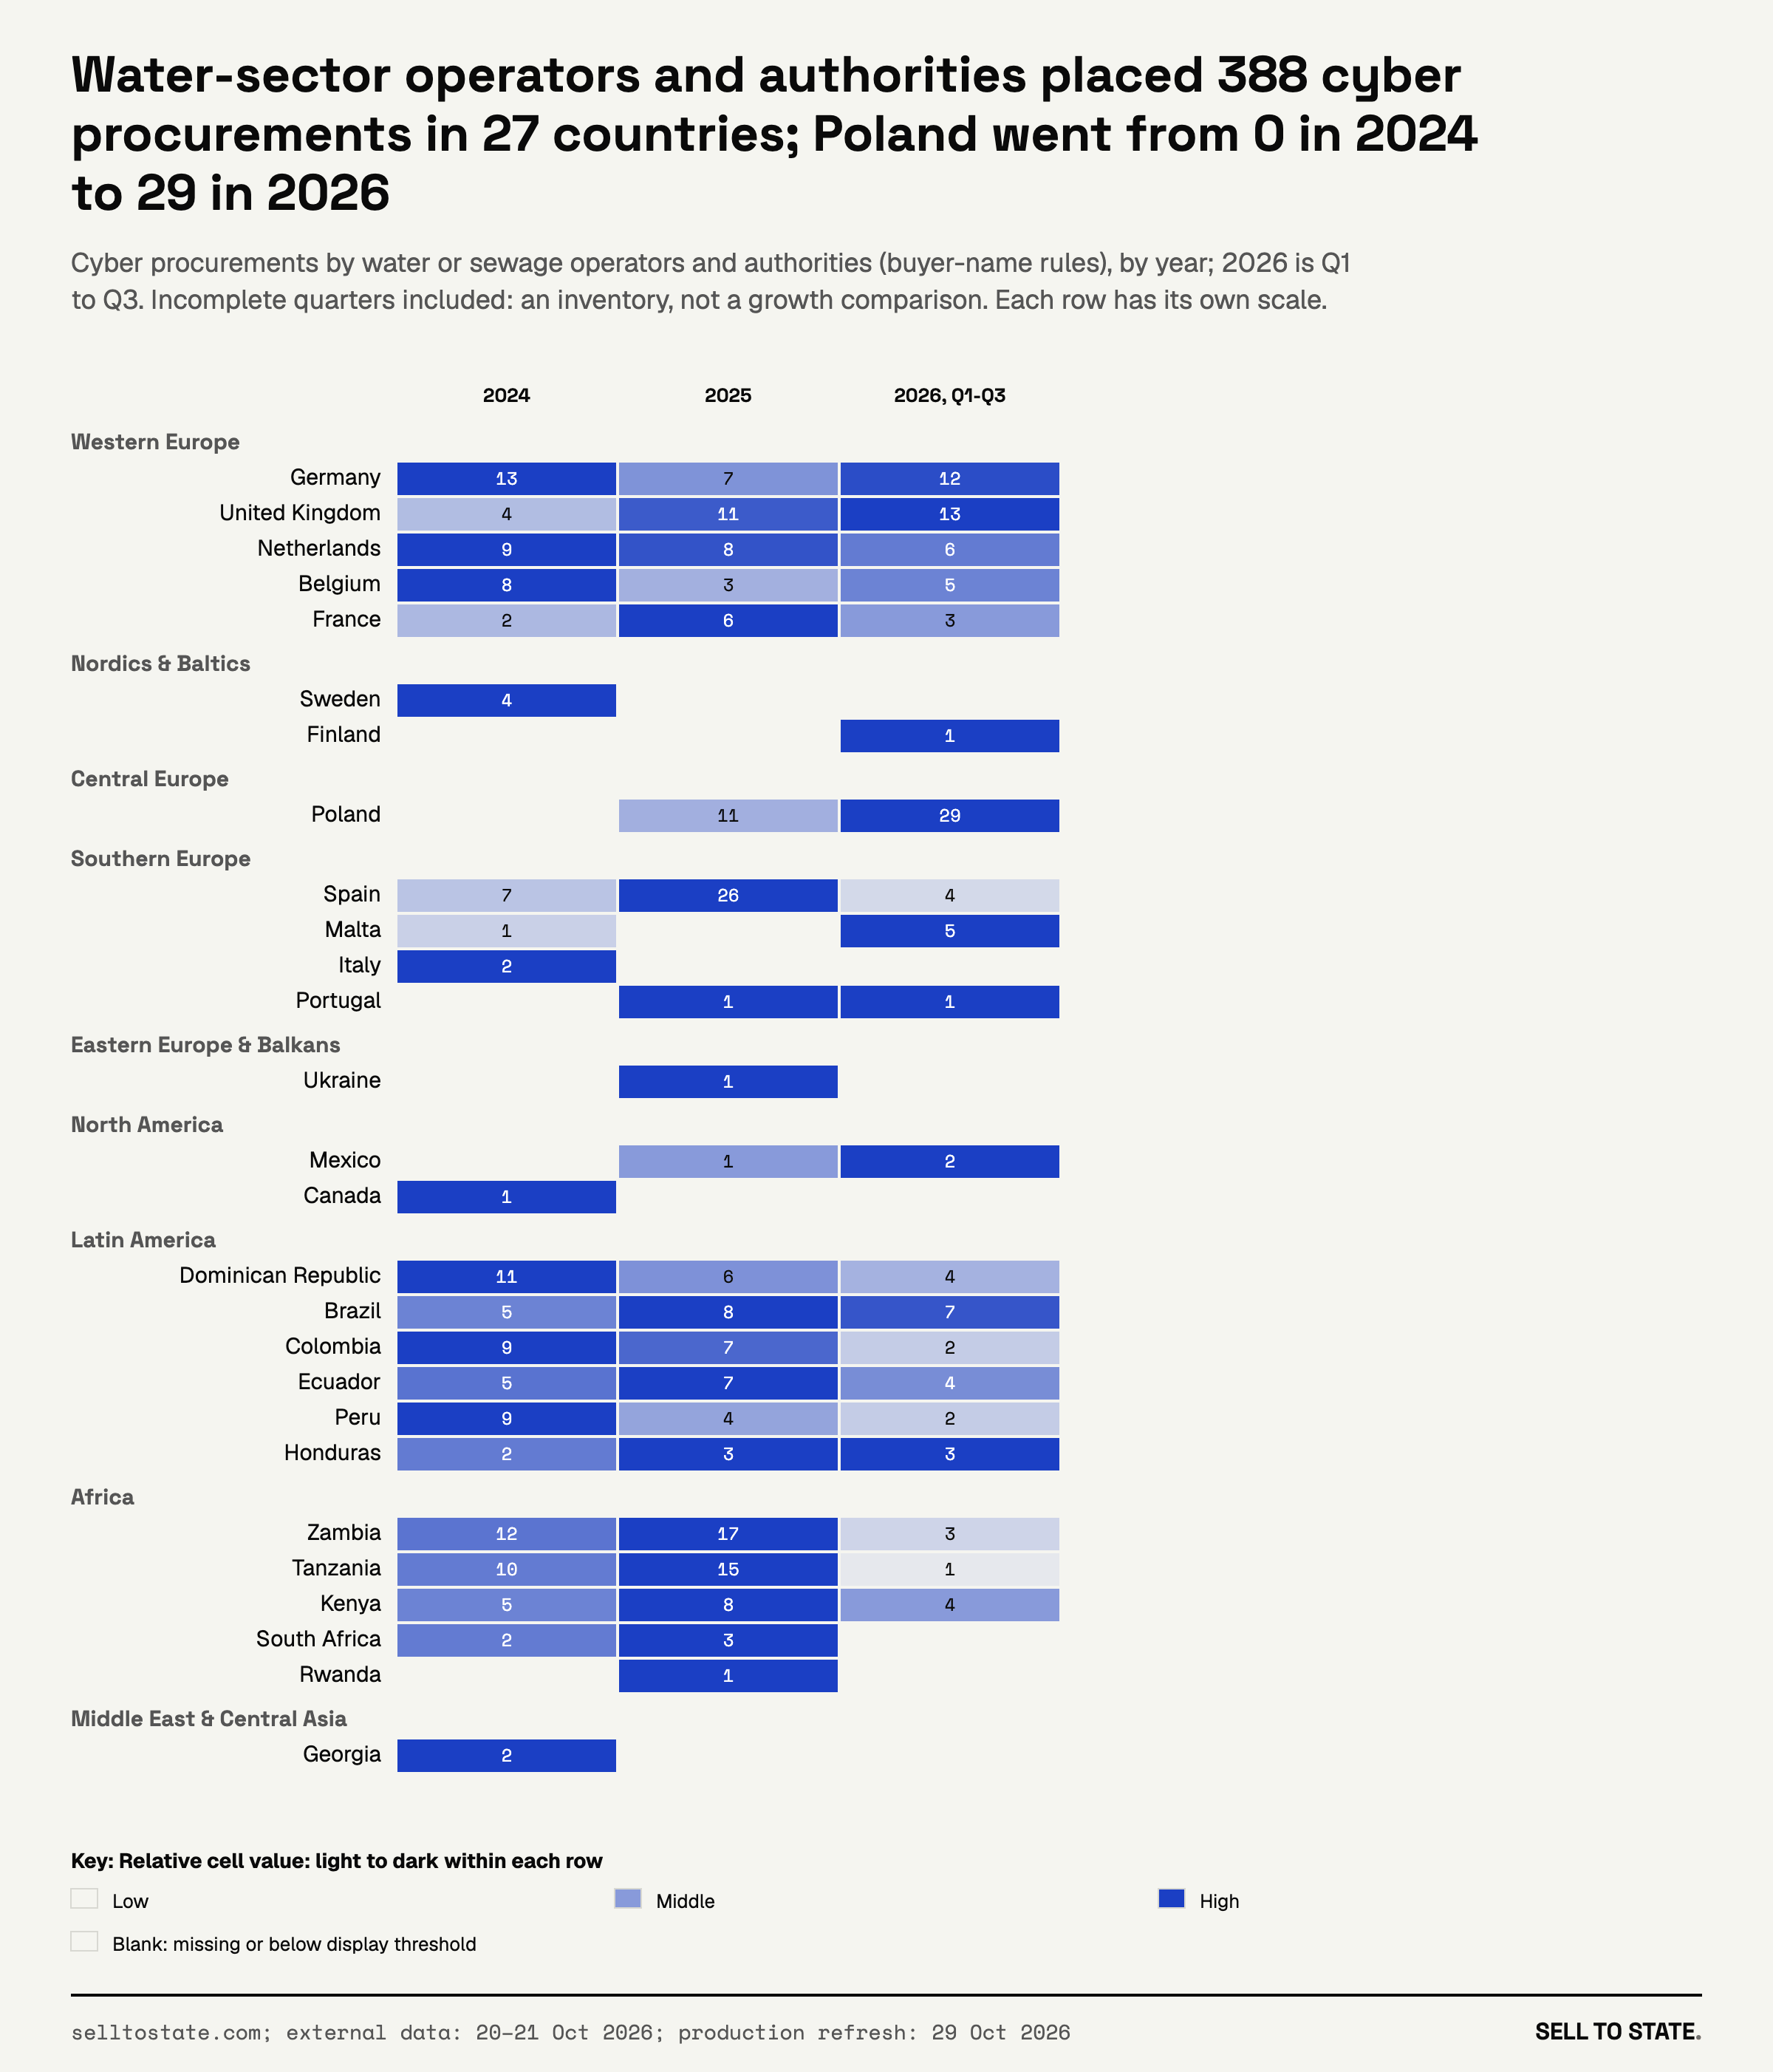
V16: Water-sector operators and authorities placed 388 cyber procurements in 27 countries; Poland went from 0 in 2024 to 29 in 2026. PNG · SVG
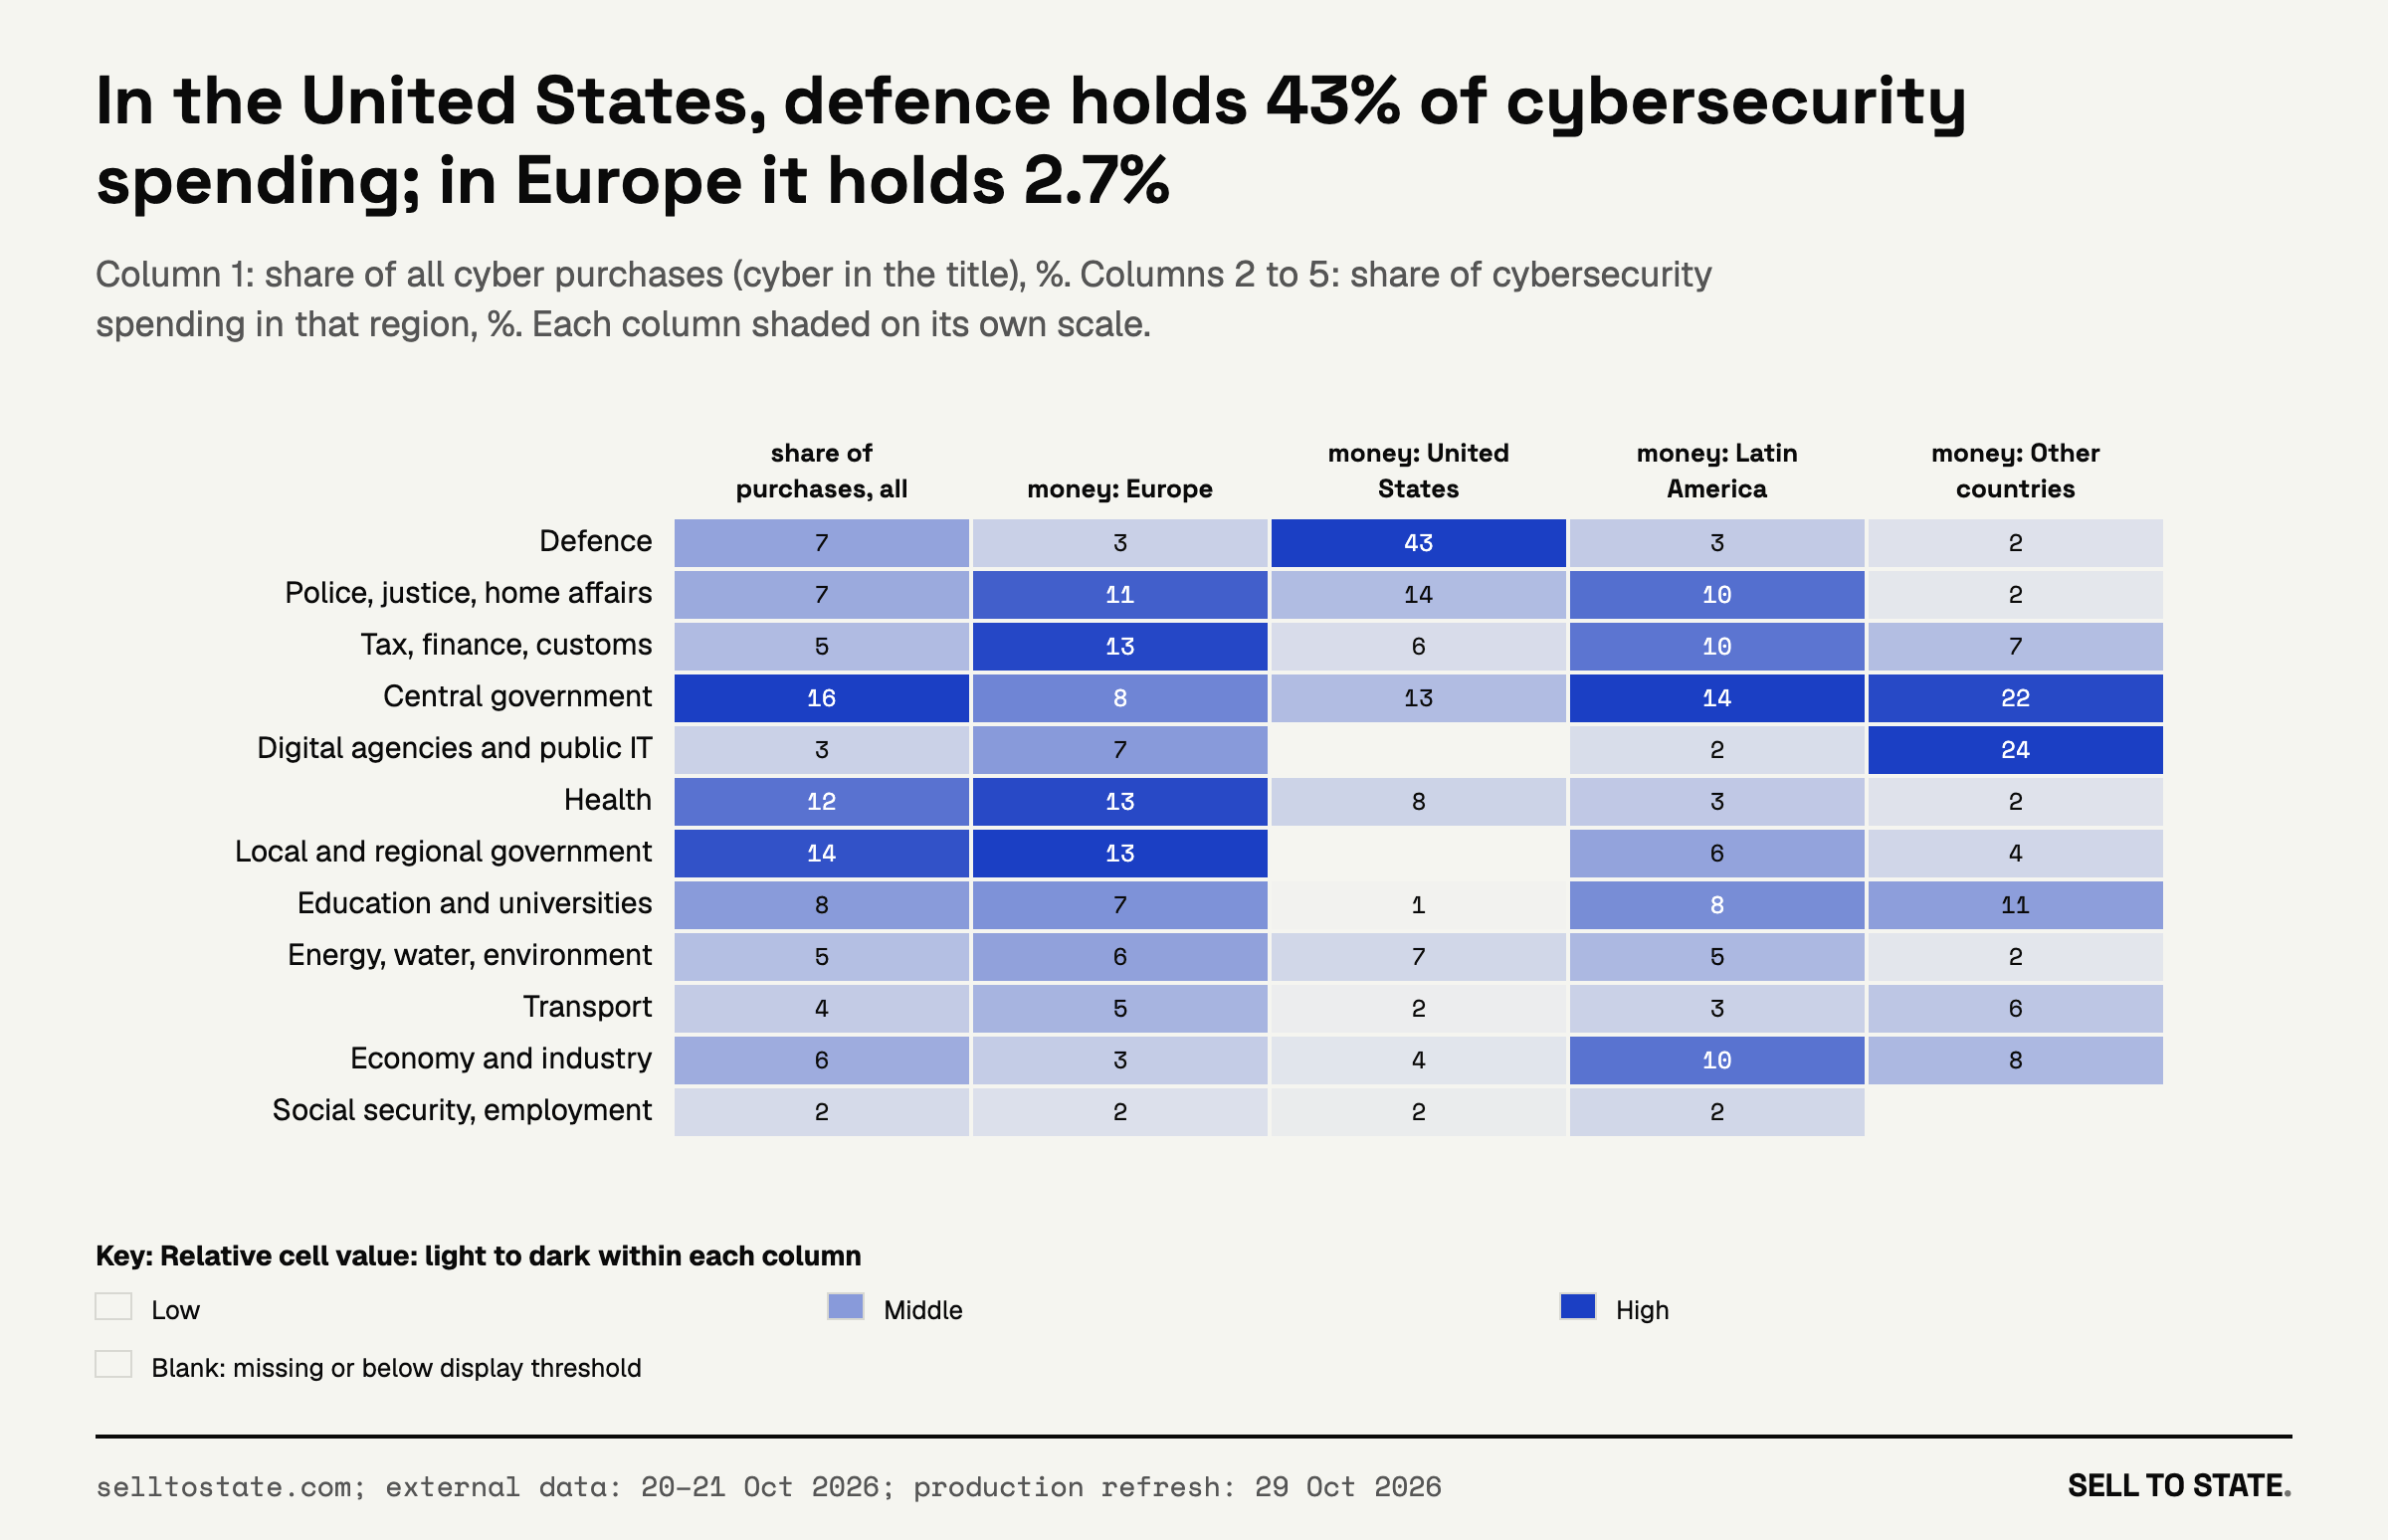
V17: In the United States, defence holds 43% of cybersecurity spending; in Europe it holds 2.7%. PNG · SVG
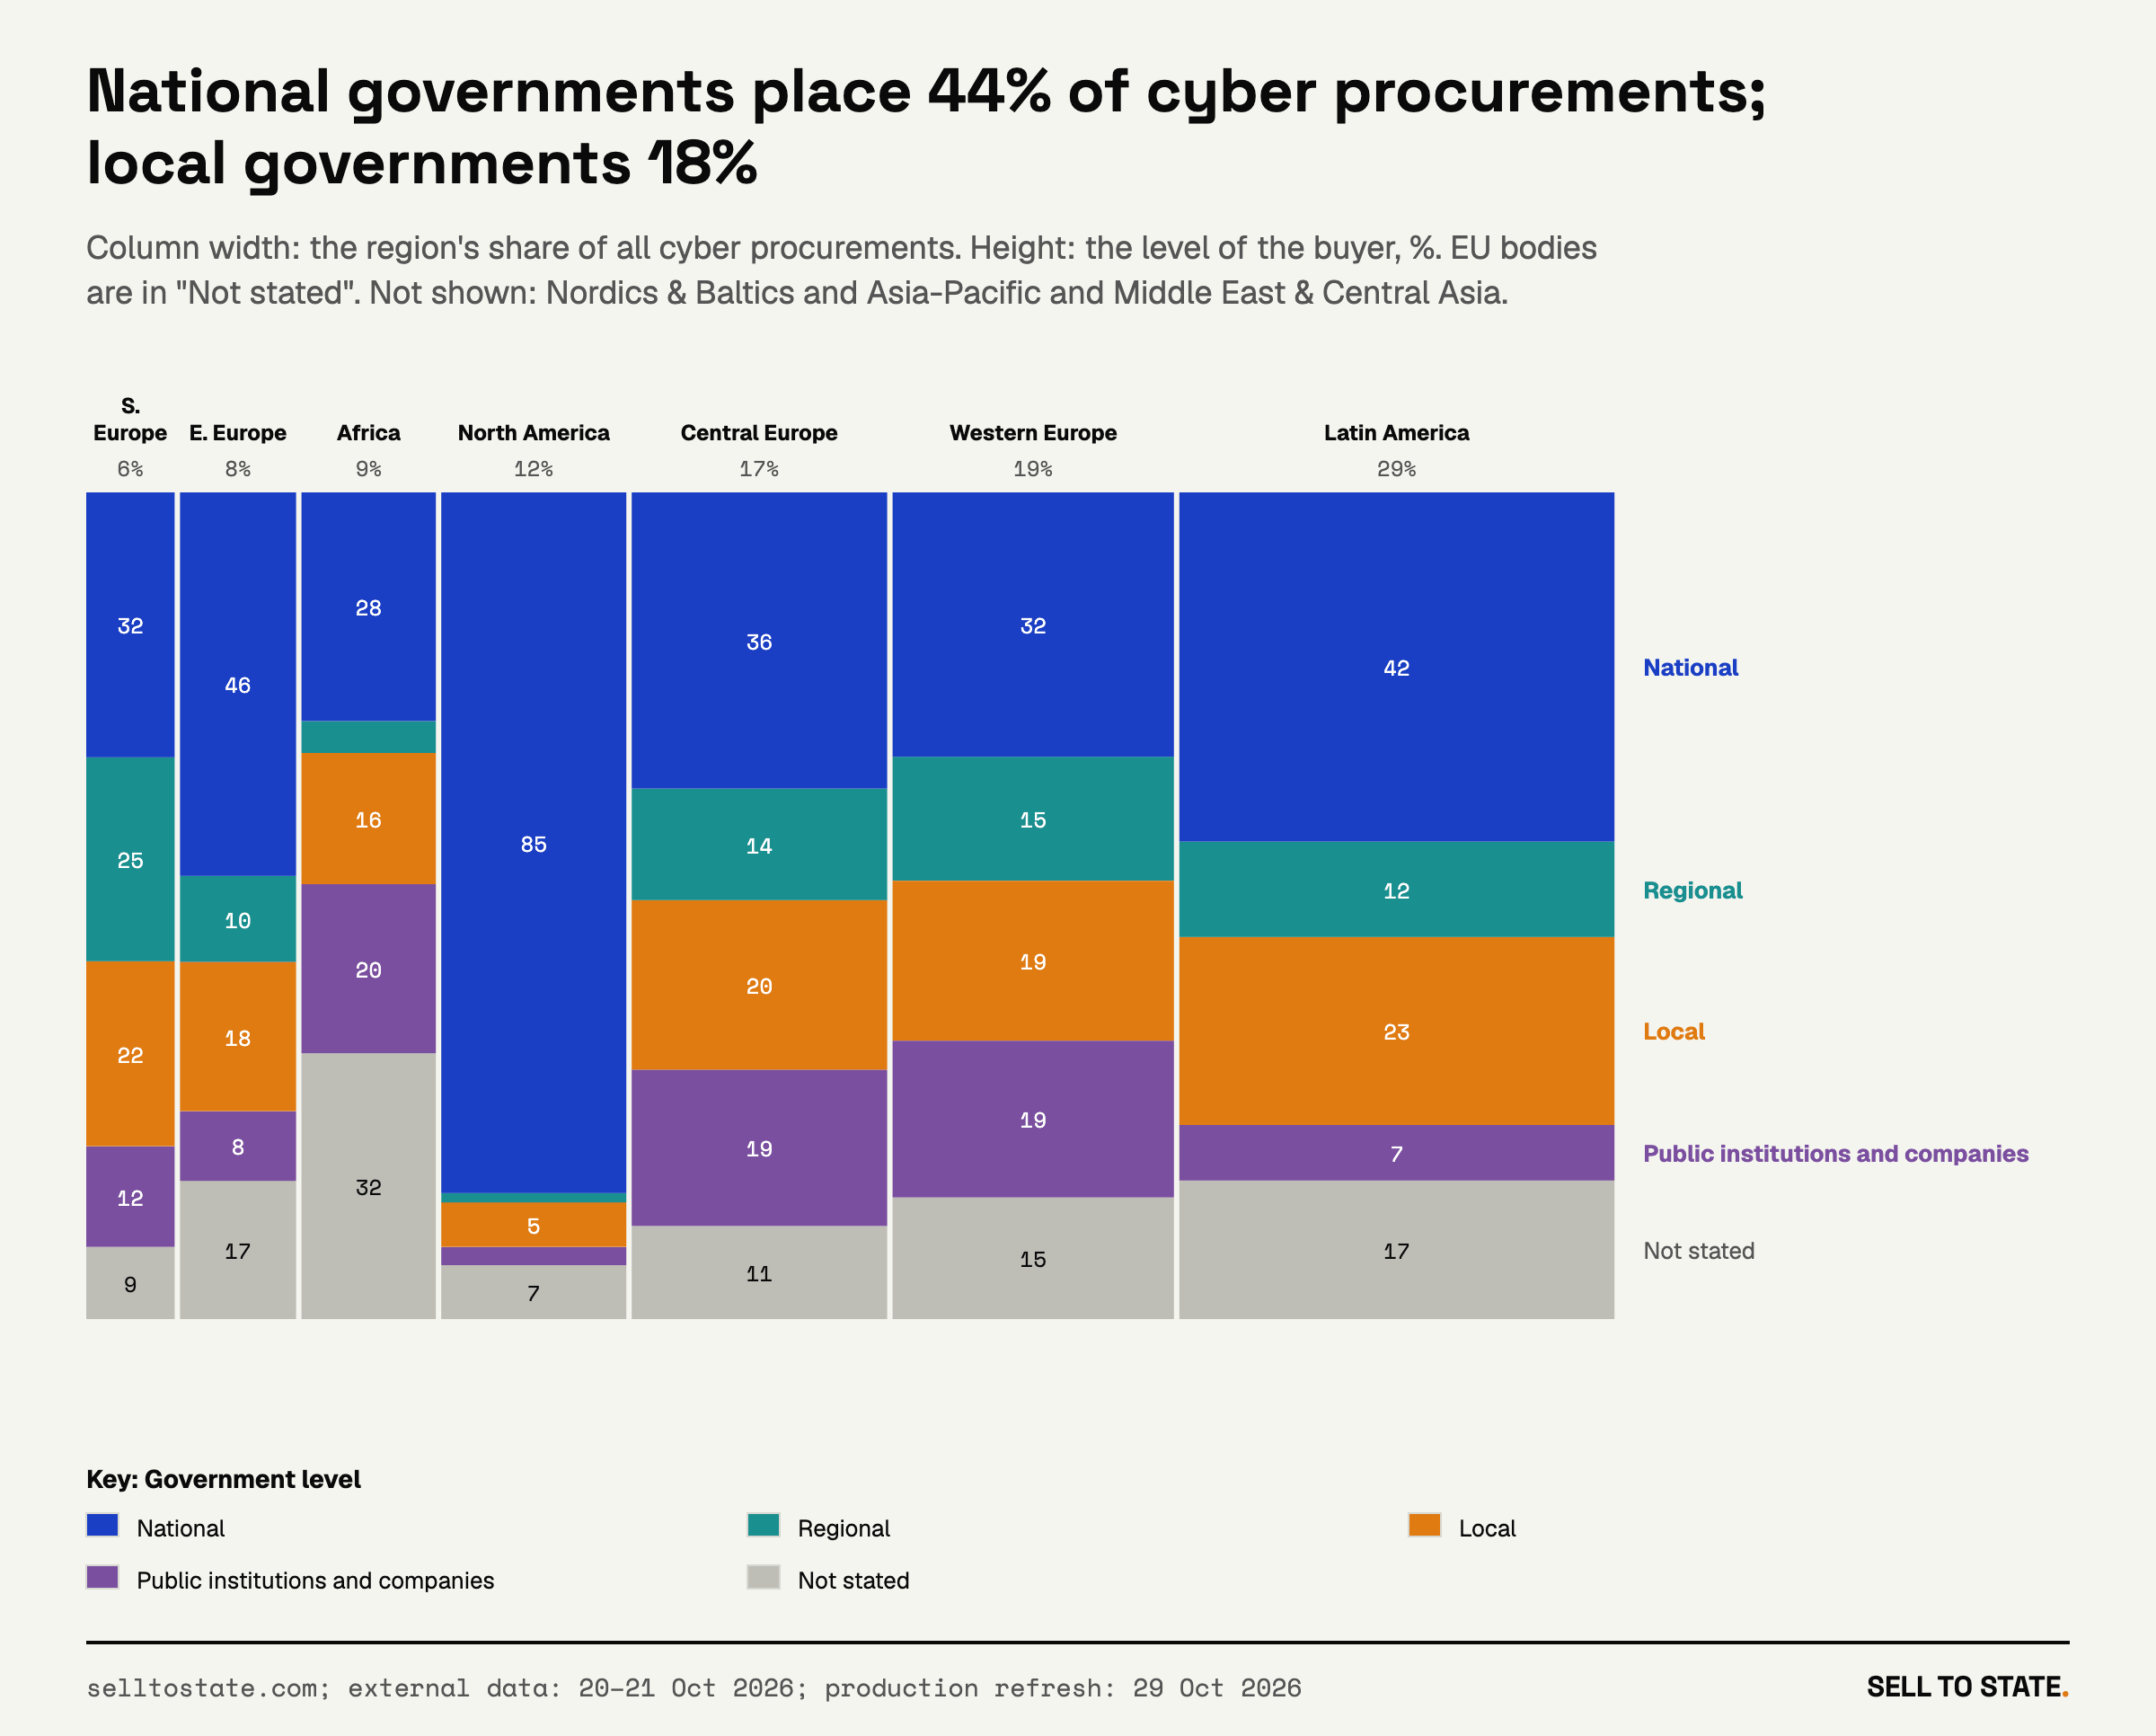
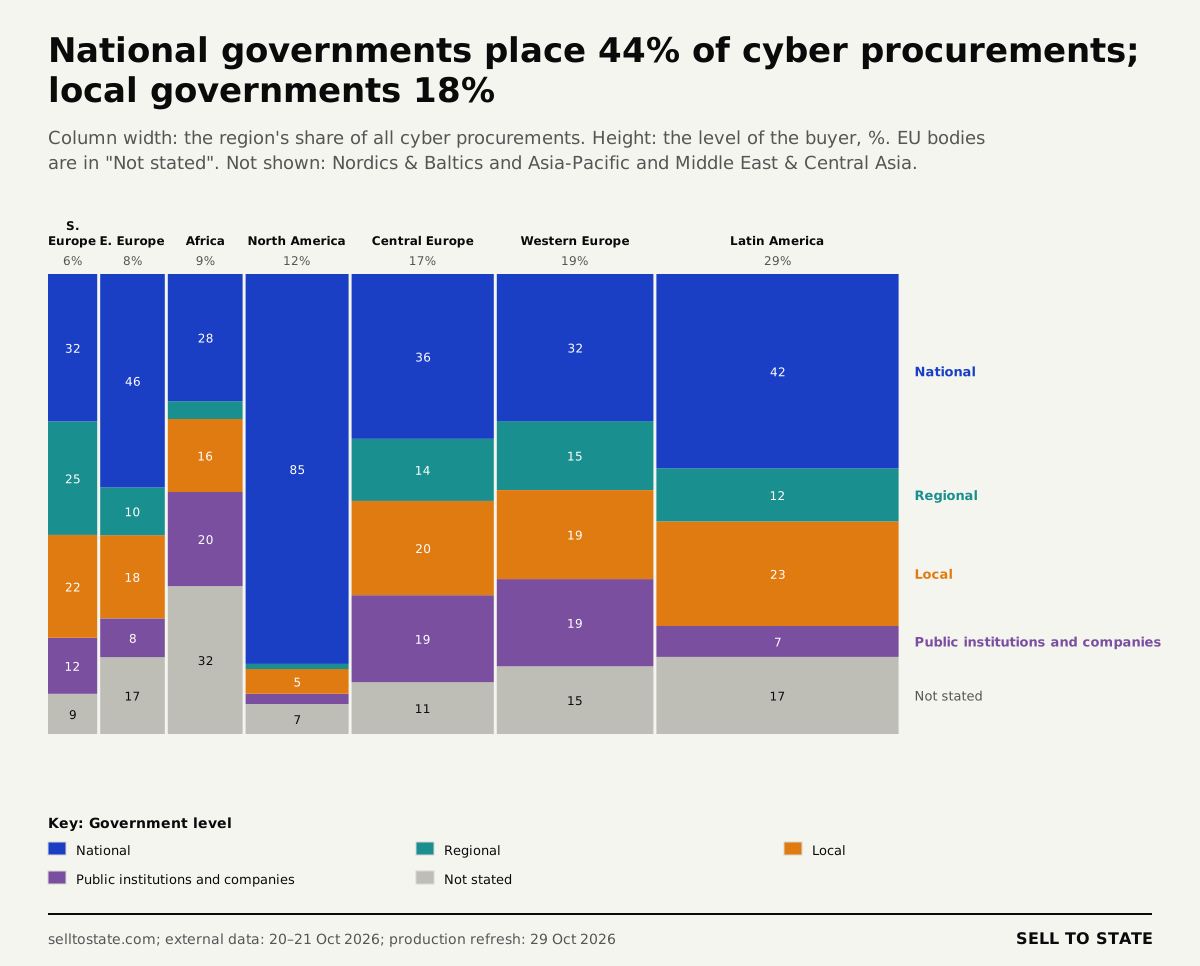
V18: National governments place 44% of cyber procurements; local governments 18%. PNG · SVG
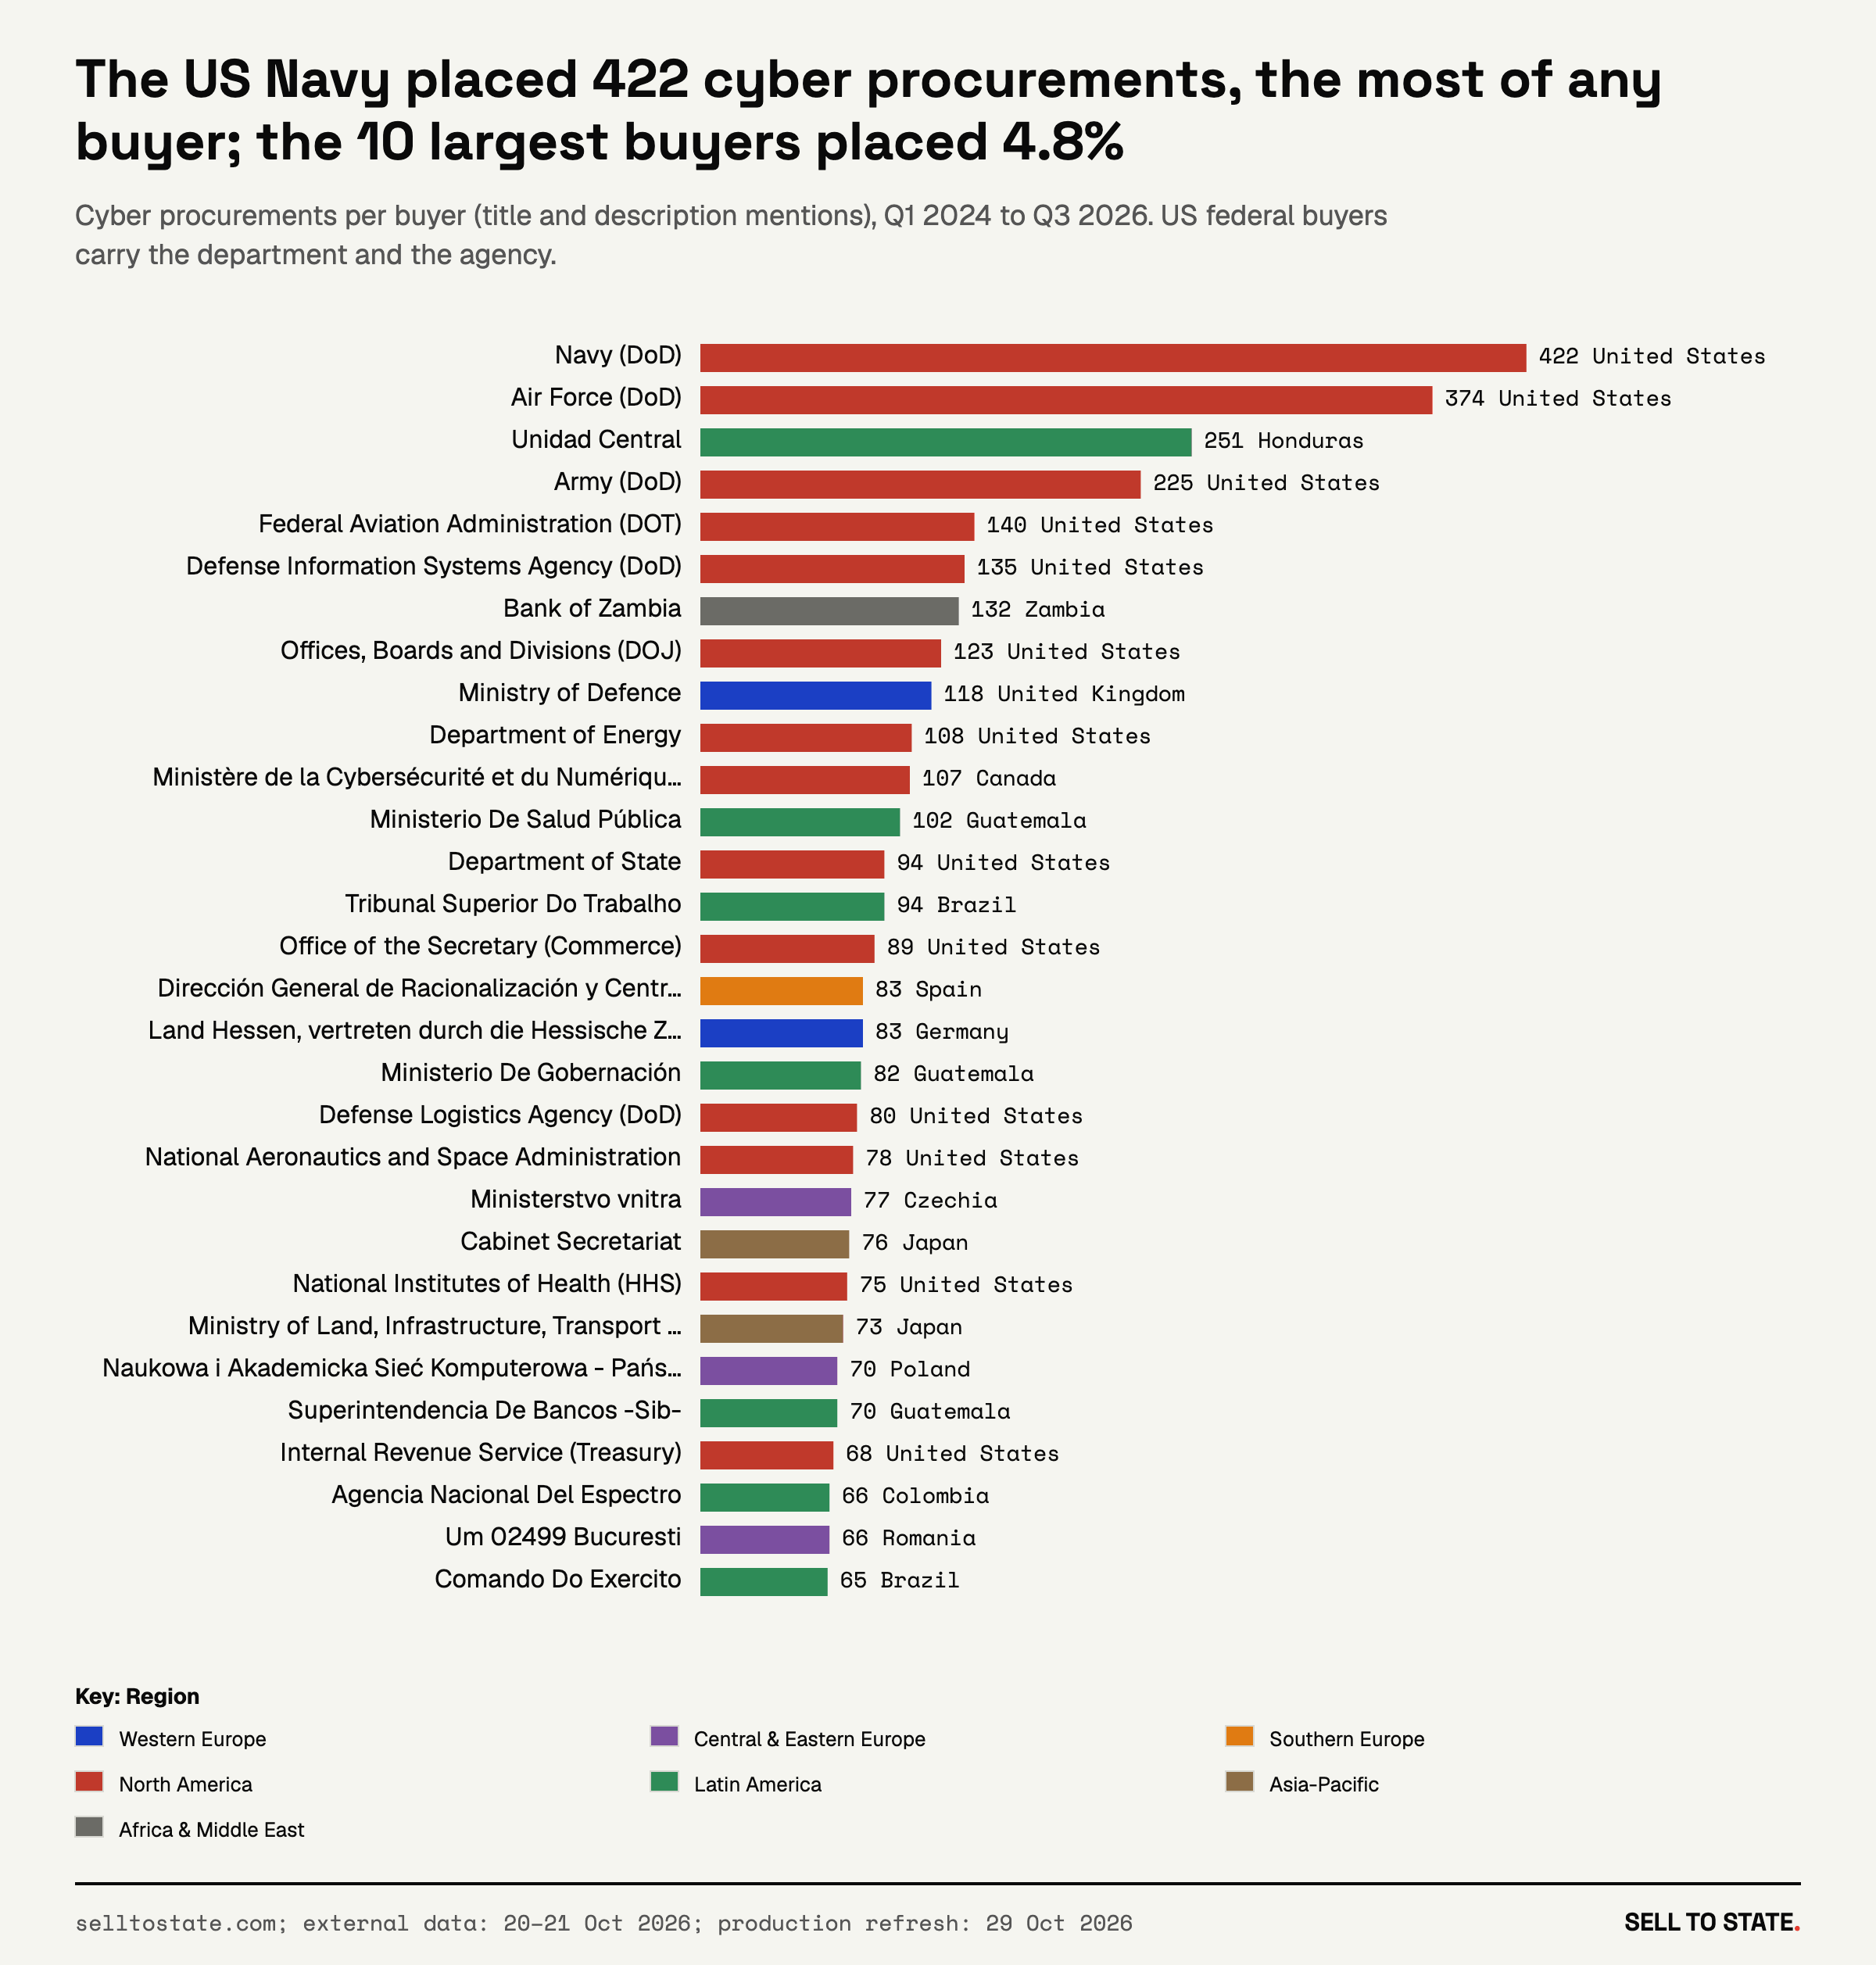
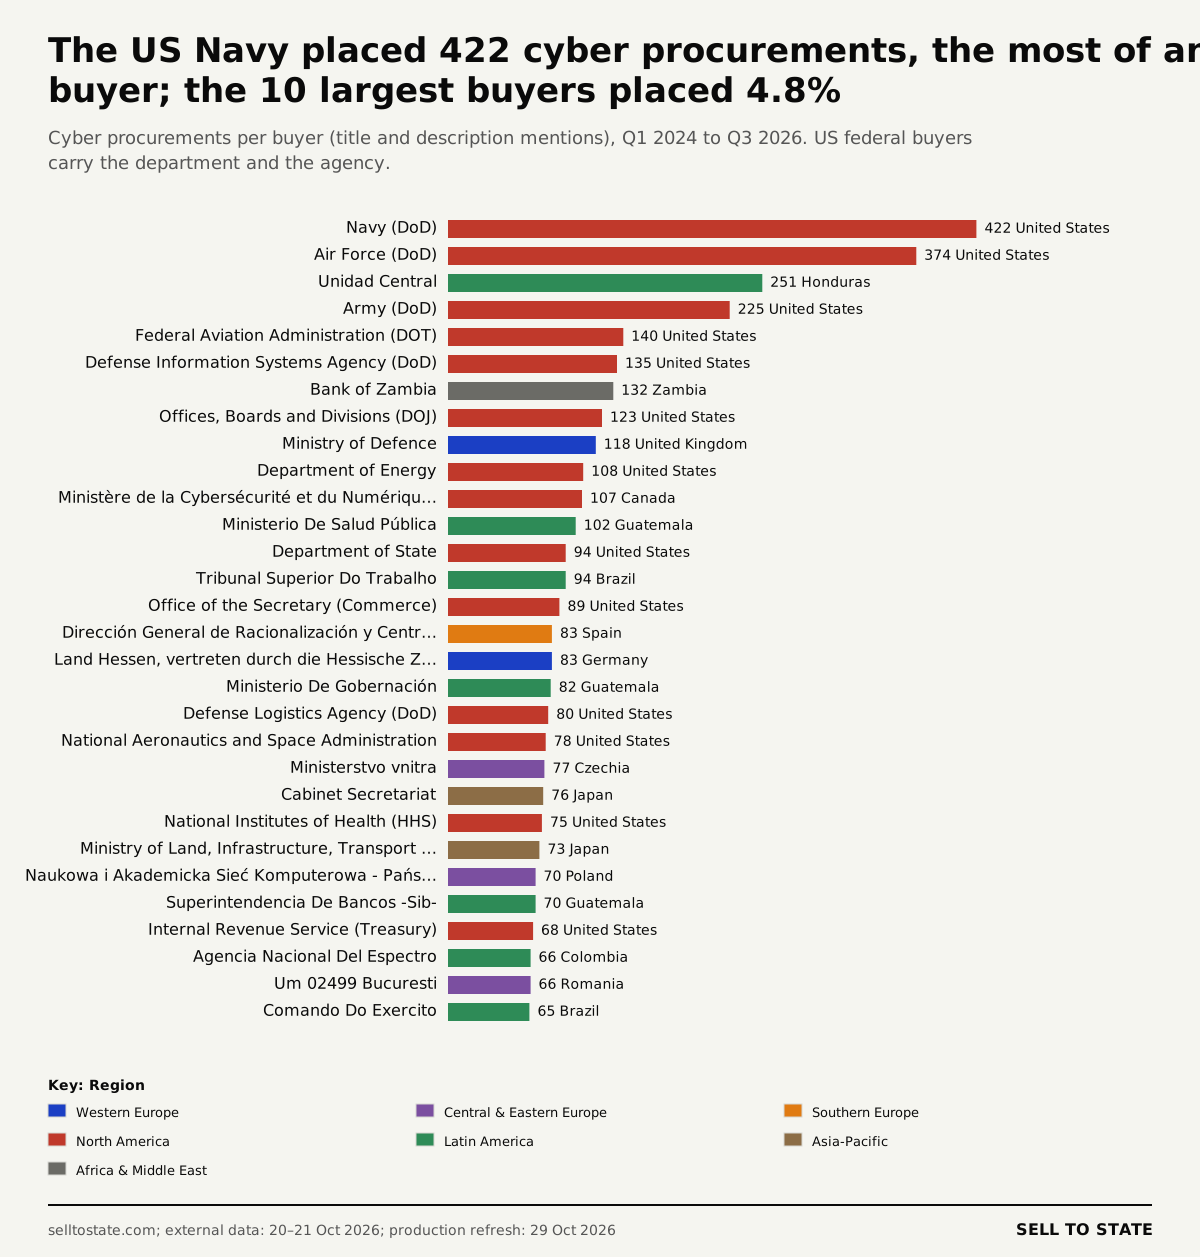
V19: The US Navy placed 422 cyber procurements, the most of any buyer; the 10 largest buyers placed 4.8%. PNG · SVG
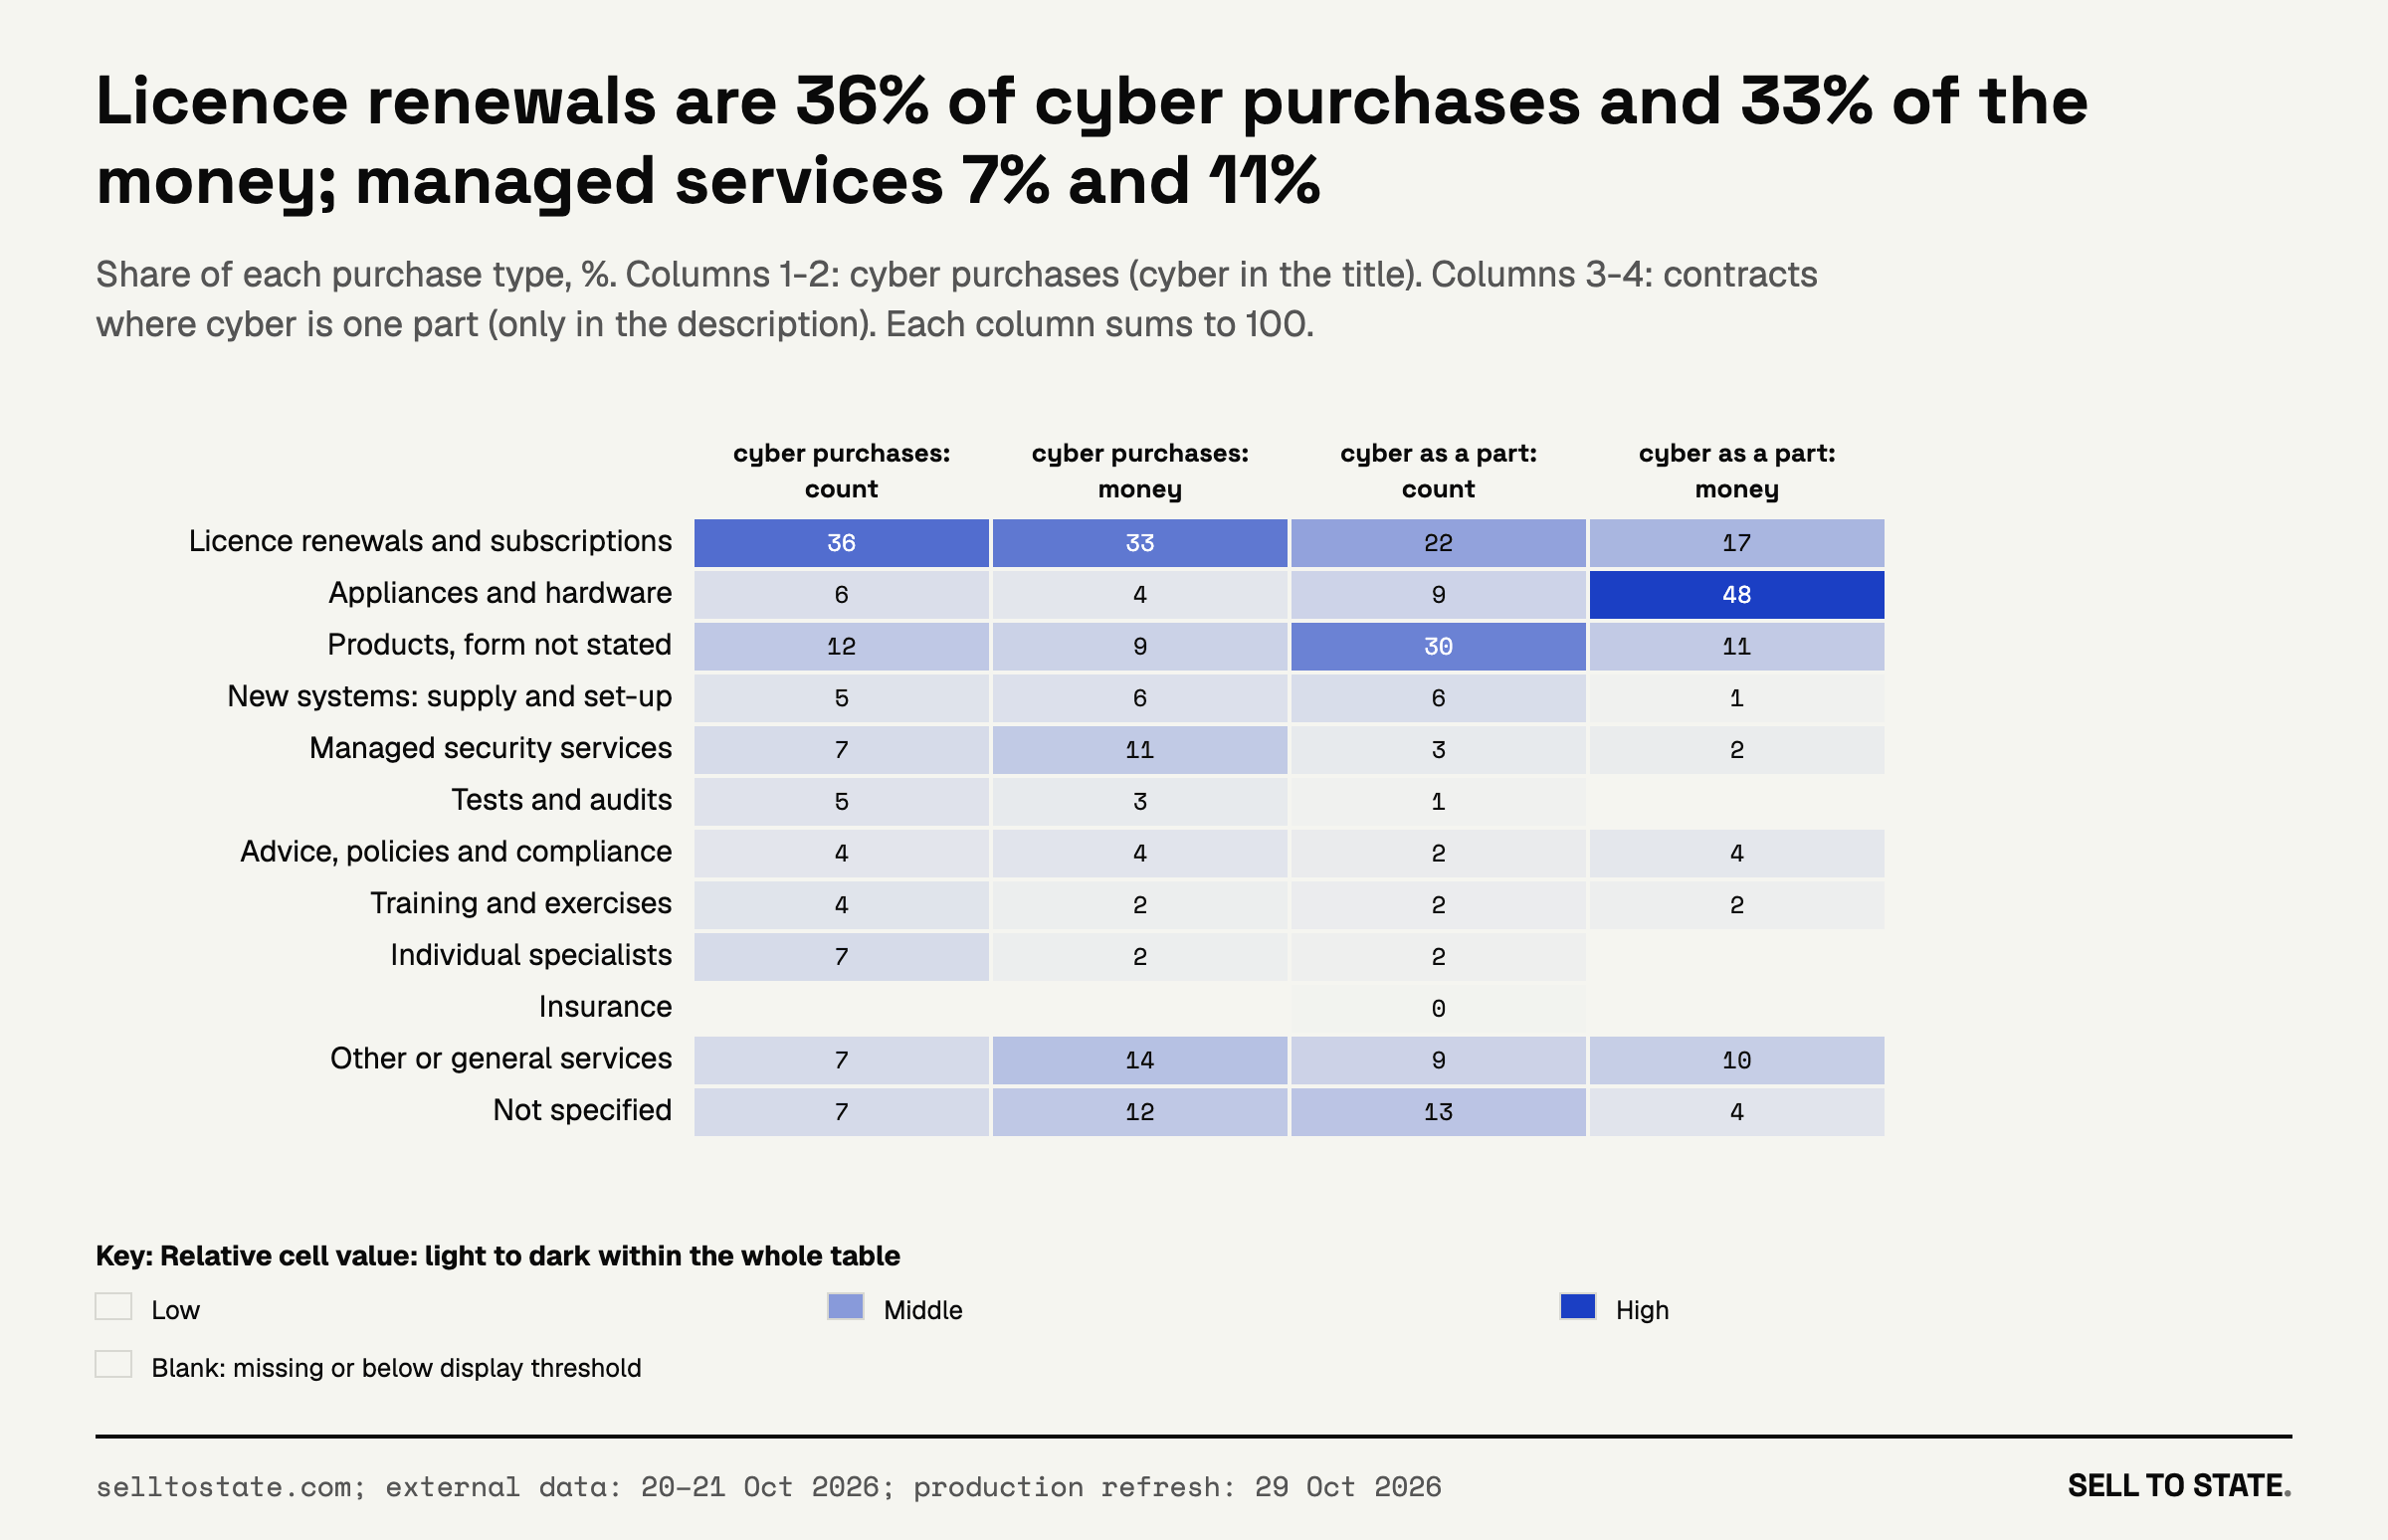
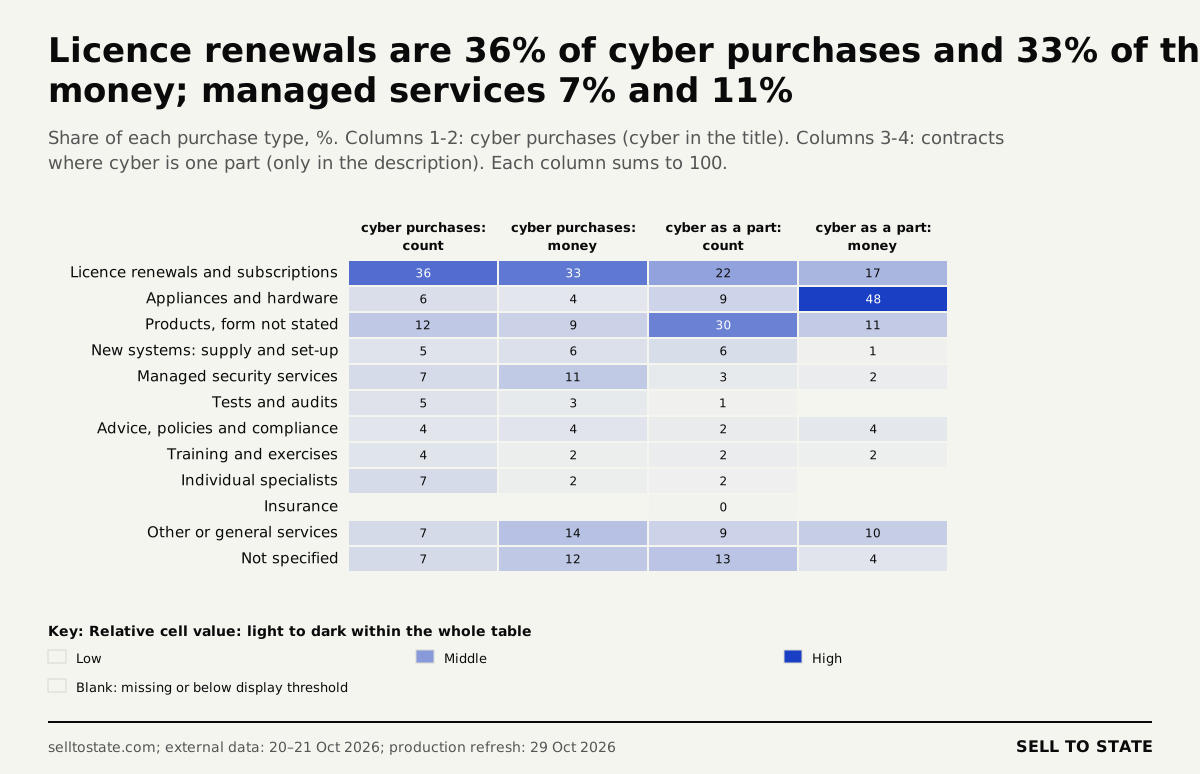
V20: Licence renewals are 36% of cyber purchases and 33% of the money; managed services 7% and 11%. PNG · SVG
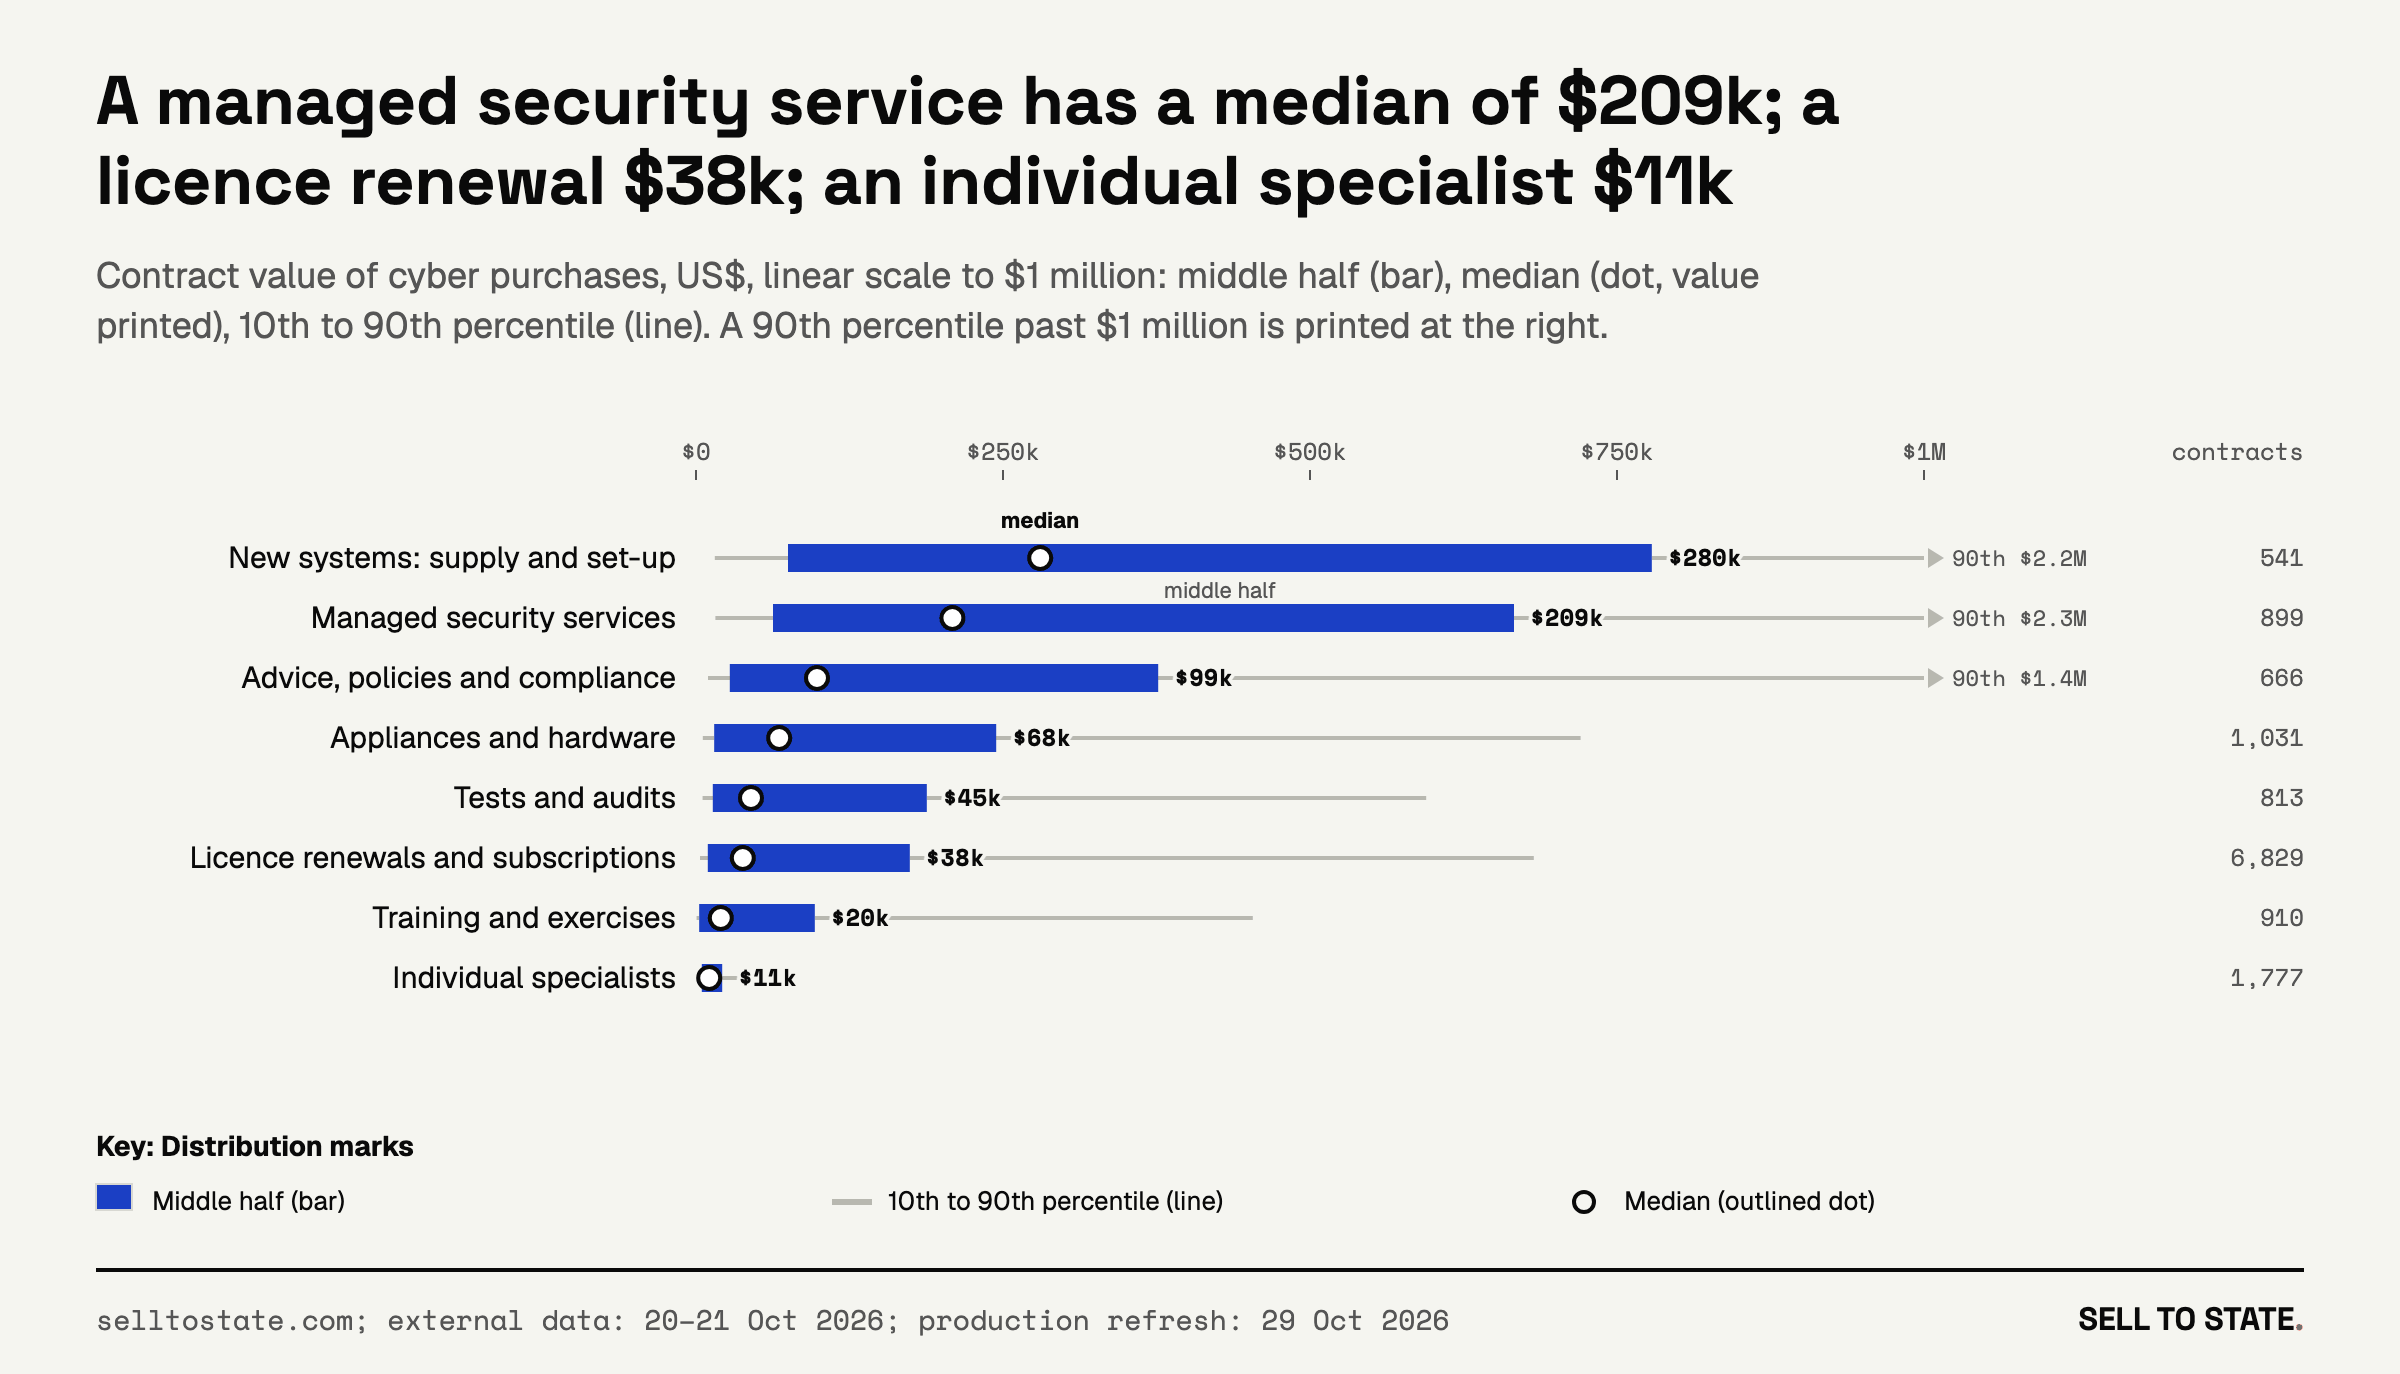
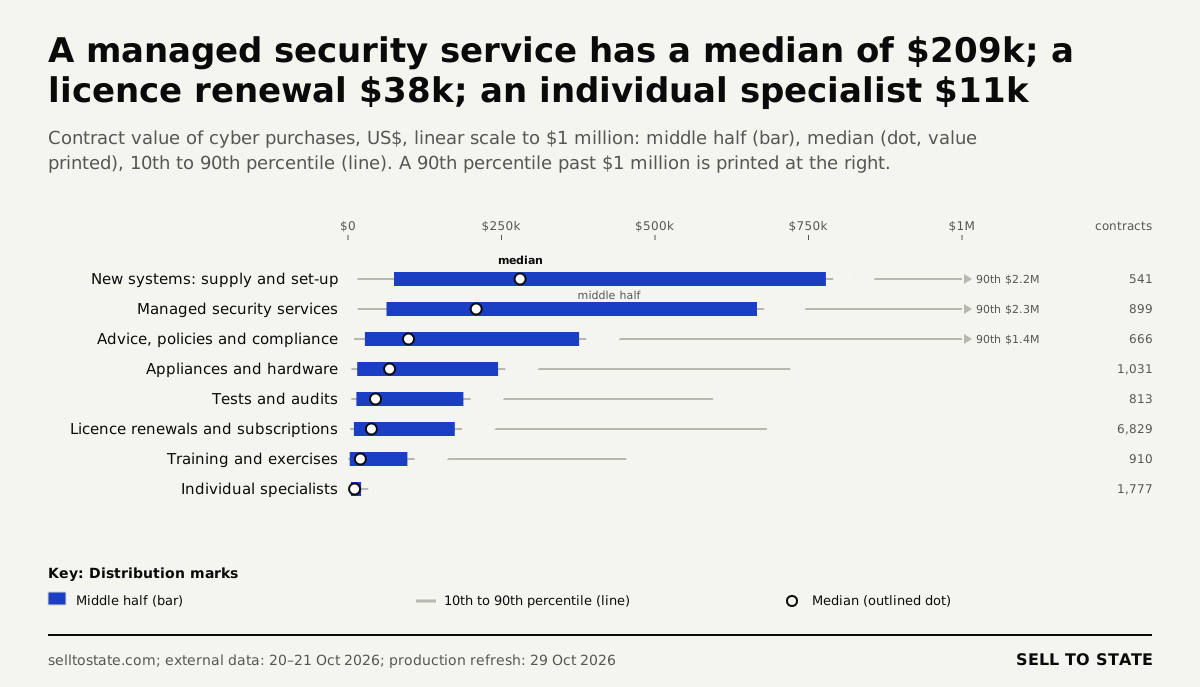
V21: A managed security service has a median of $209k; a licence renewal $38k; an individual specialist $11k. PNG · SVG
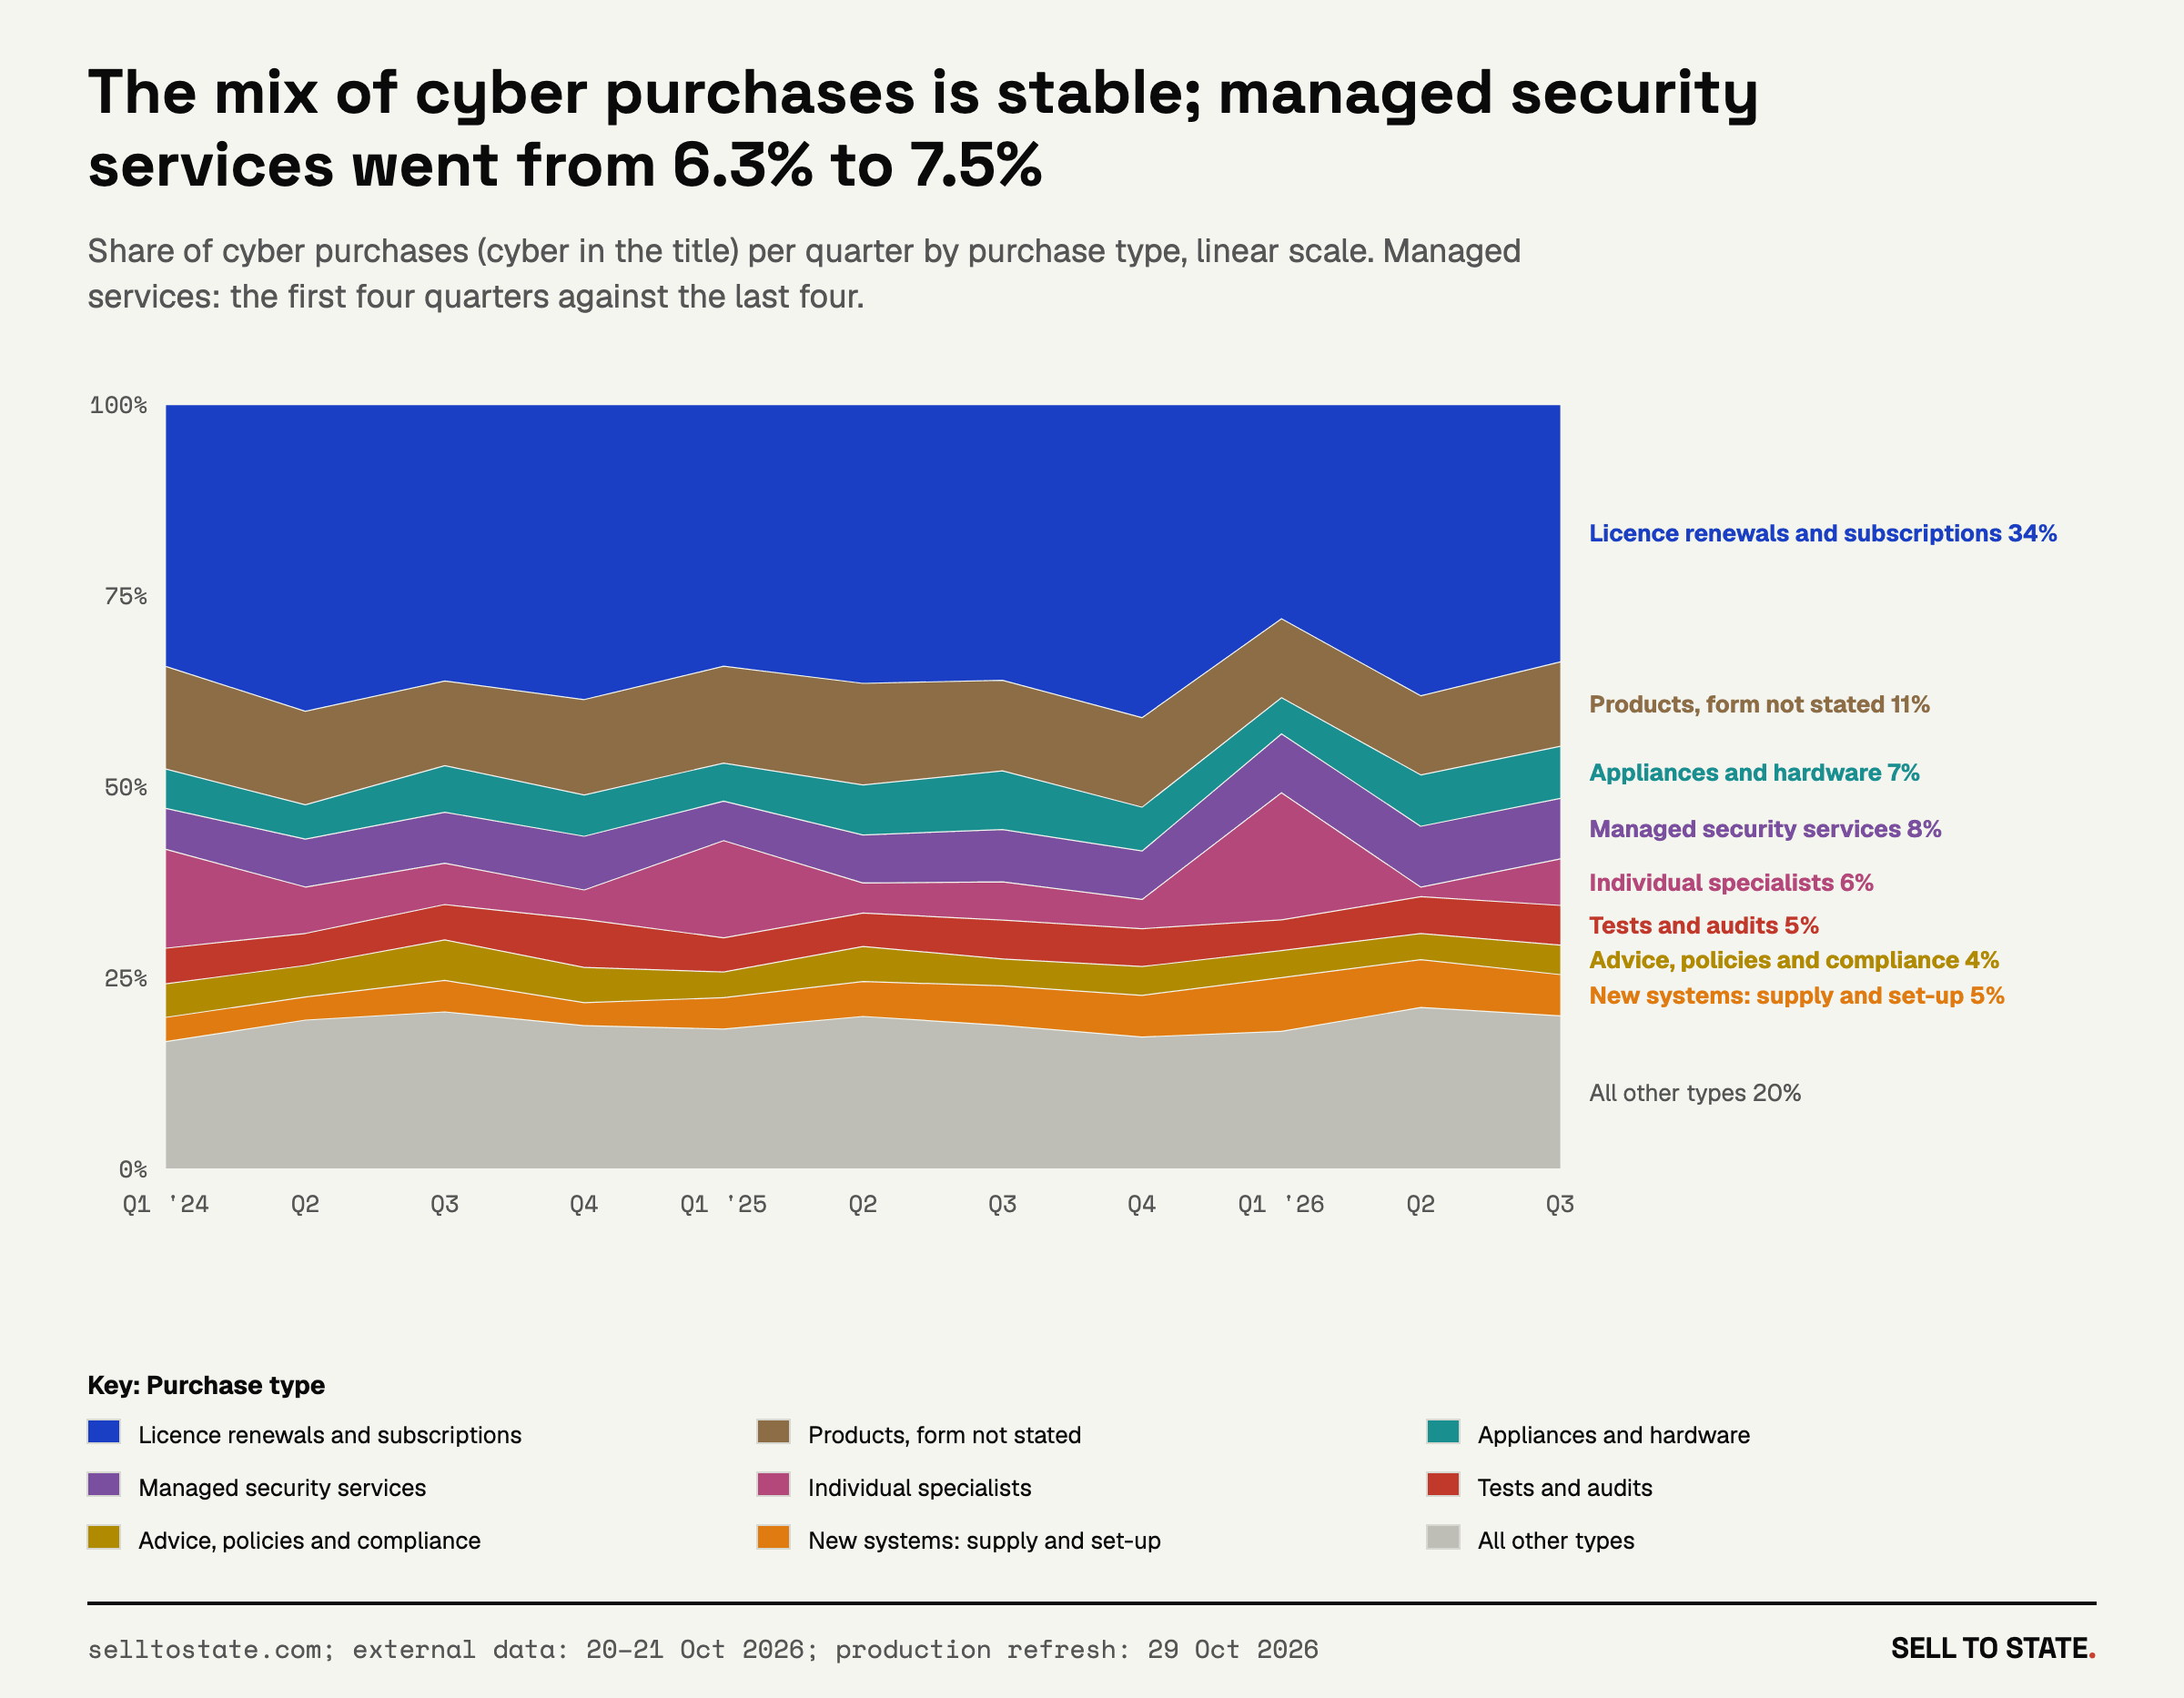
V22: The mix of cyber purchases is stable; managed security services went from 6.3% to 7.5%. PNG · SVG
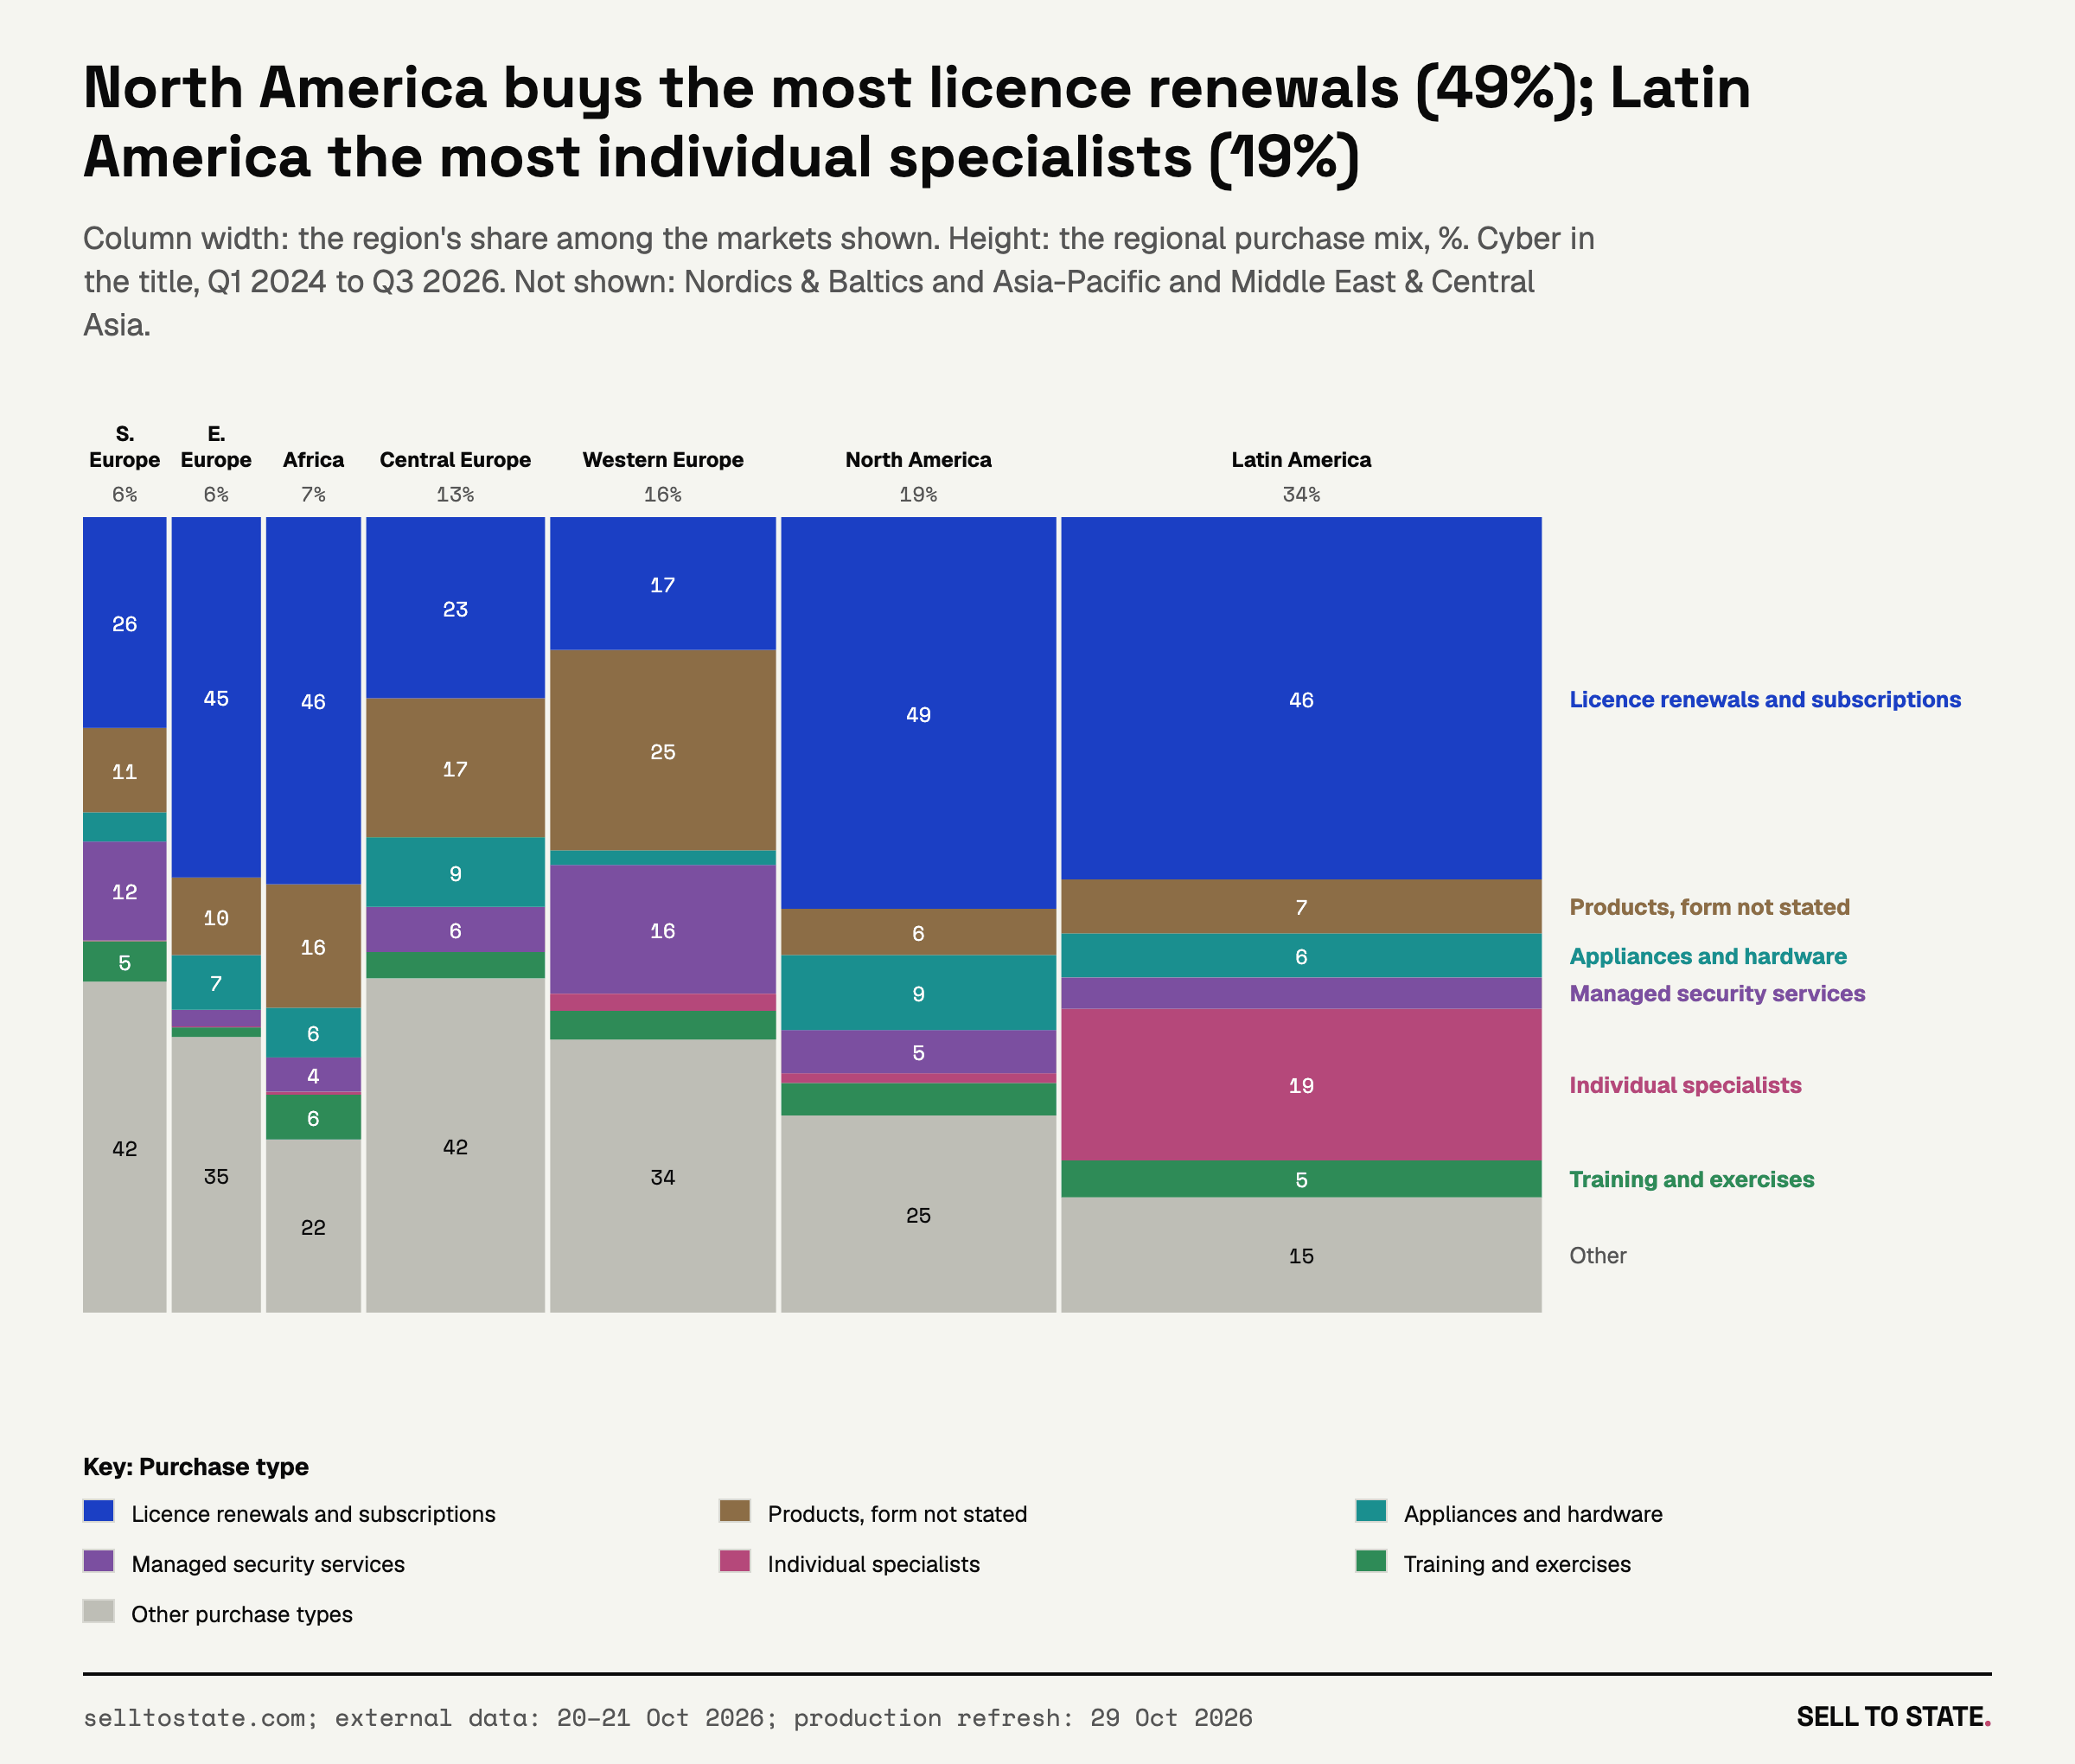
V23: North America buys the most licence renewals (49%); Latin America the most individual specialists (19%). PNG · SVG
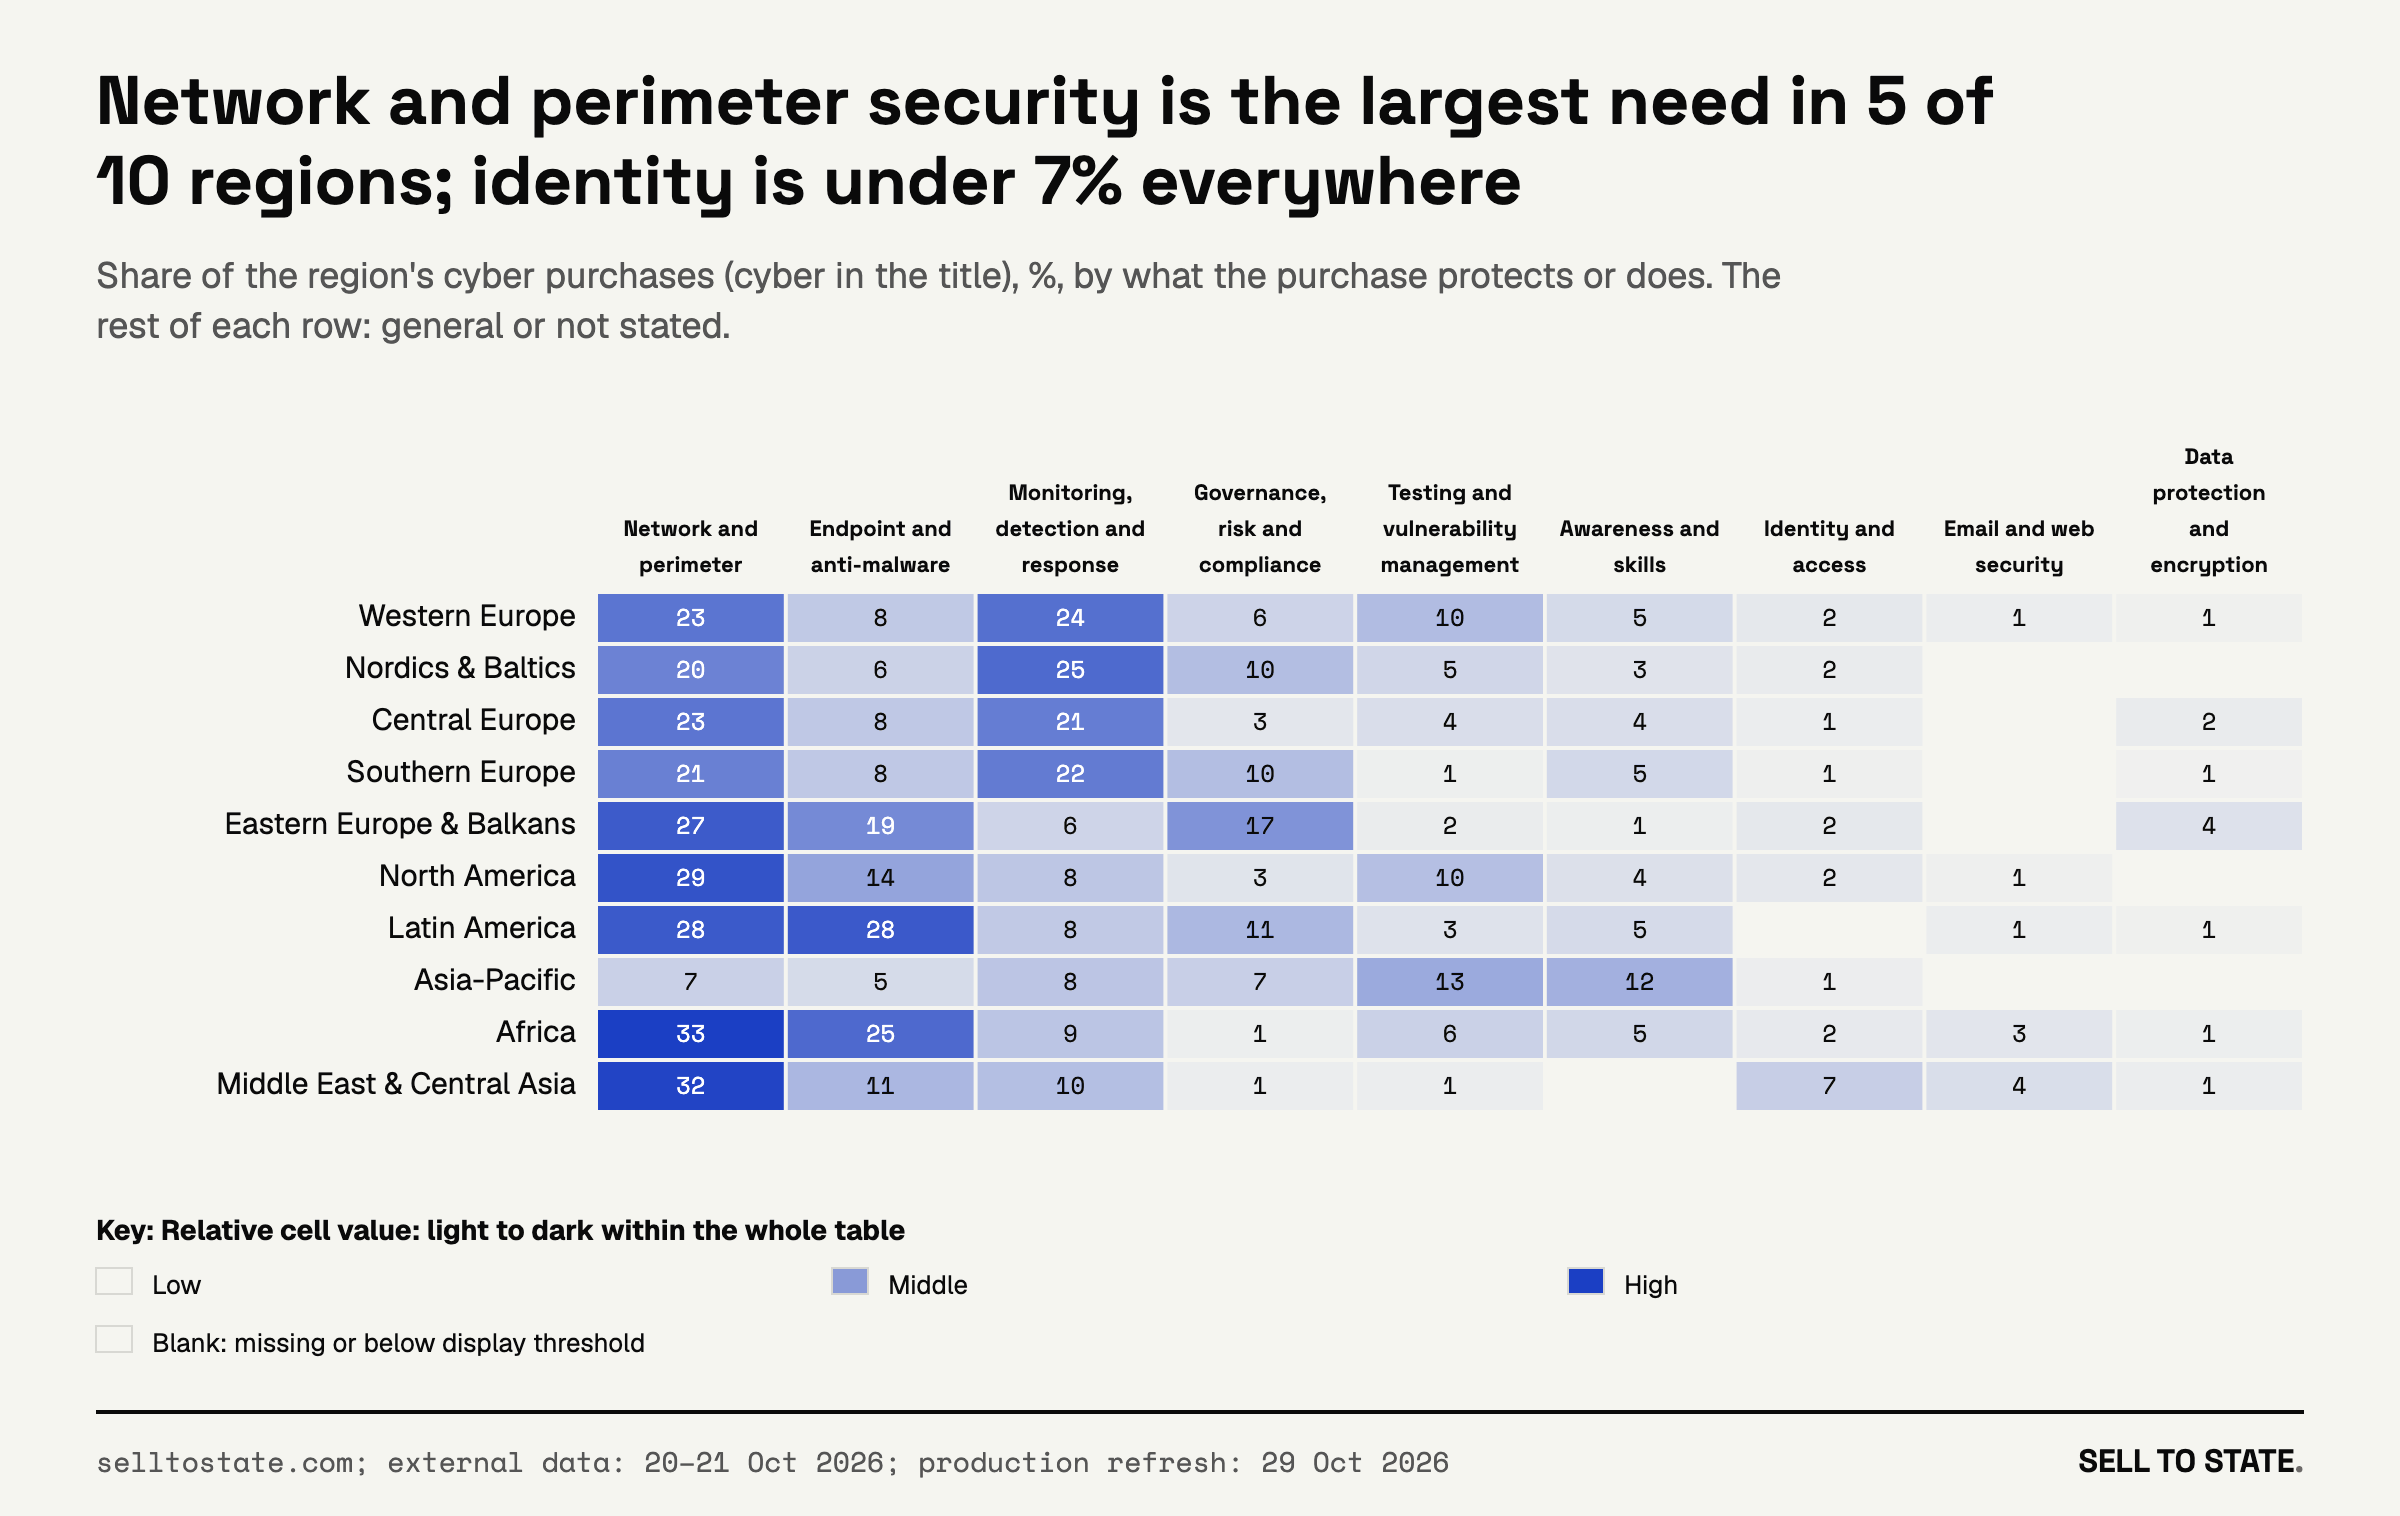
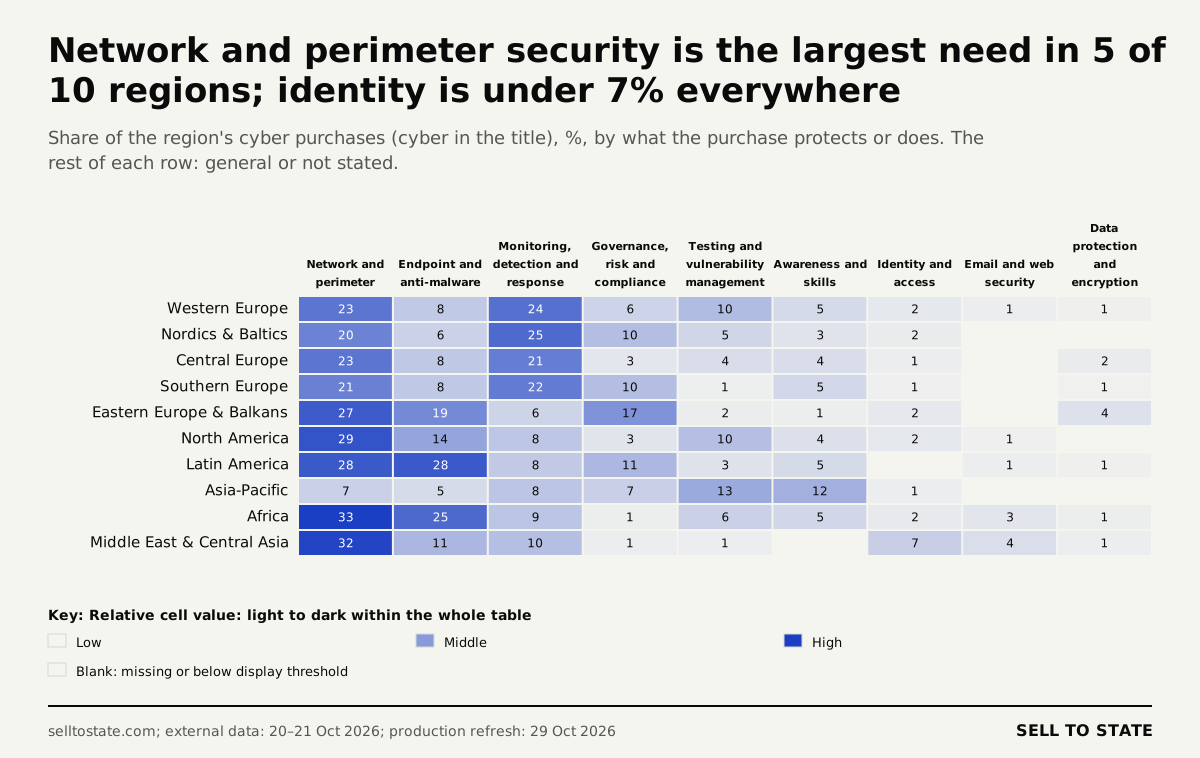
V24: Network and perimeter security is the largest need in 5 of 10 regions; identity is under 7% everywhere. PNG · SVG
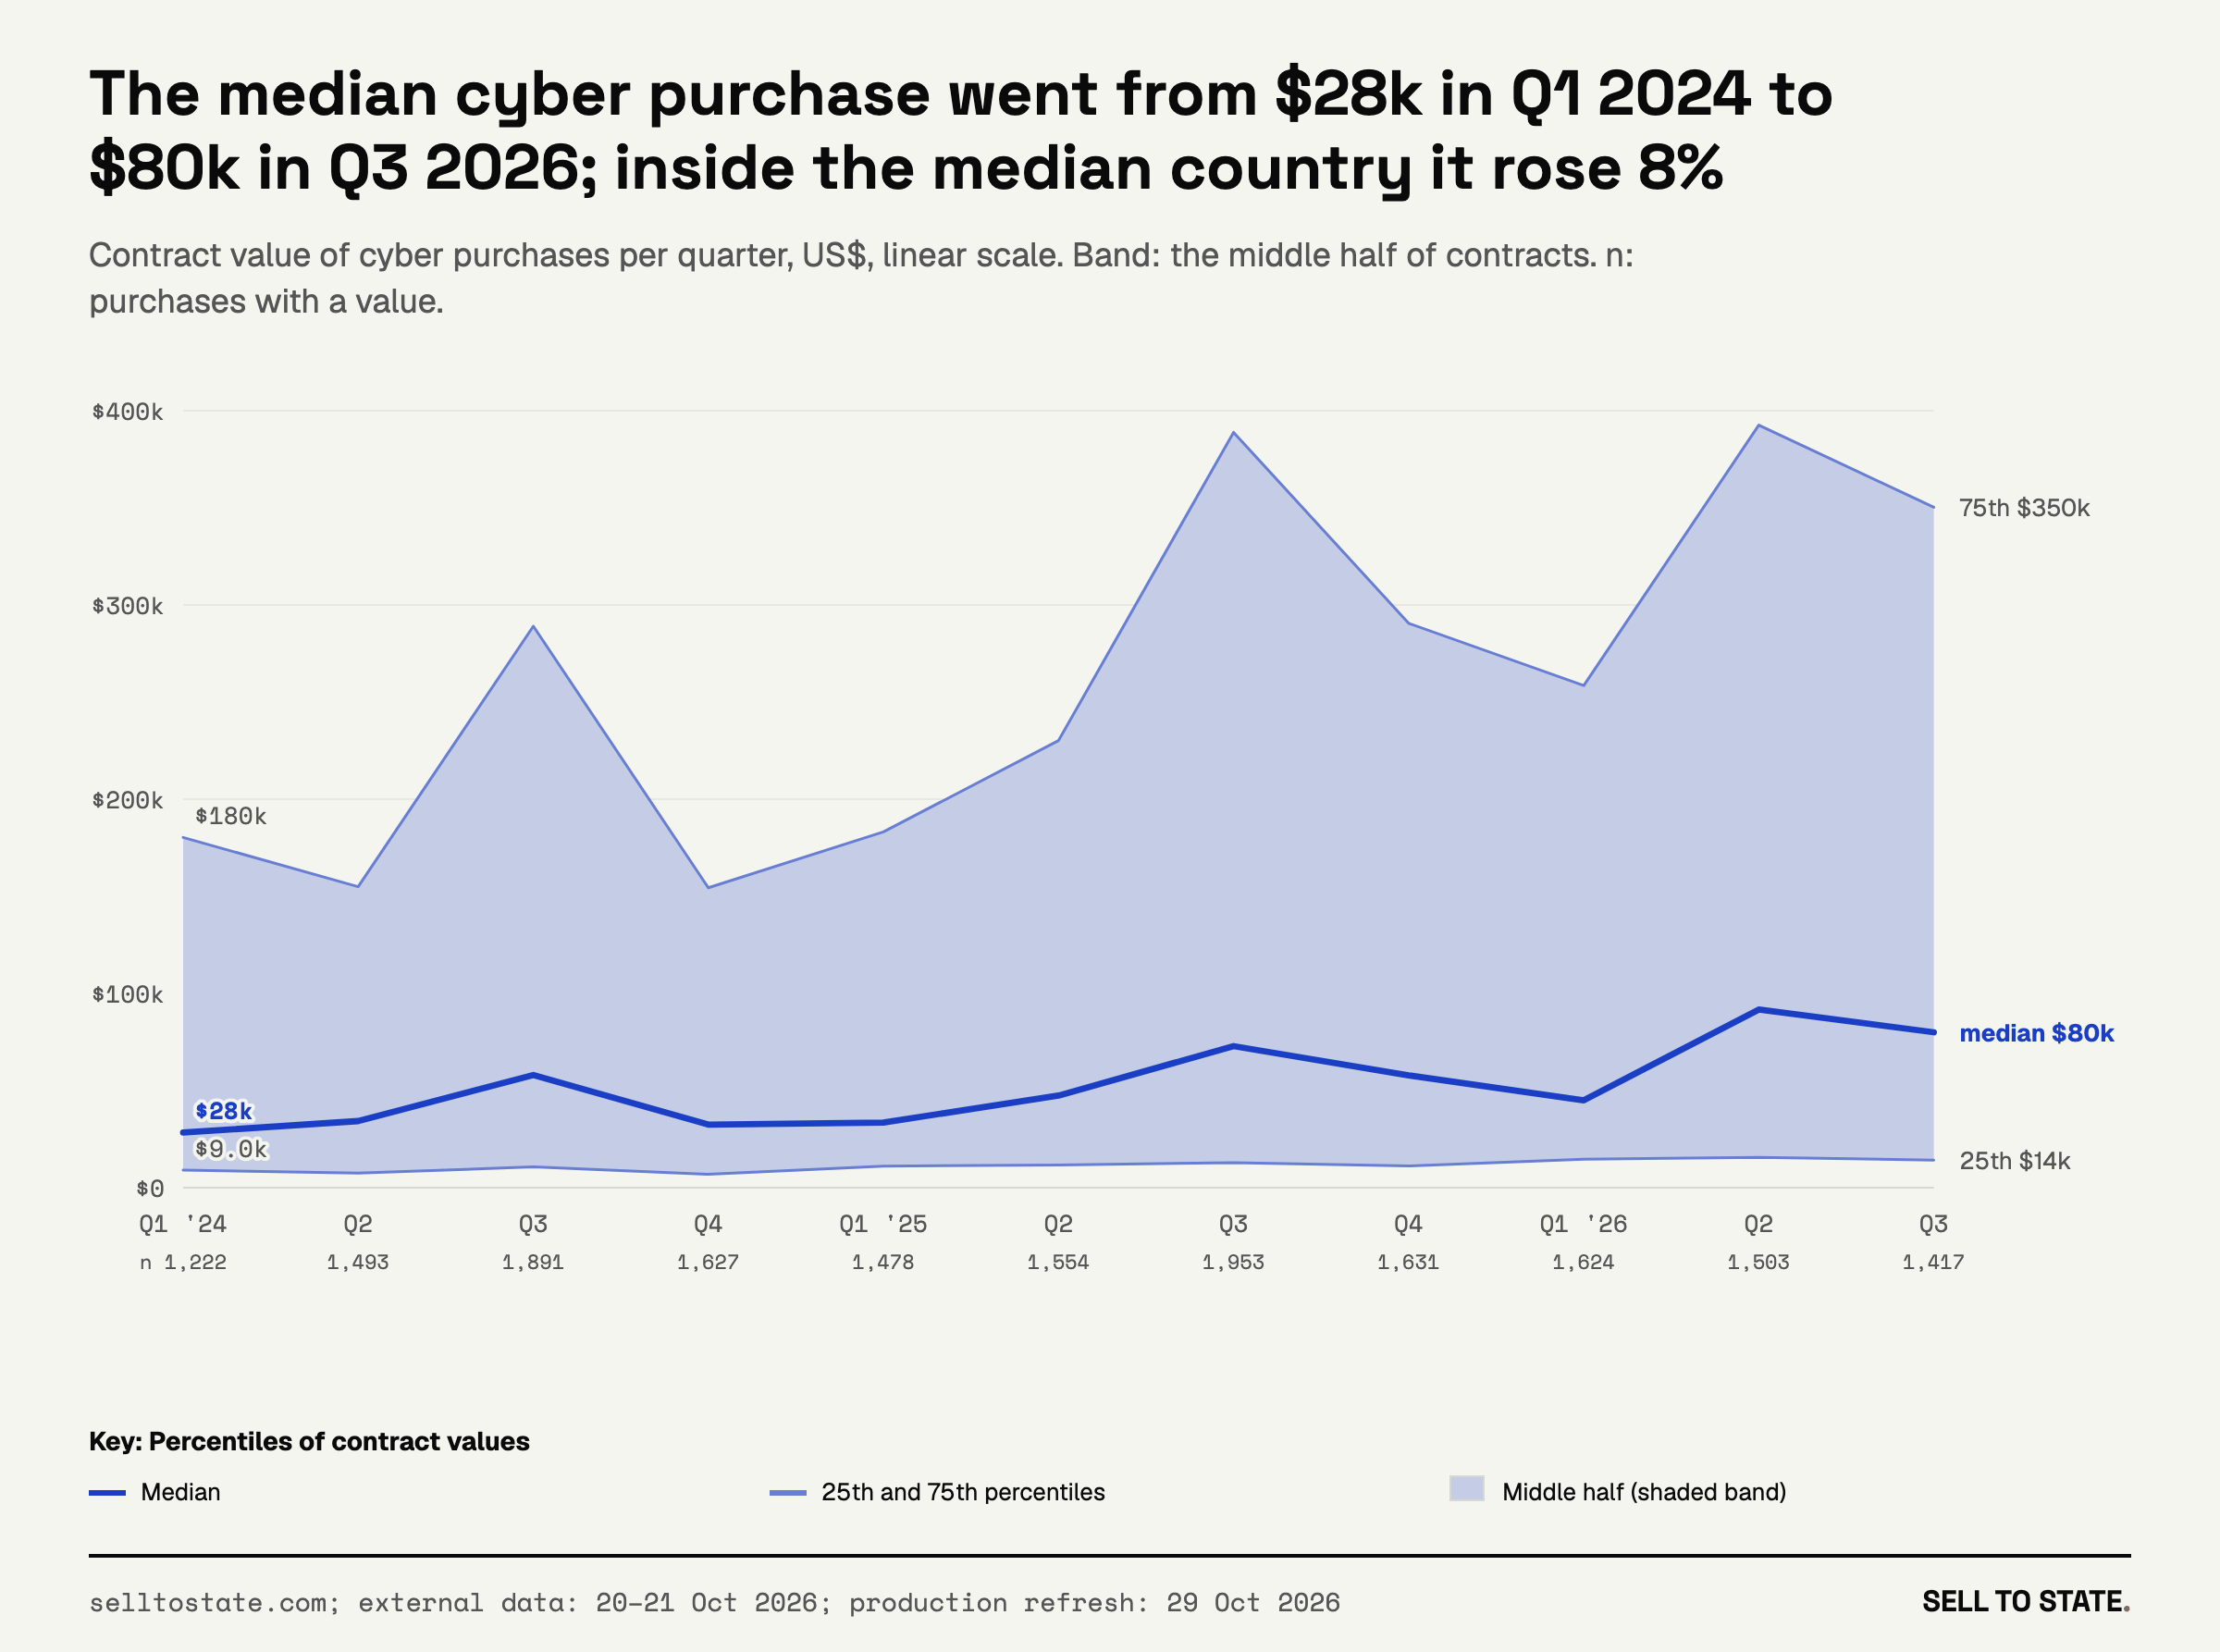
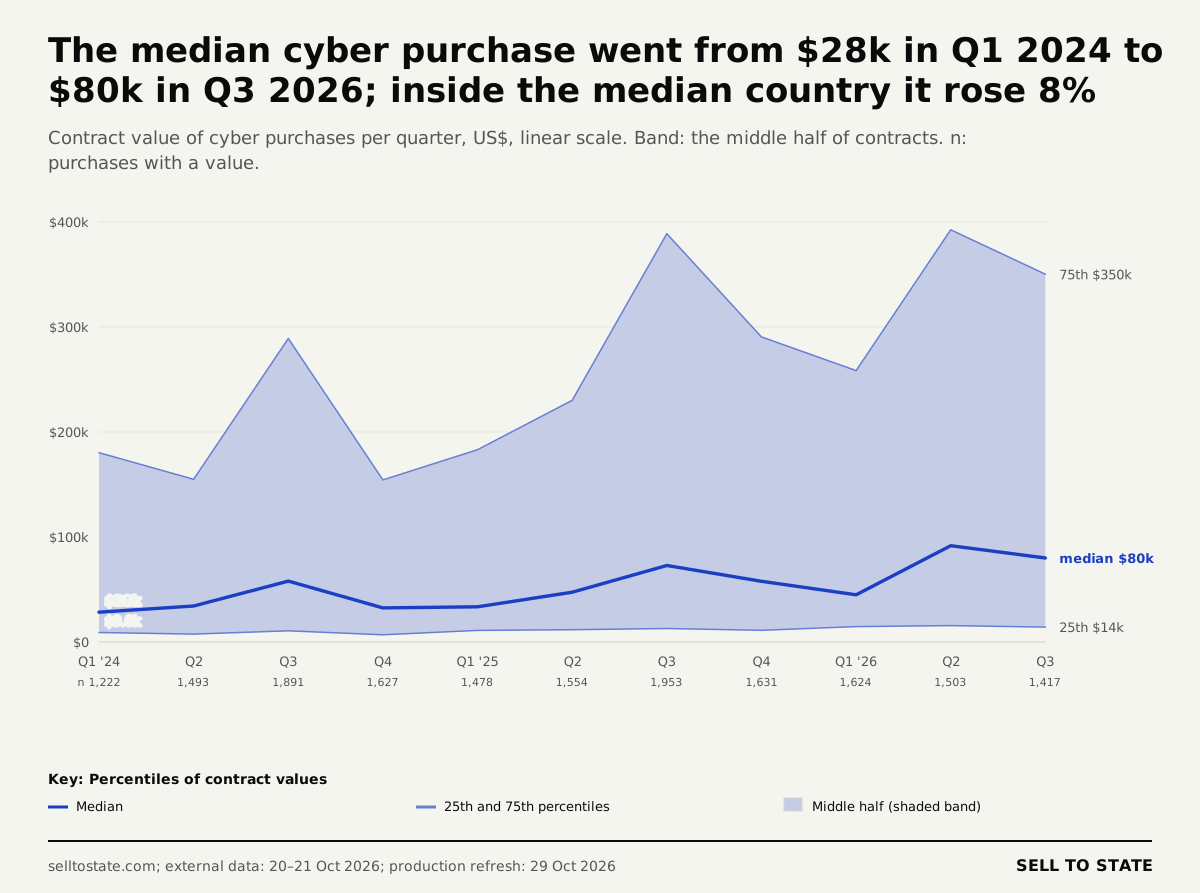
V25: The median cyber purchase went from $28k in Q1 2024 to $80k in Q3 2026; inside the median country it rose 8%. PNG · SVG
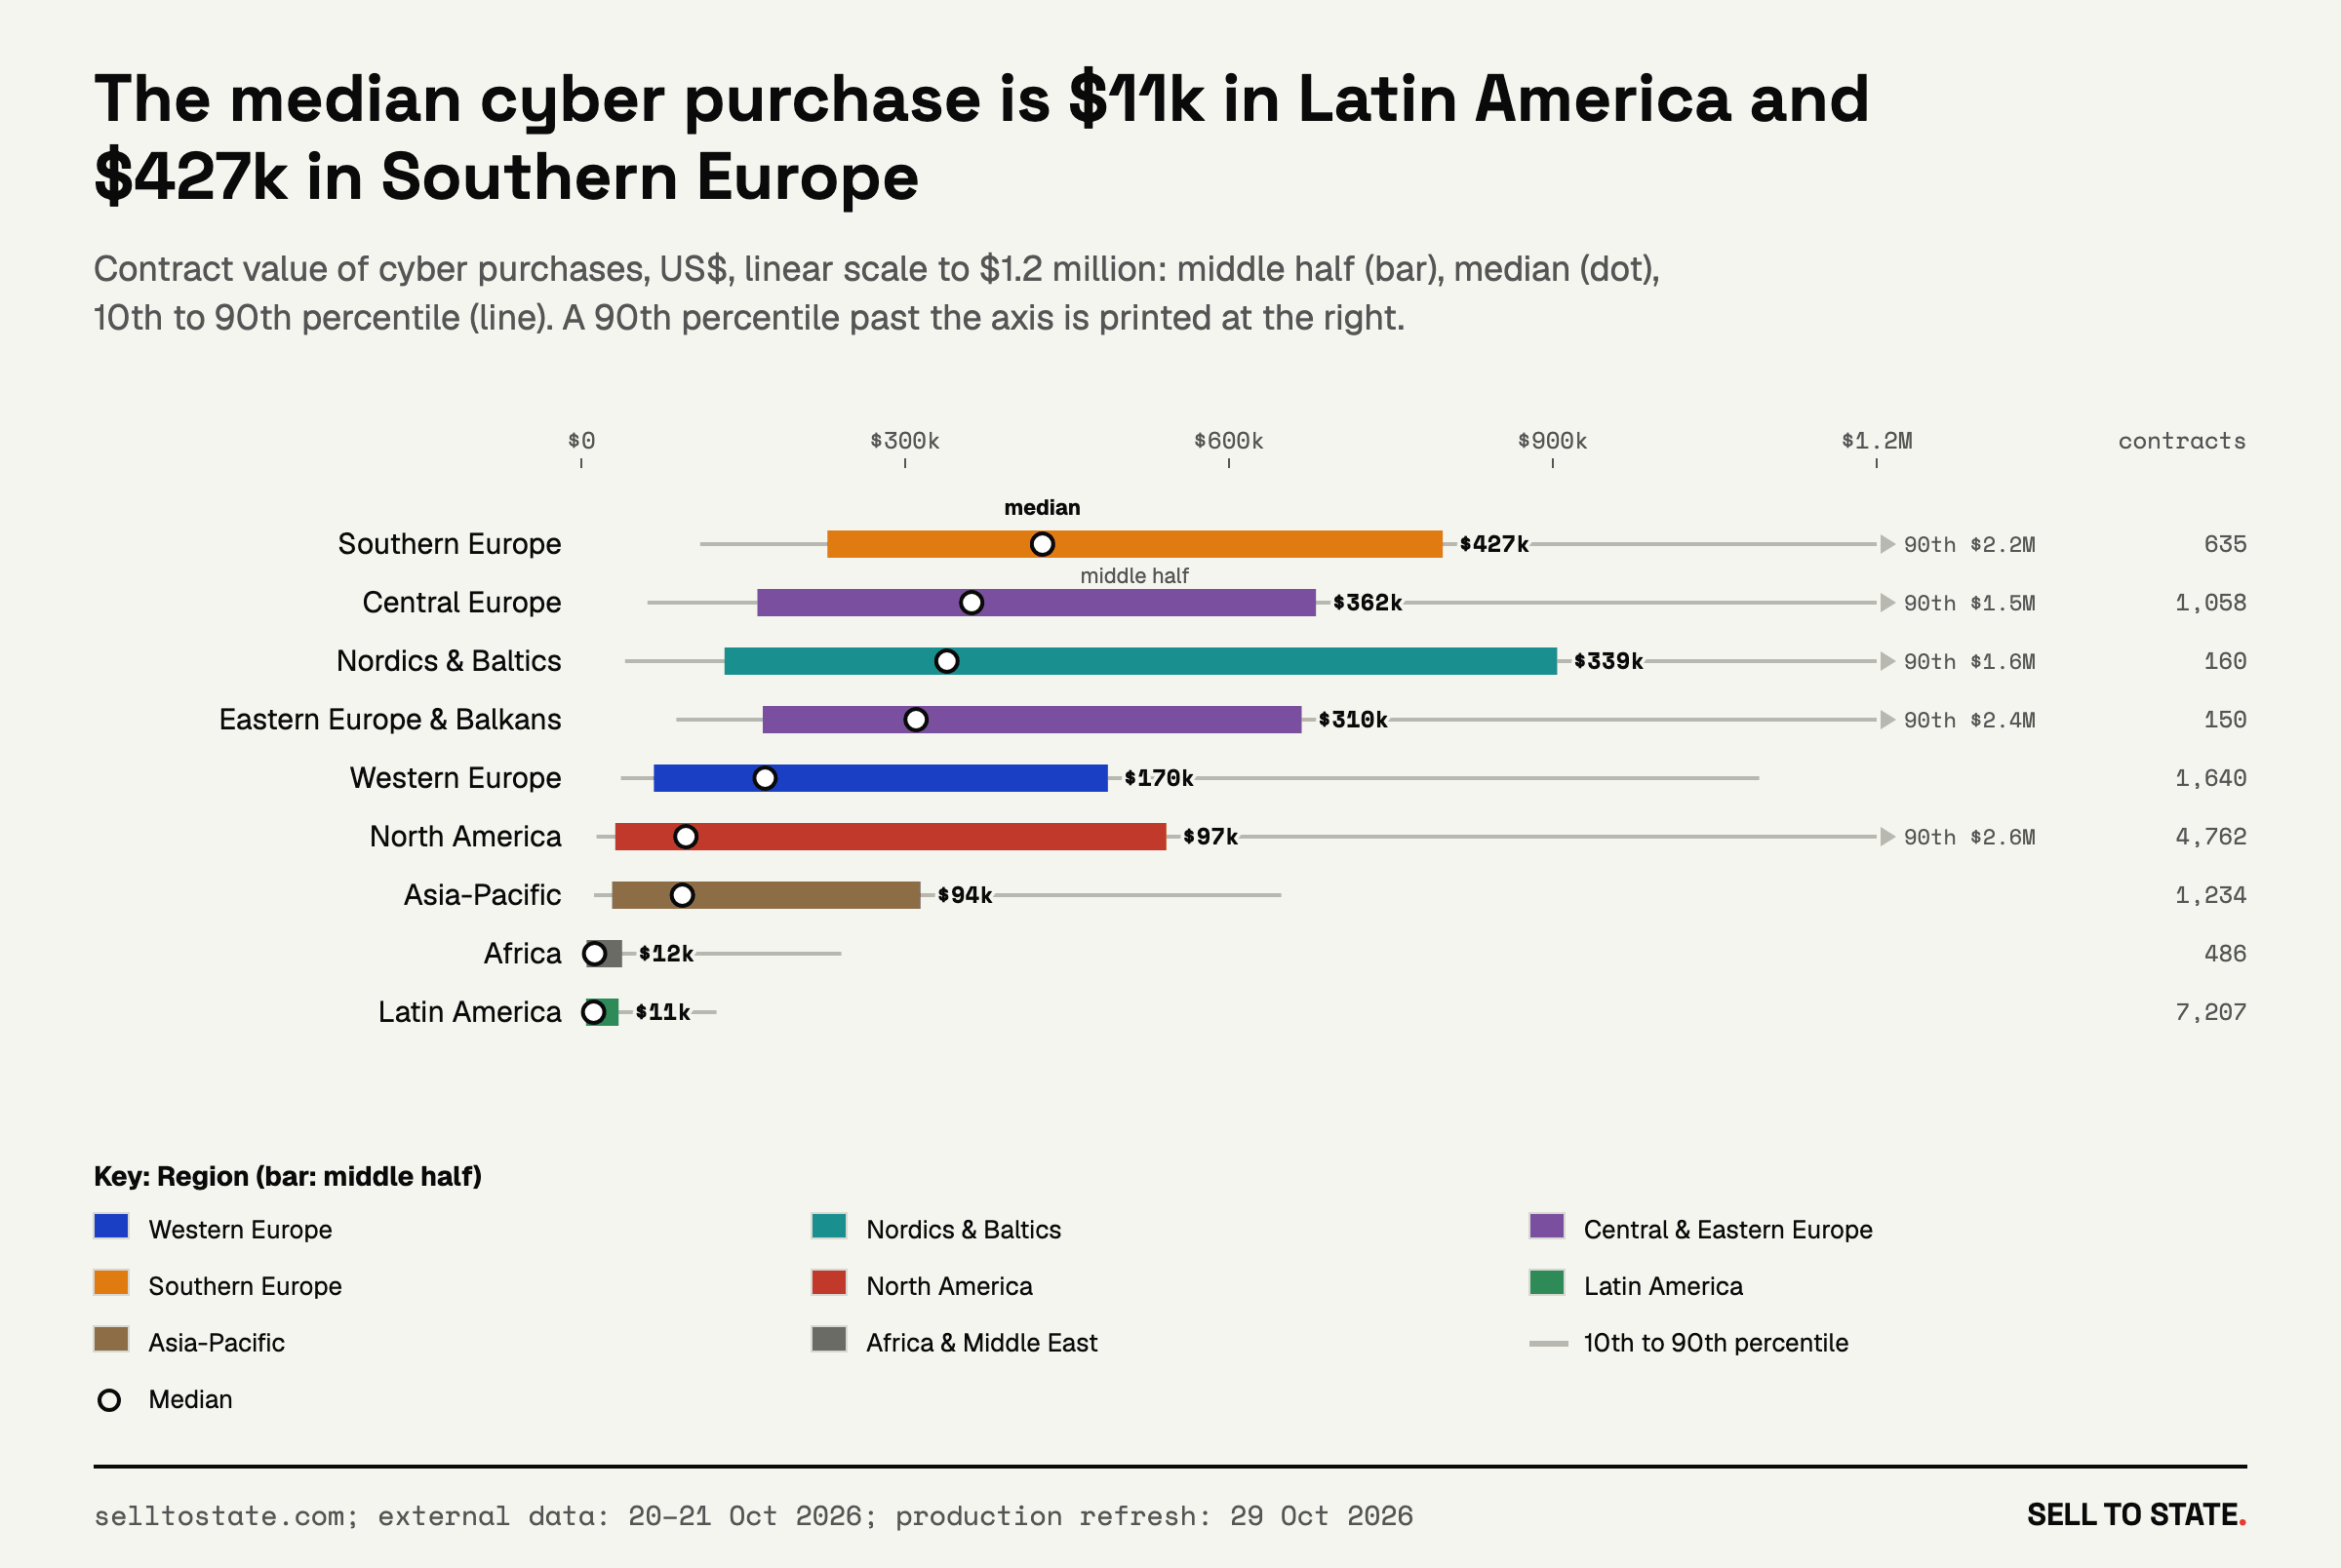
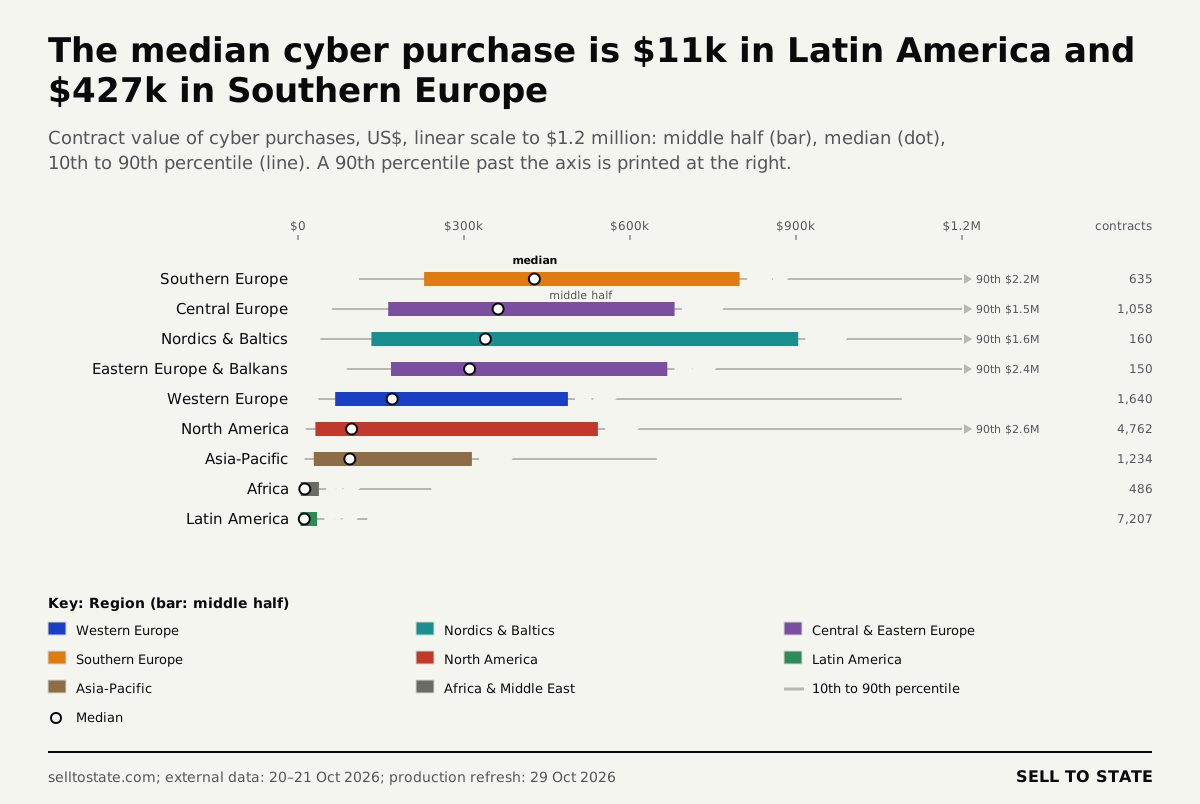
V26: The median cyber purchase is $11k in Latin America and $427k in Southern Europe. PNG · SVG
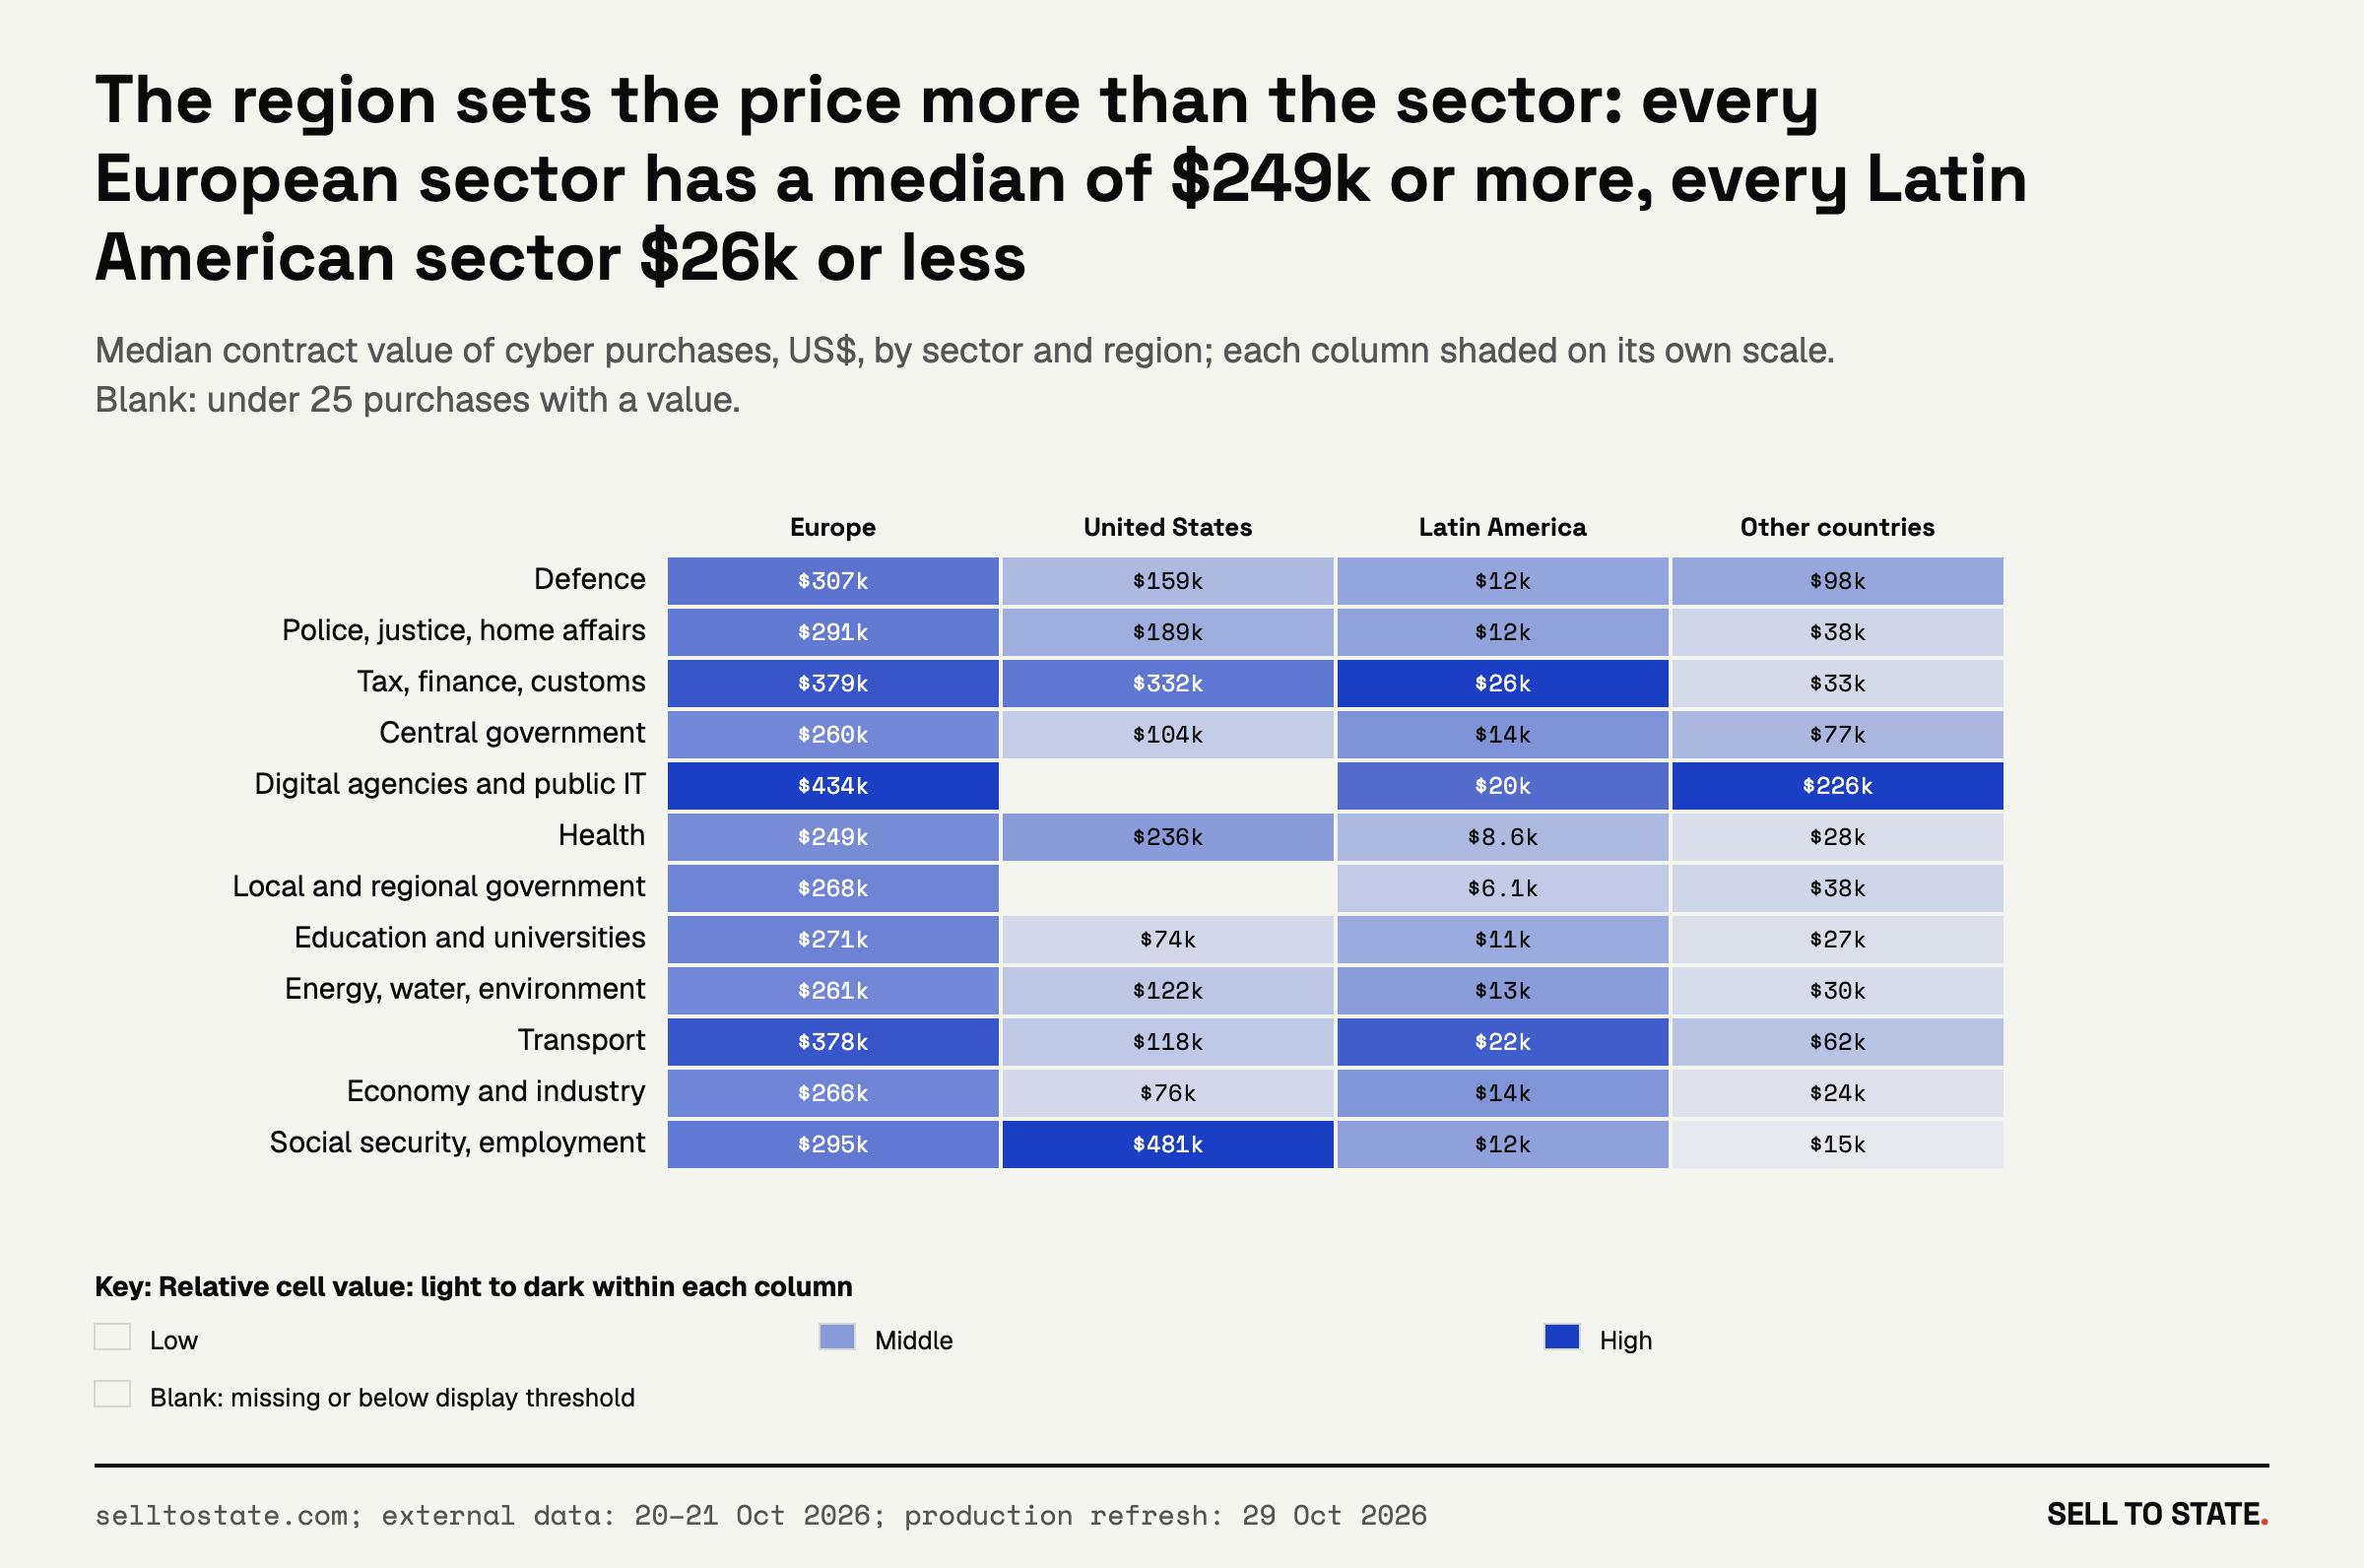
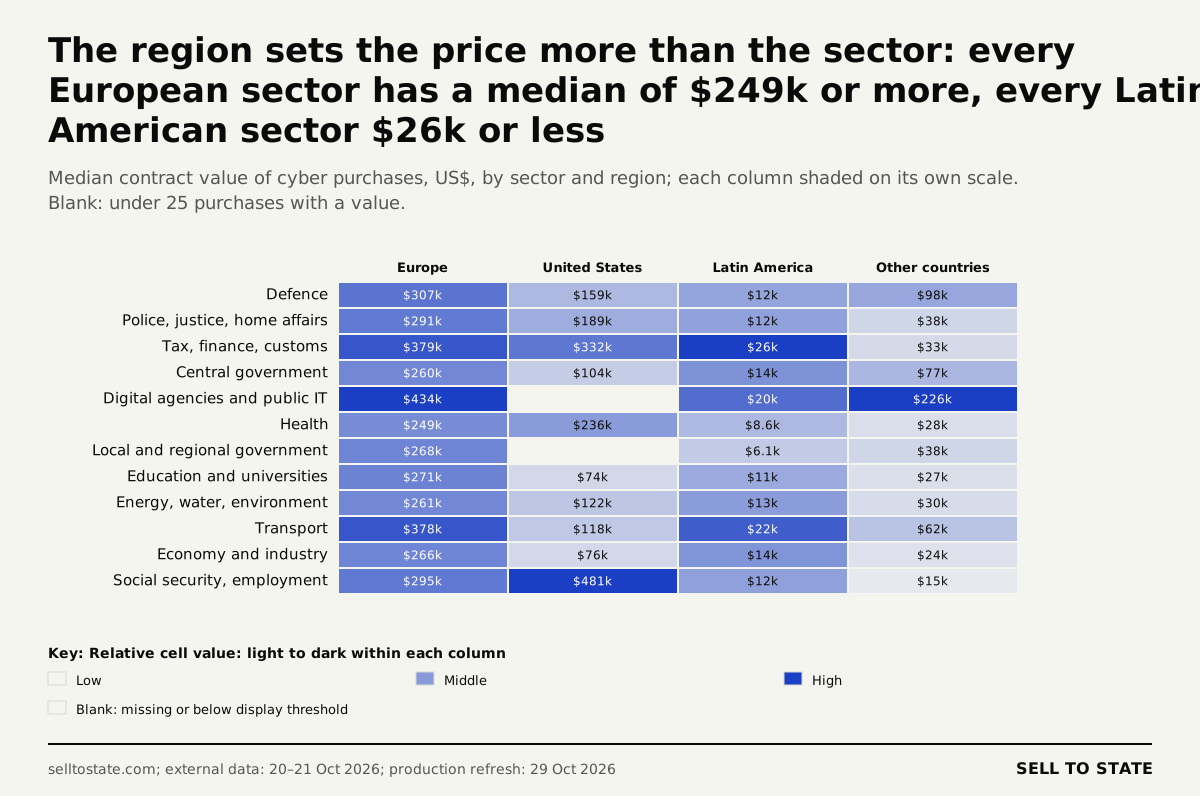
V27: The region sets the price more than the sector: every European sector has a median of $249k or more, every Latin American sector $26k or less. PNG · SVG
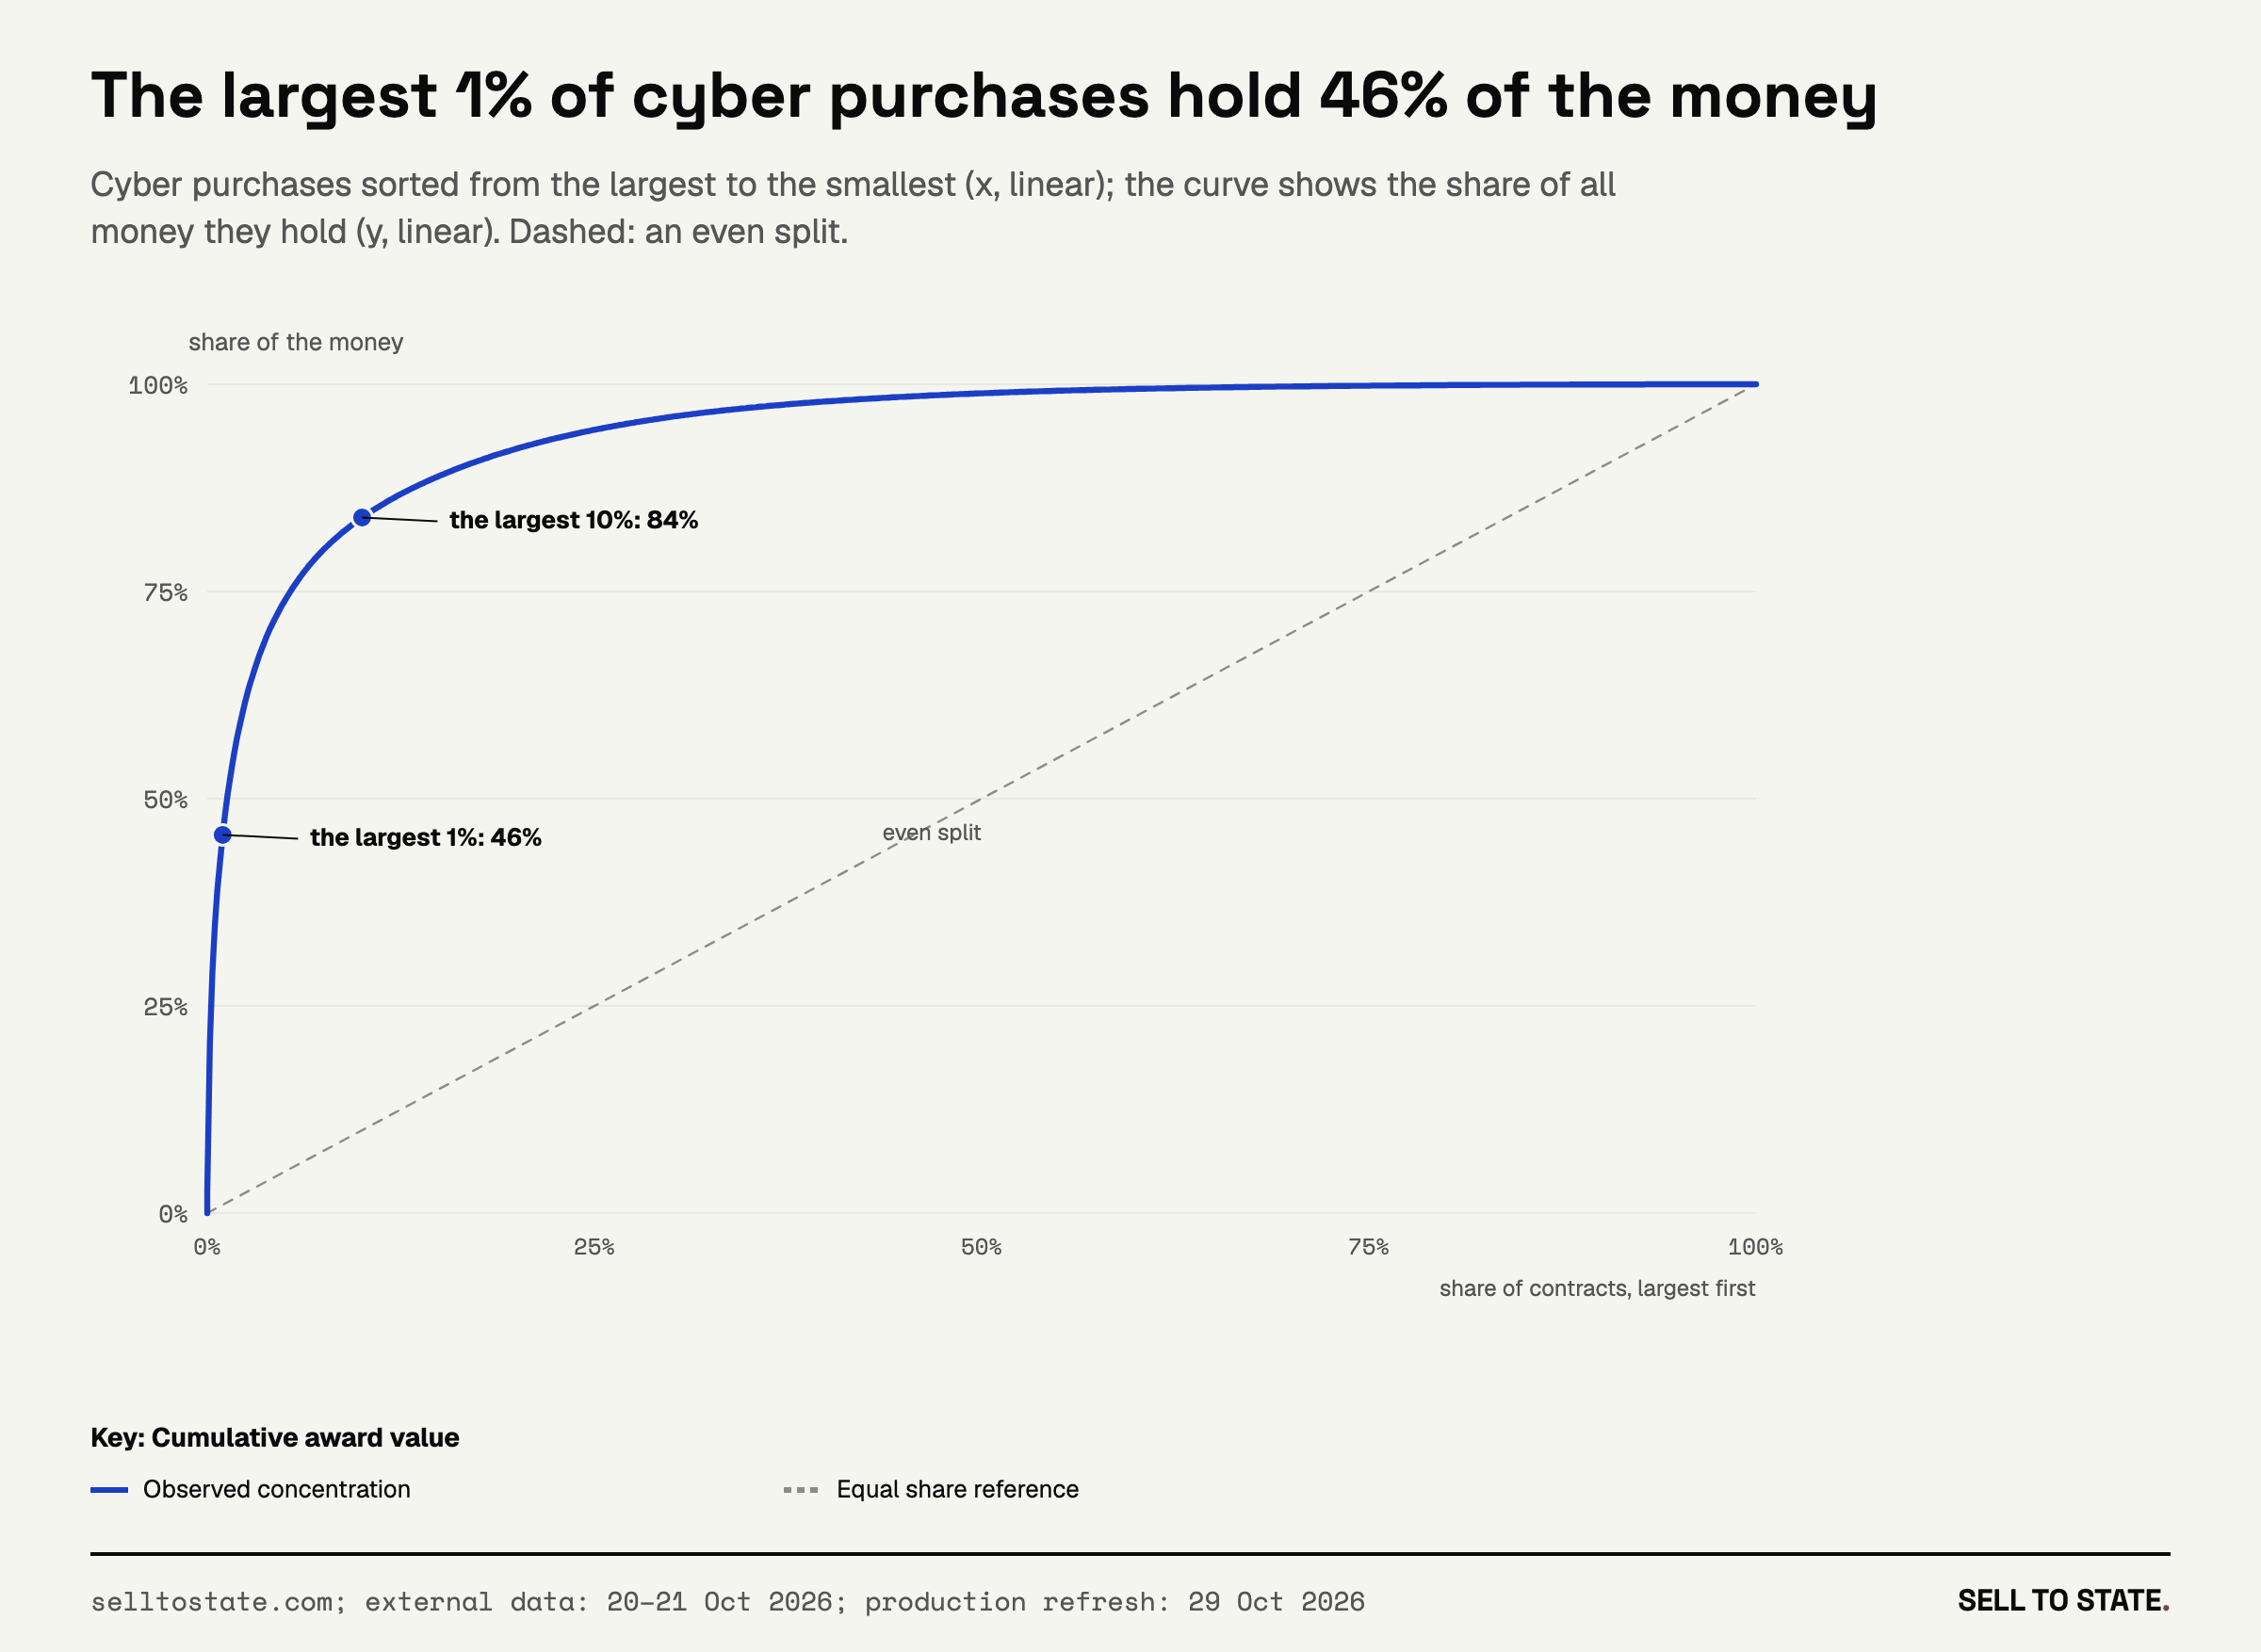
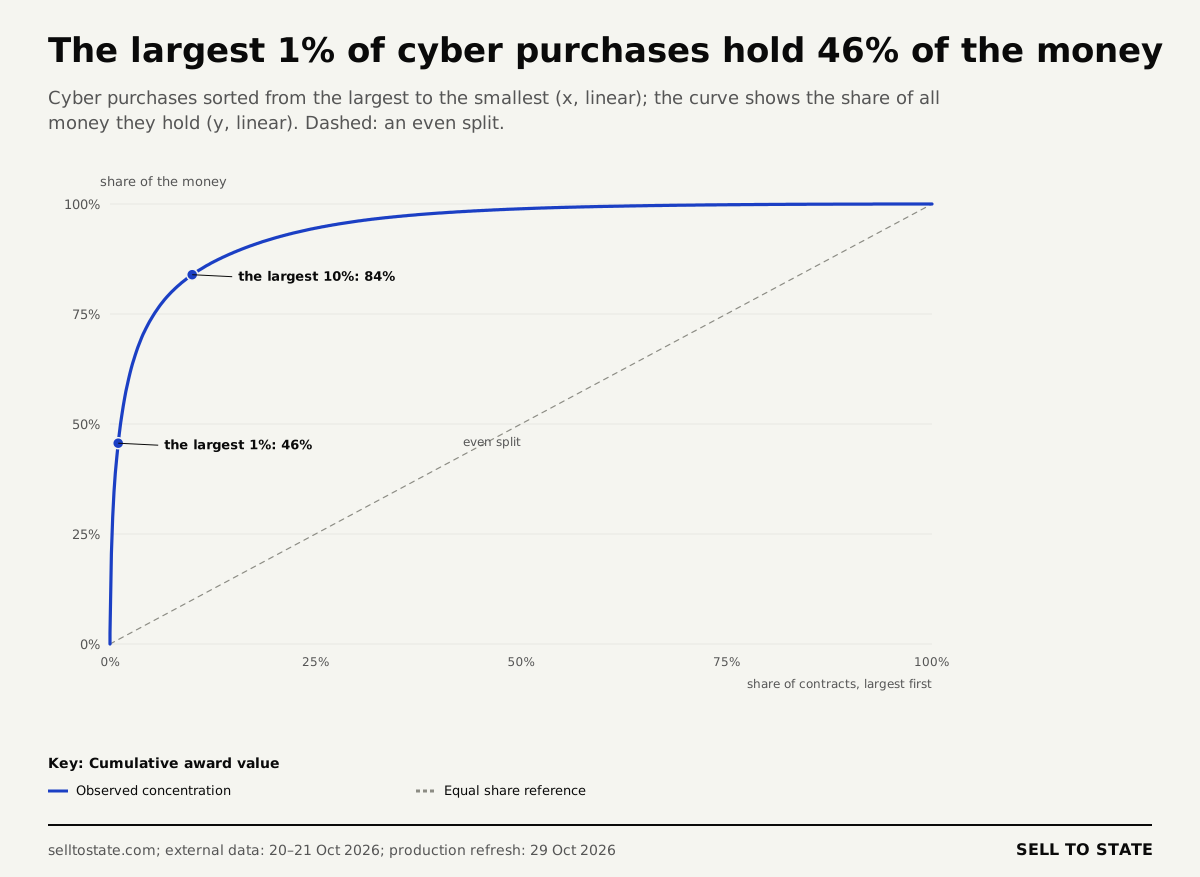
V28: The largest 1% of cyber purchases hold 46% of the money. PNG · SVG
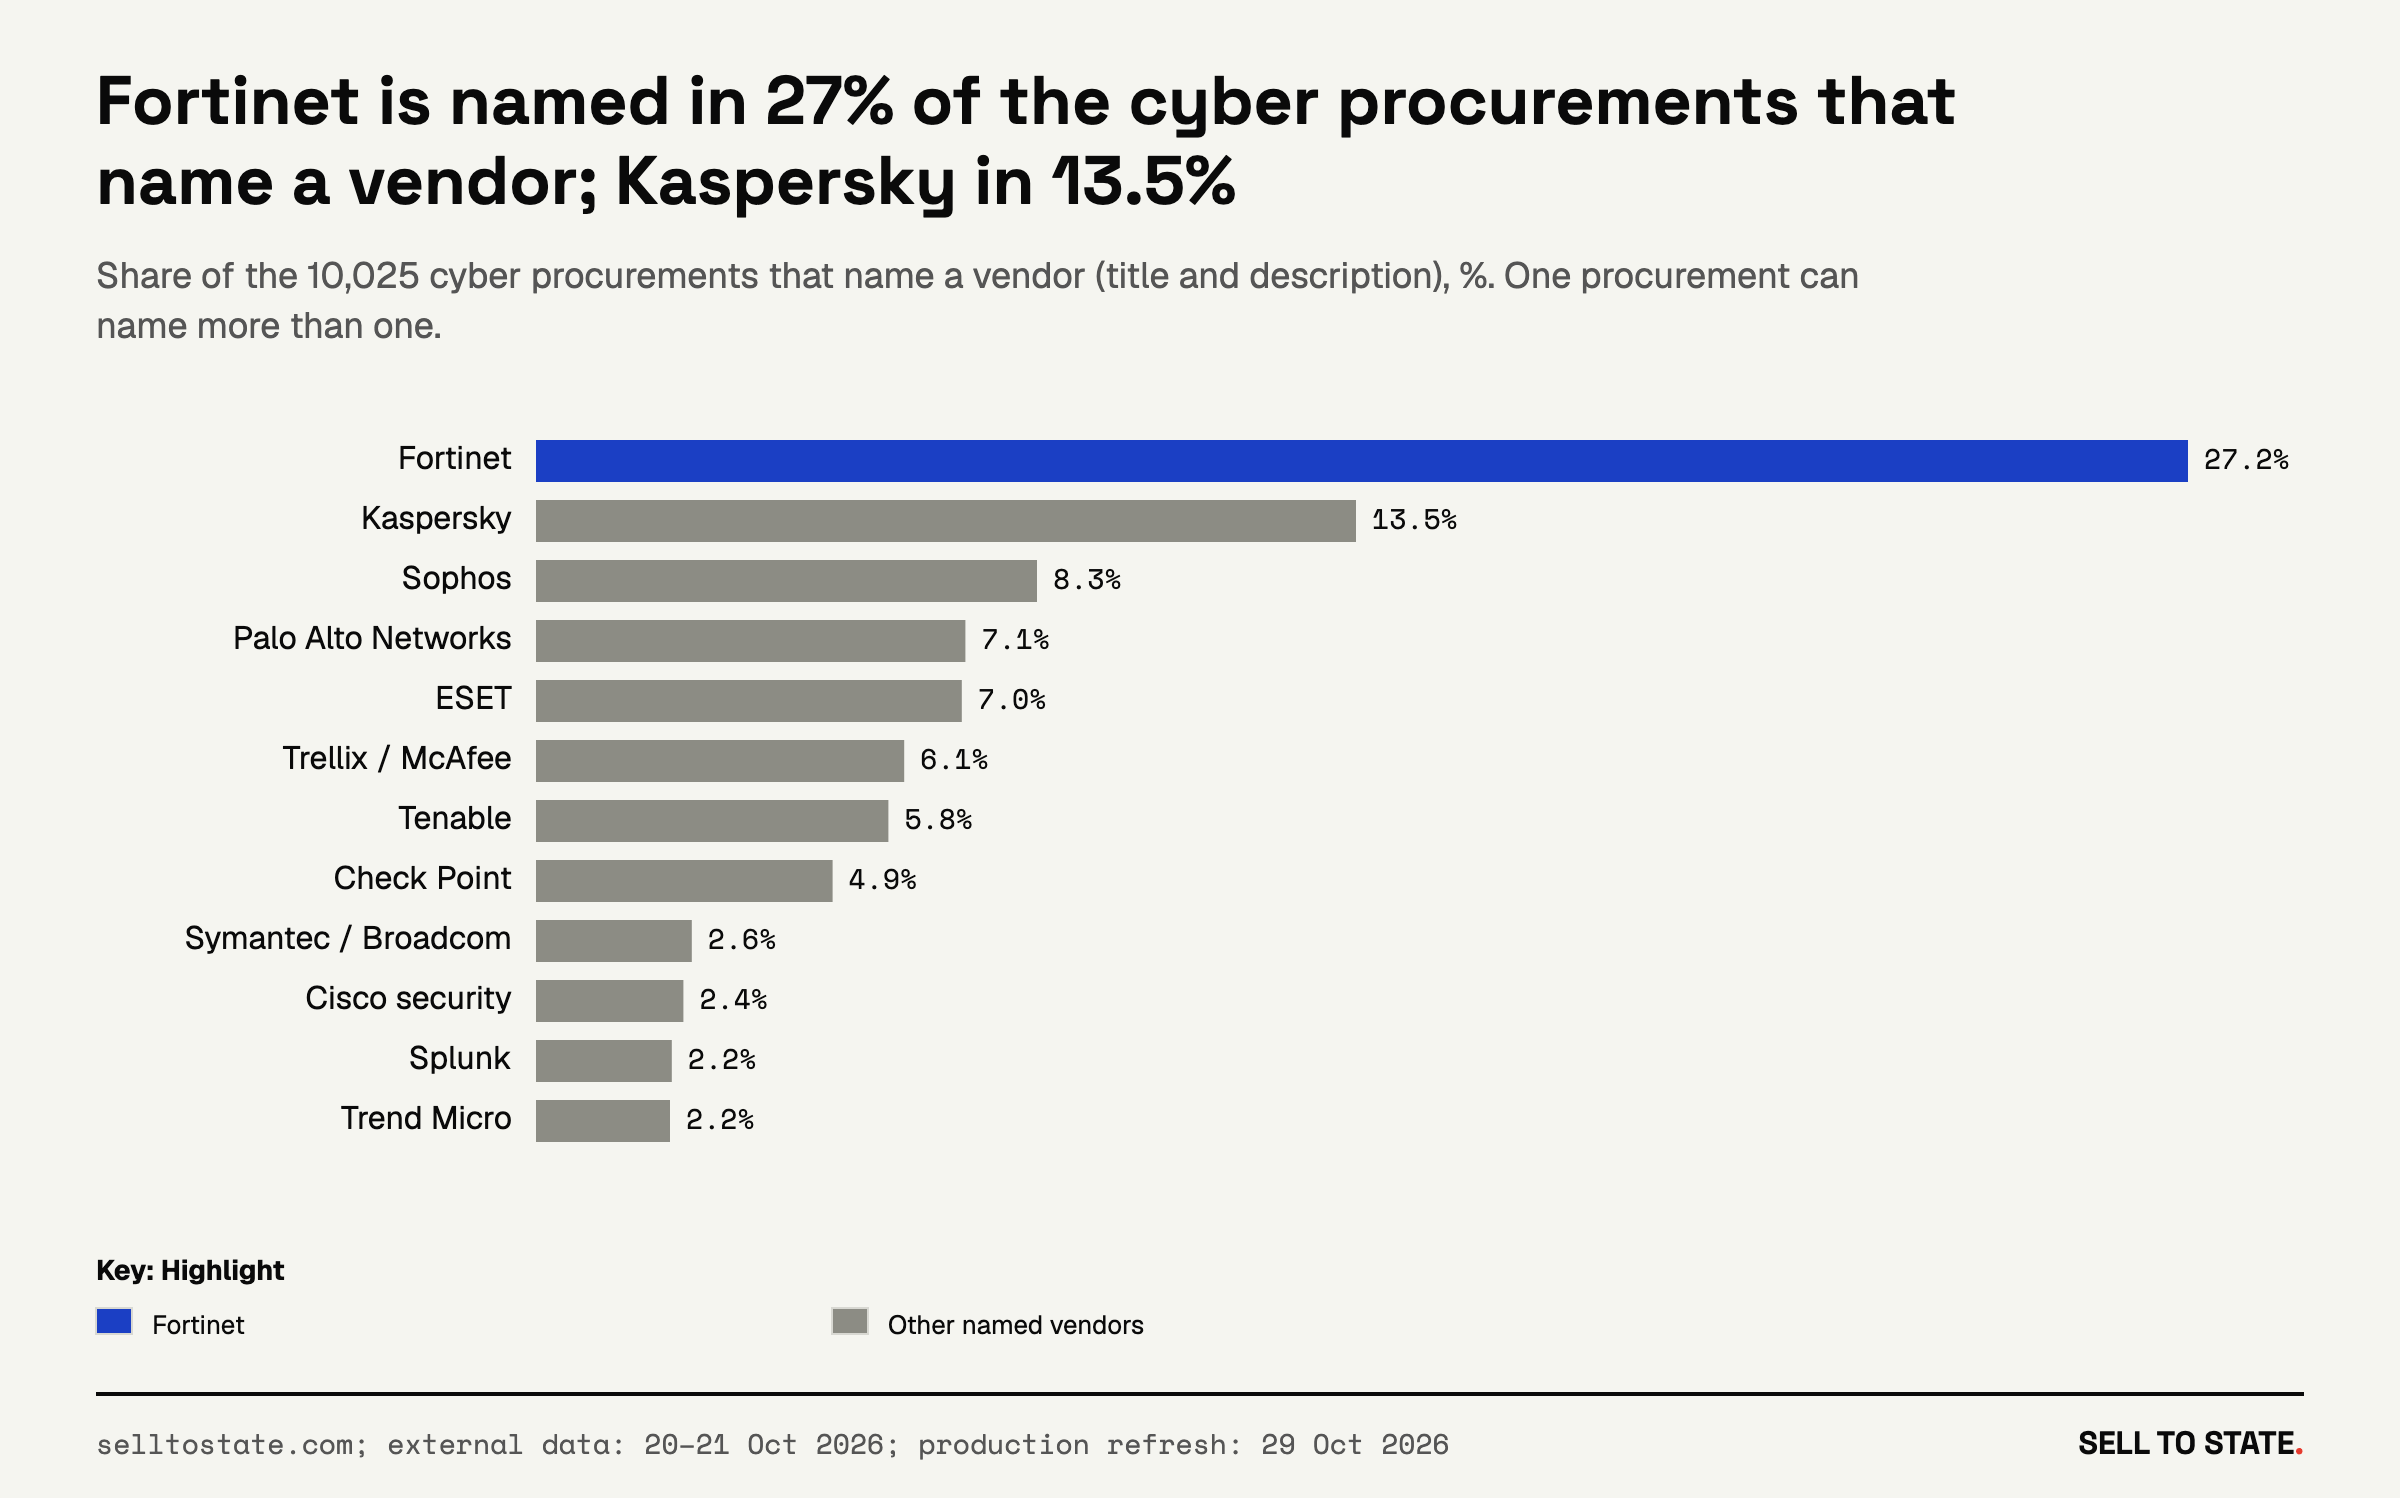
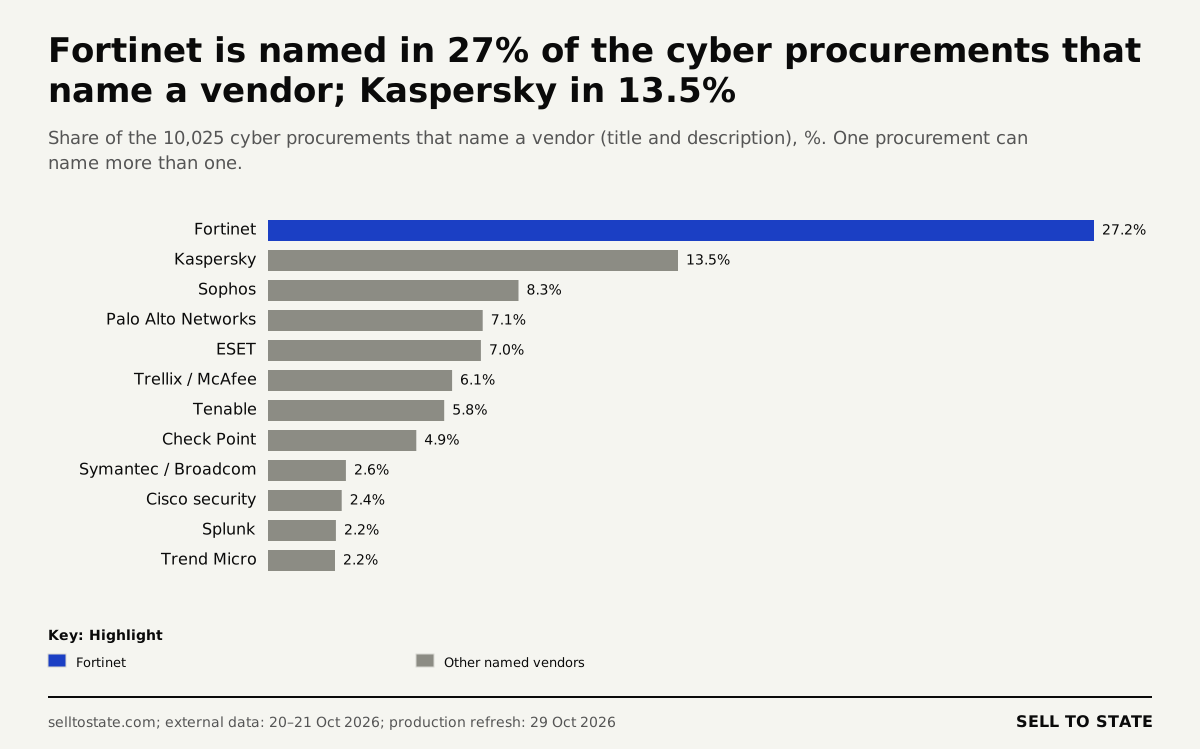
V29: Fortinet is named in 27% of the cyber procurements that name a vendor; Kaspersky in 13.5%. PNG · SVG
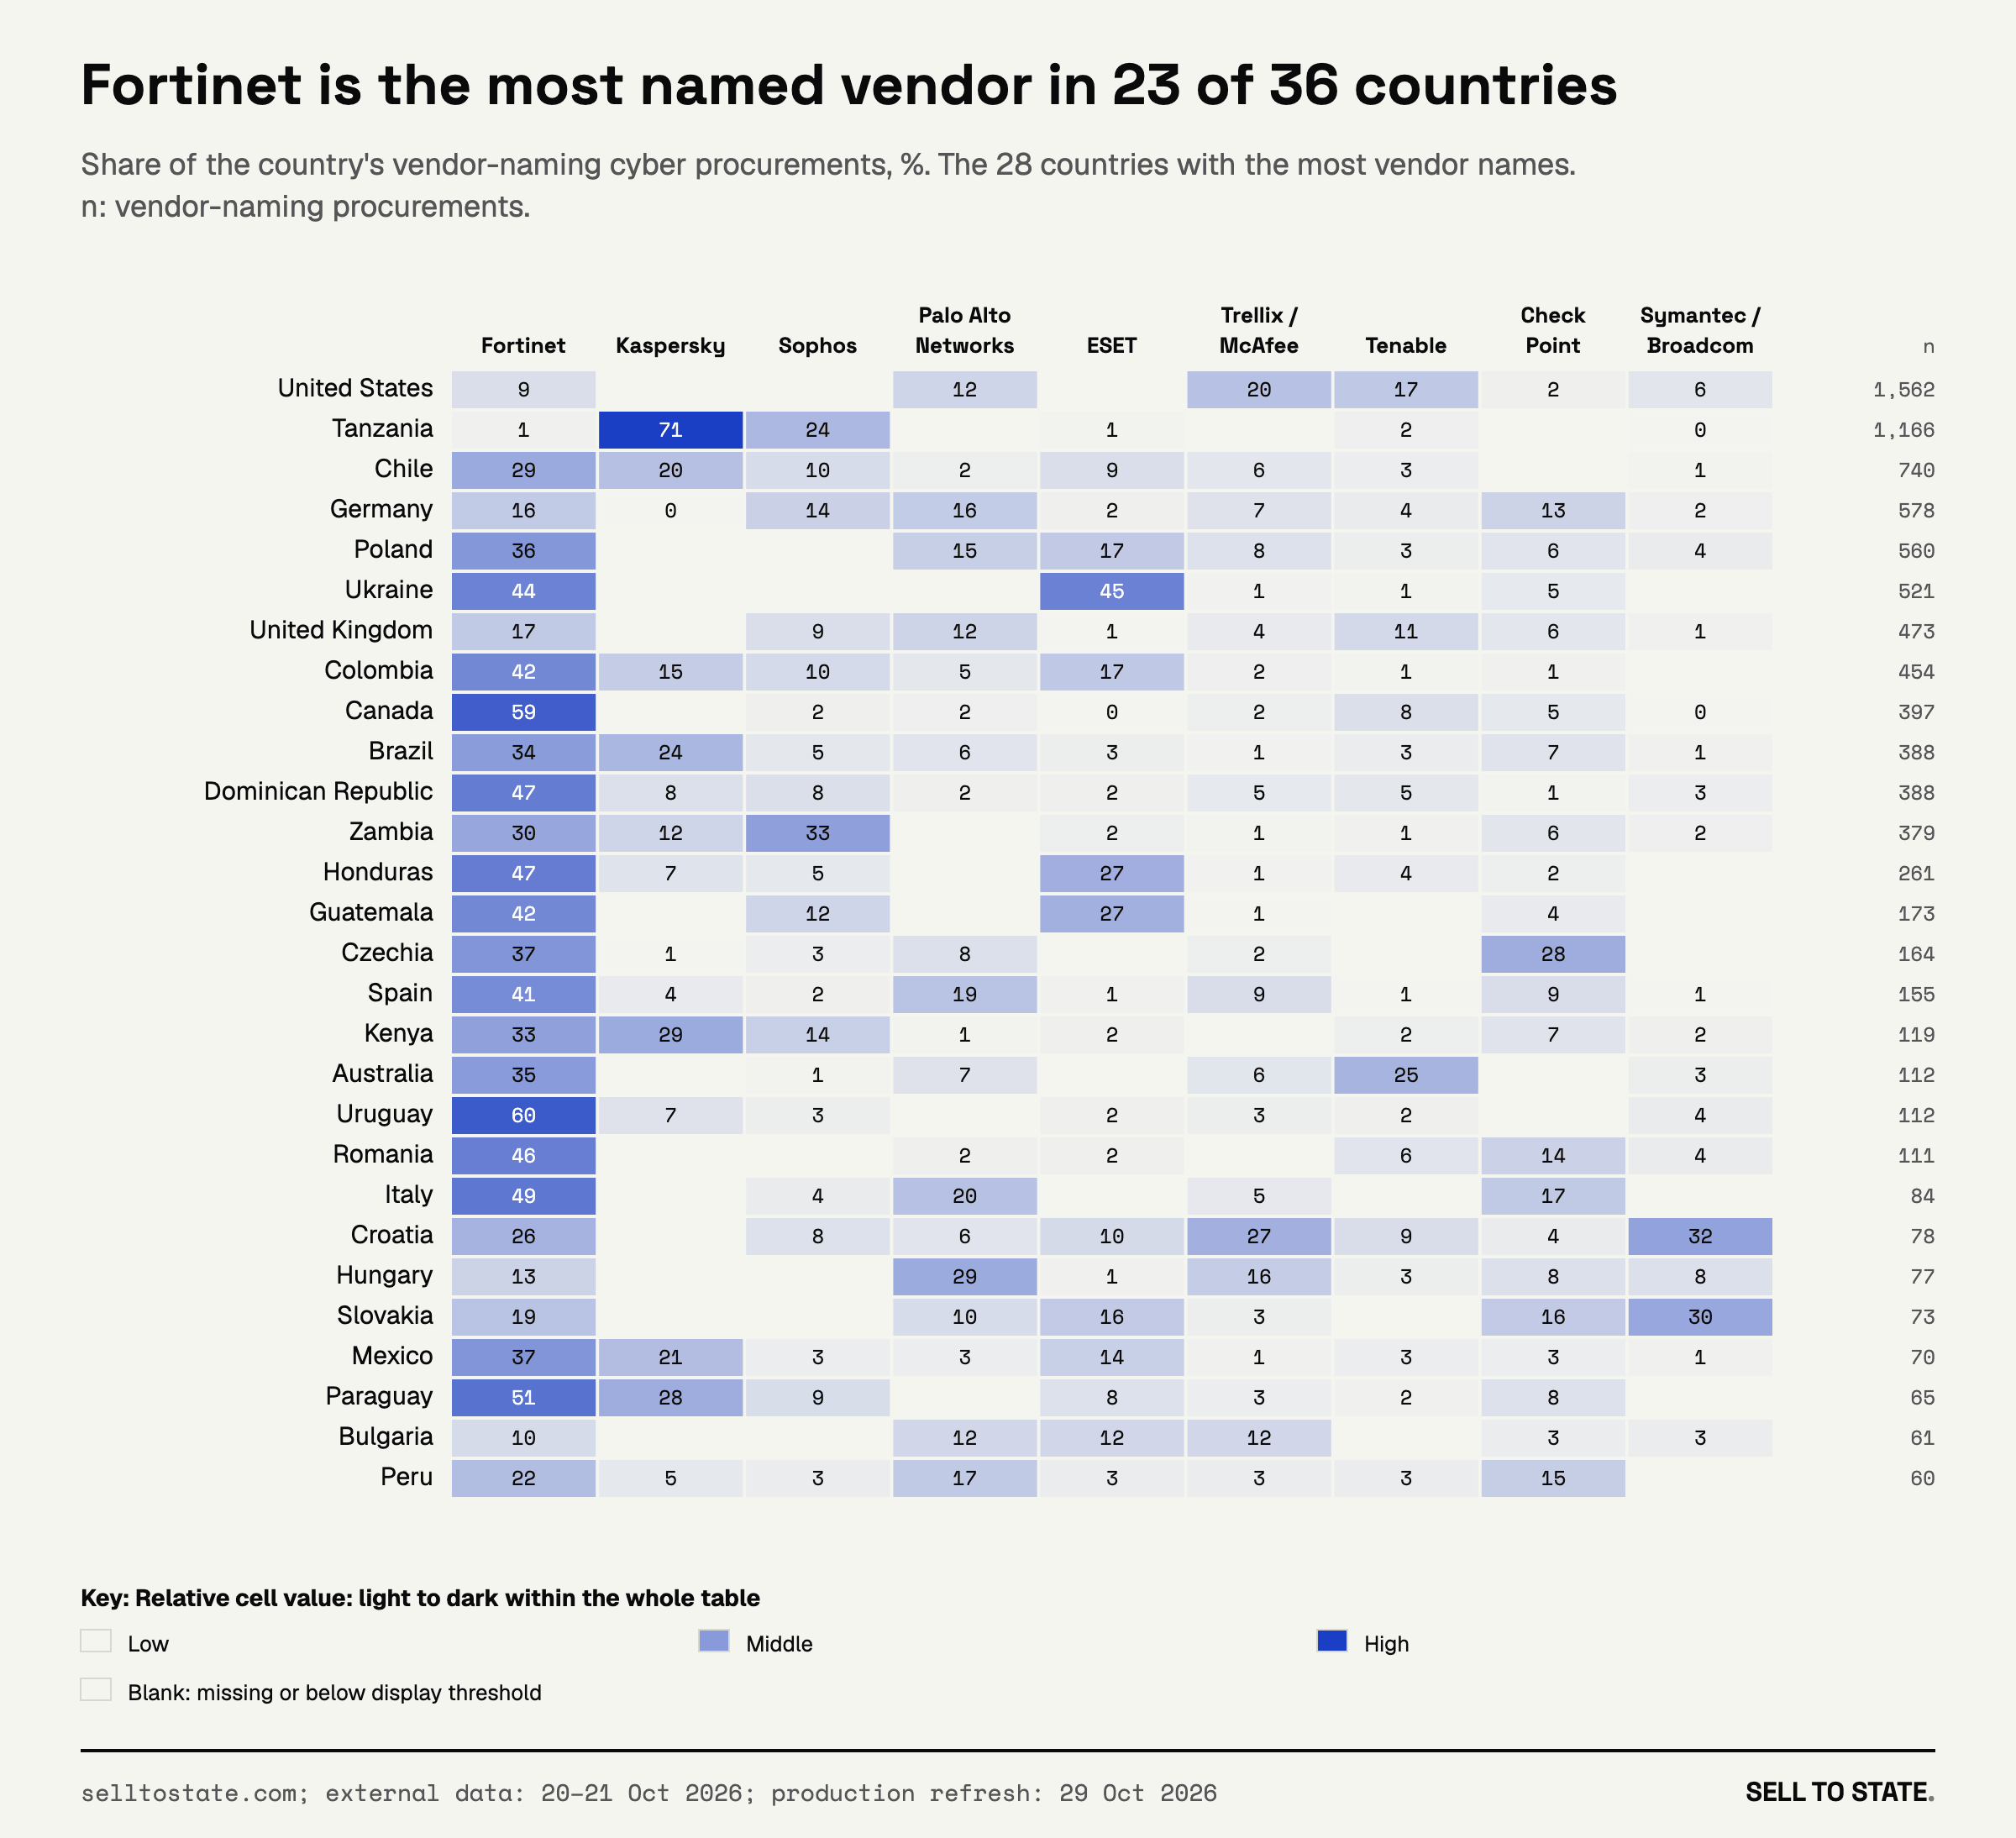
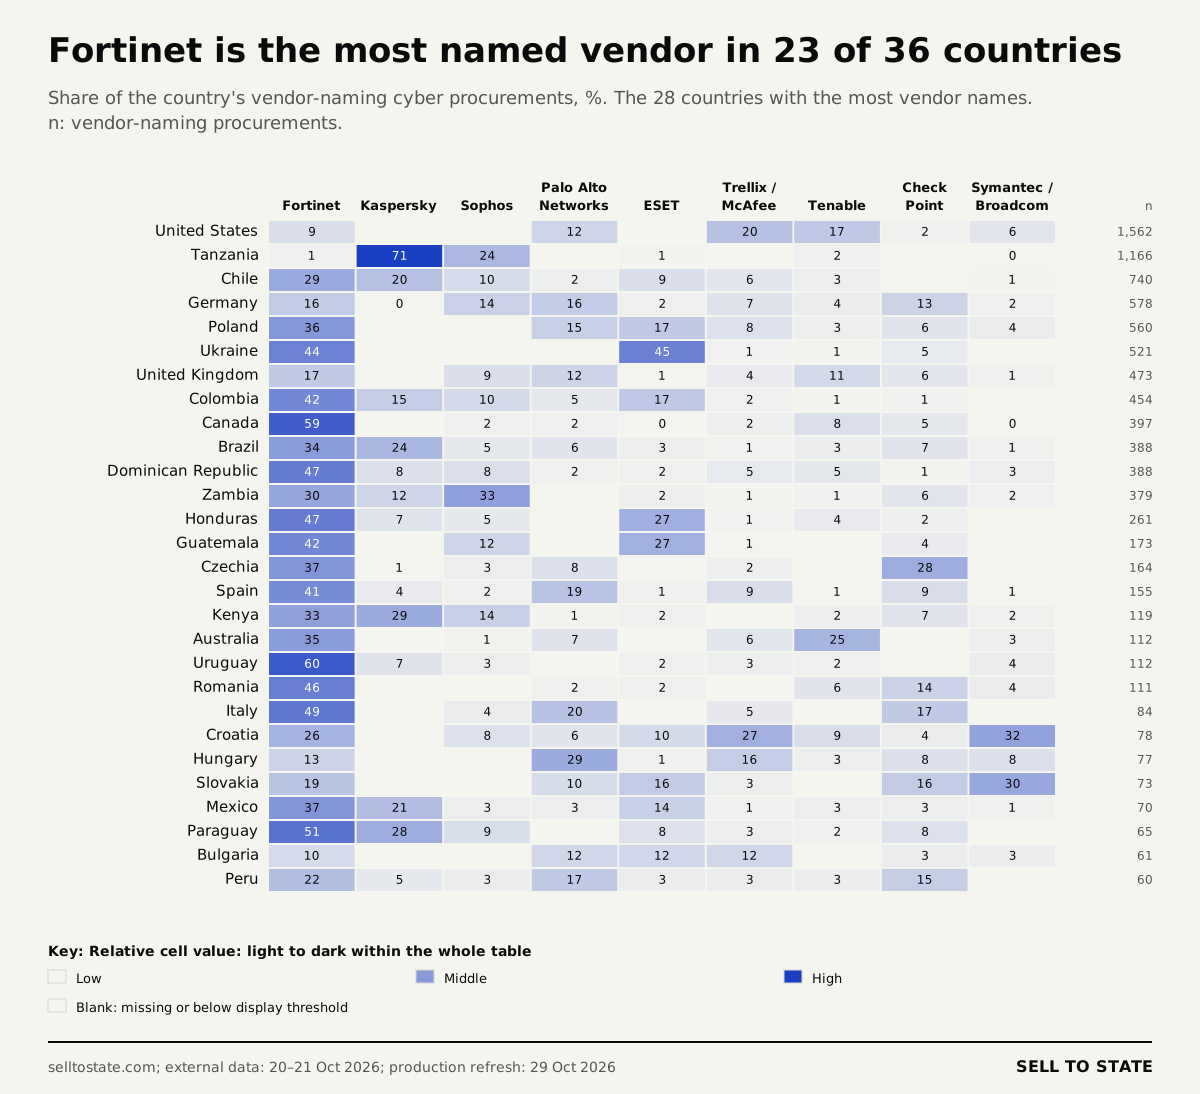
V30: Fortinet is the most named vendor in 23 of 36 countries. PNG · SVG
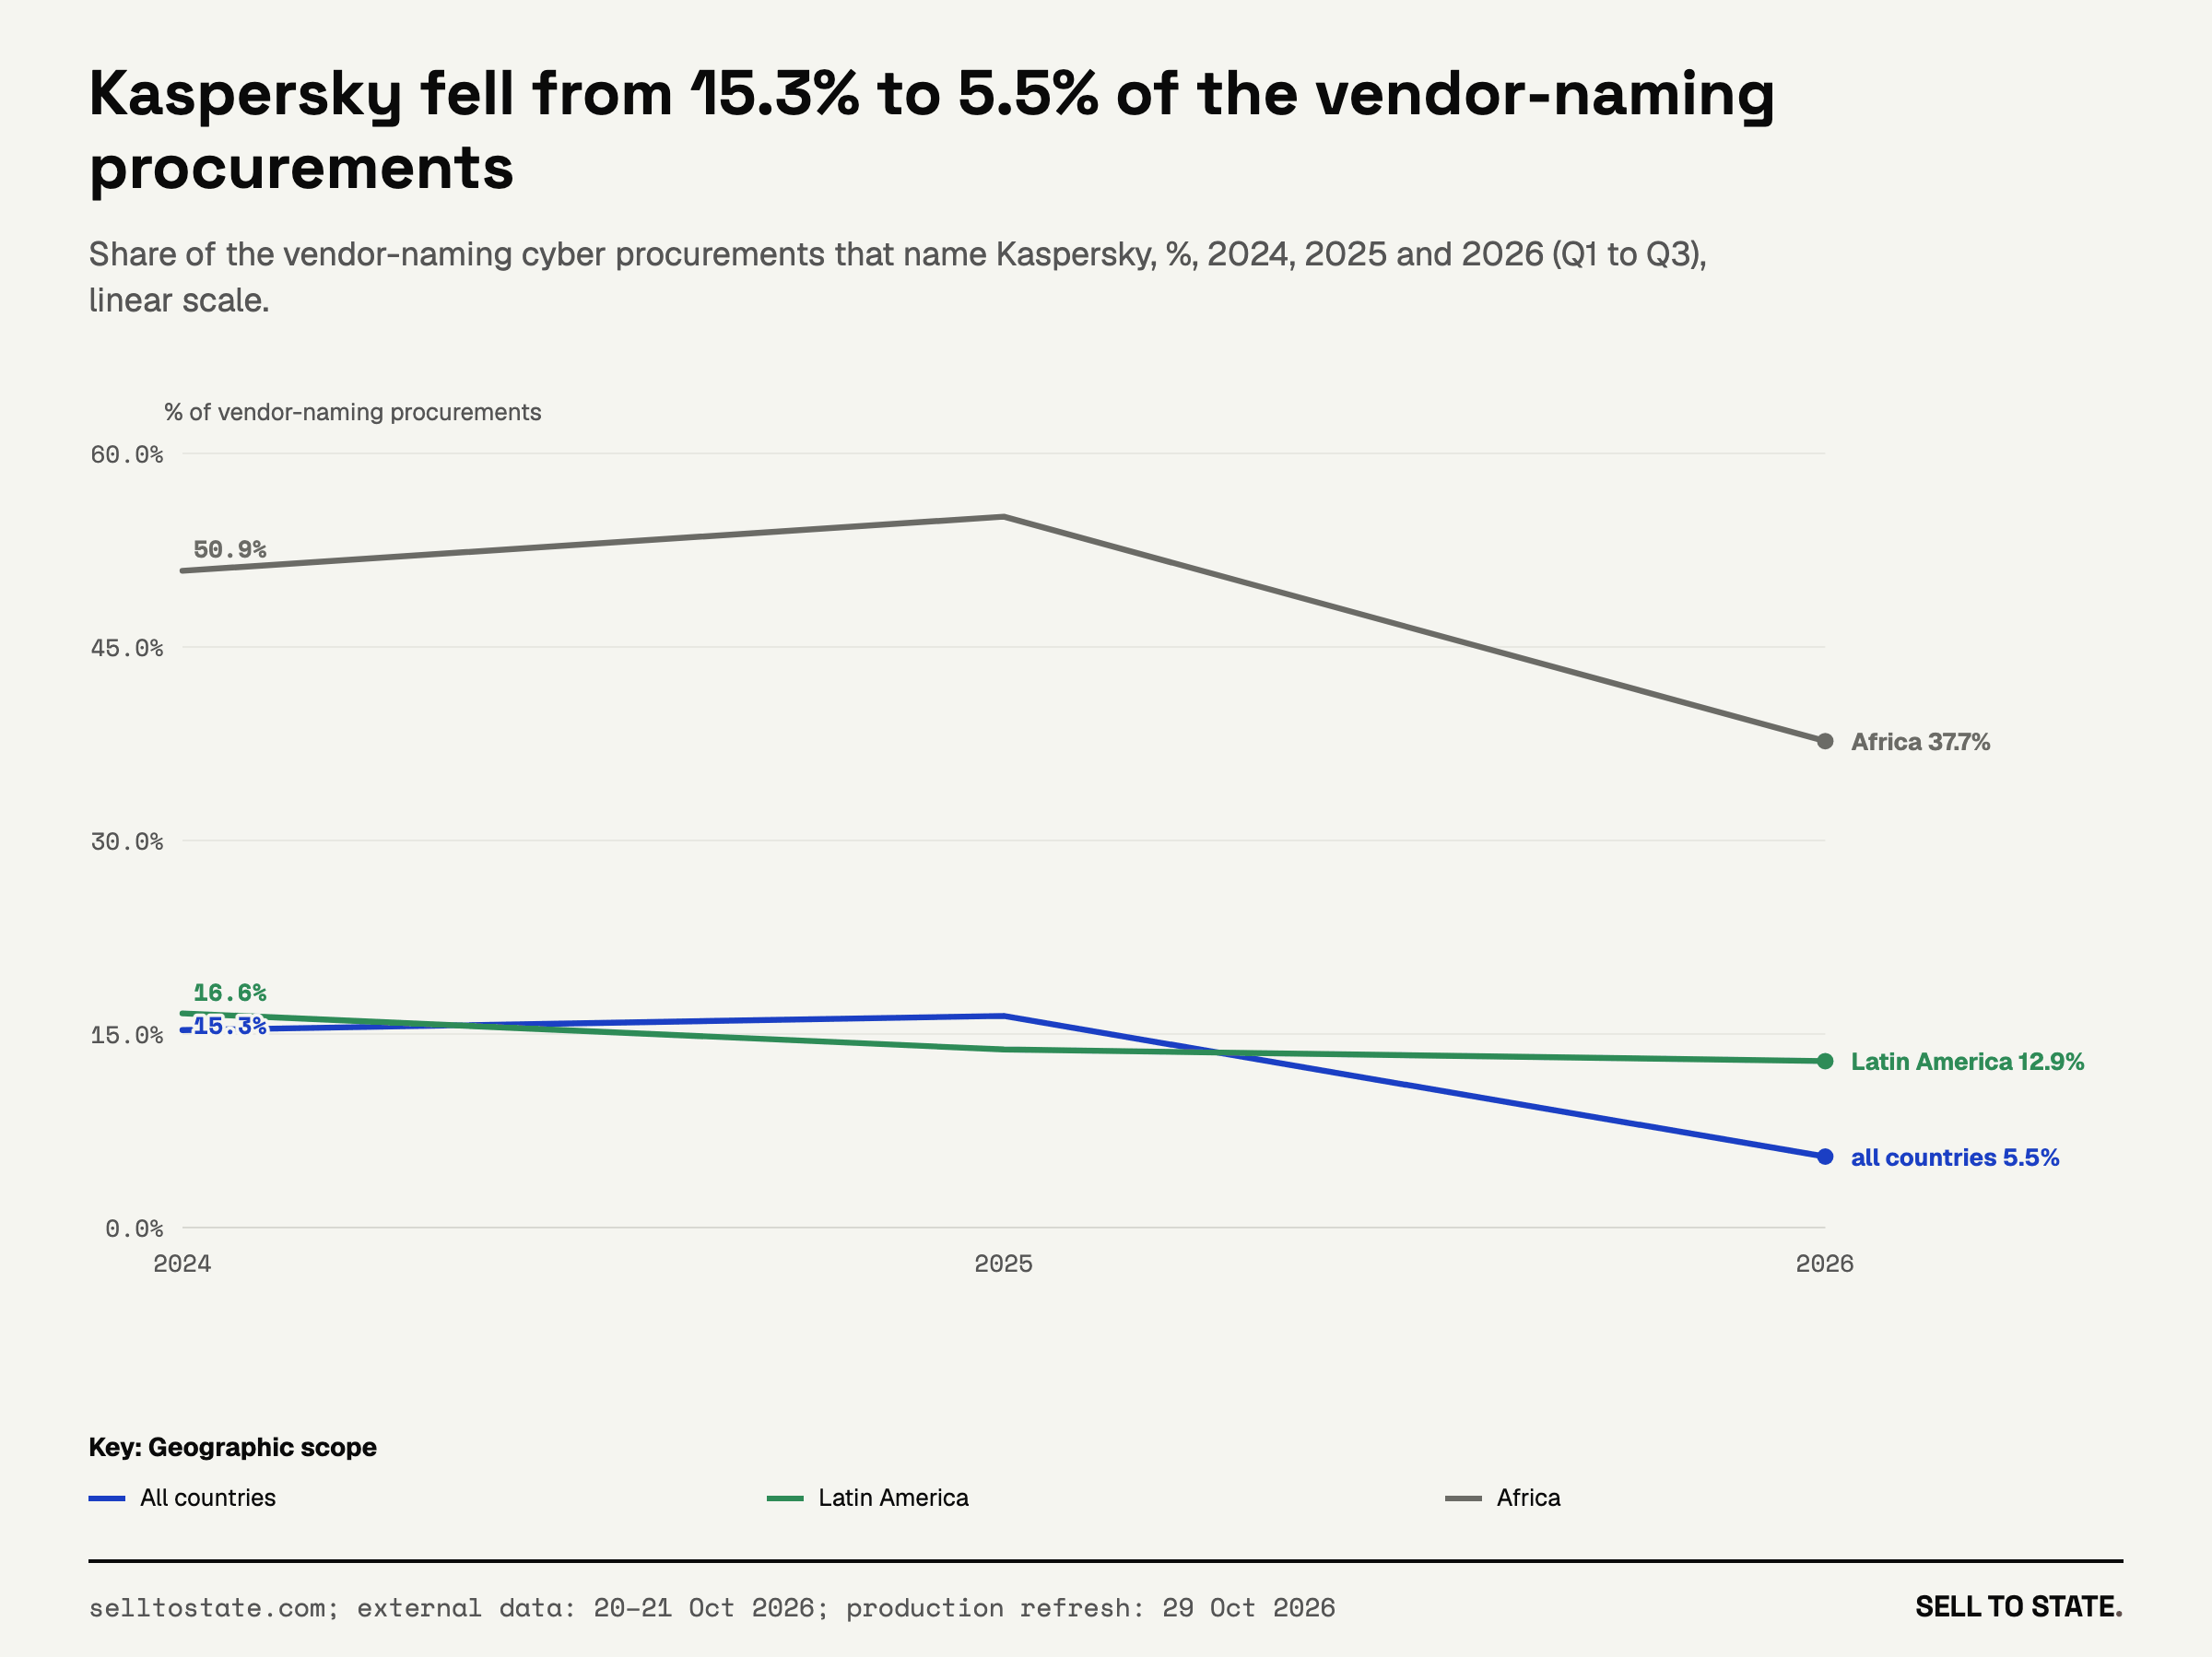
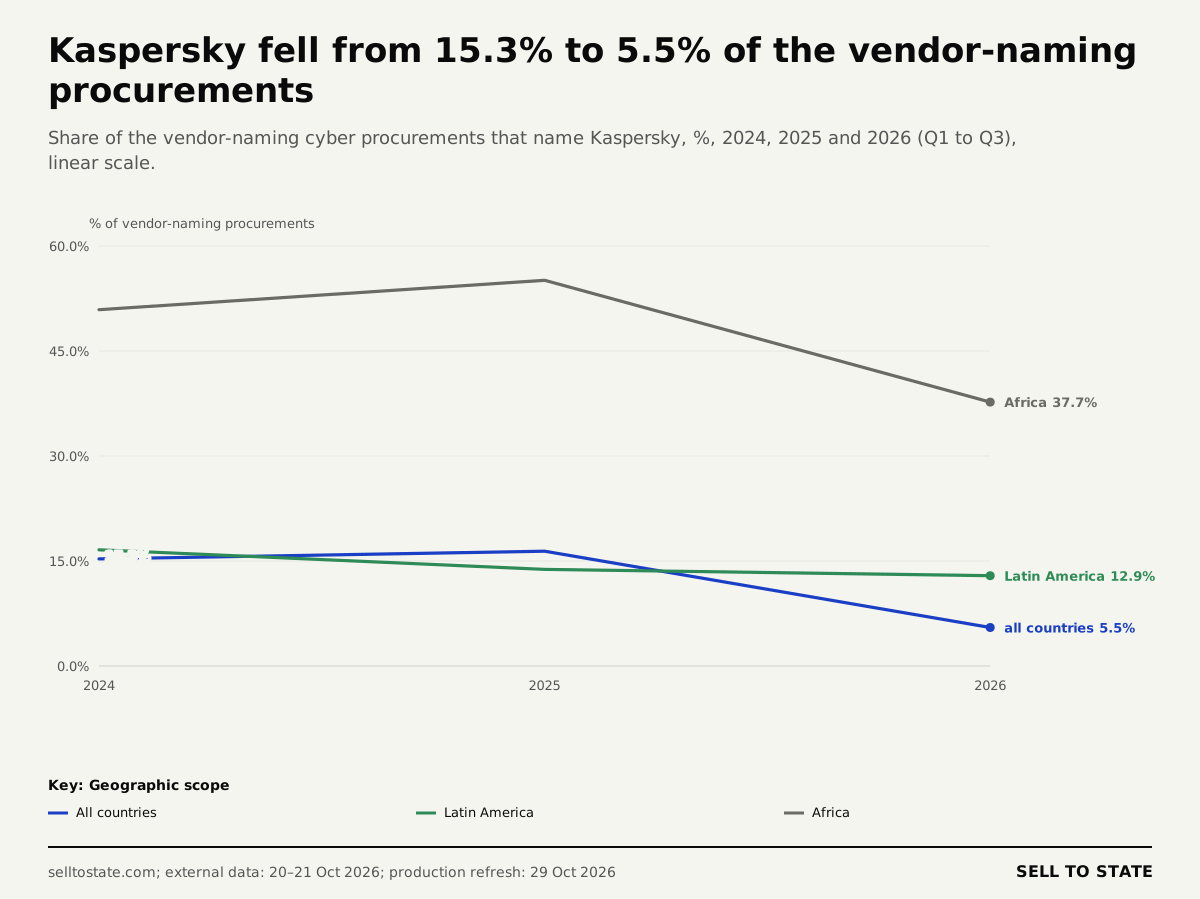
V31: Kaspersky fell from 15.3% to 5.5% of the vendor-naming procurements. PNG · SVG
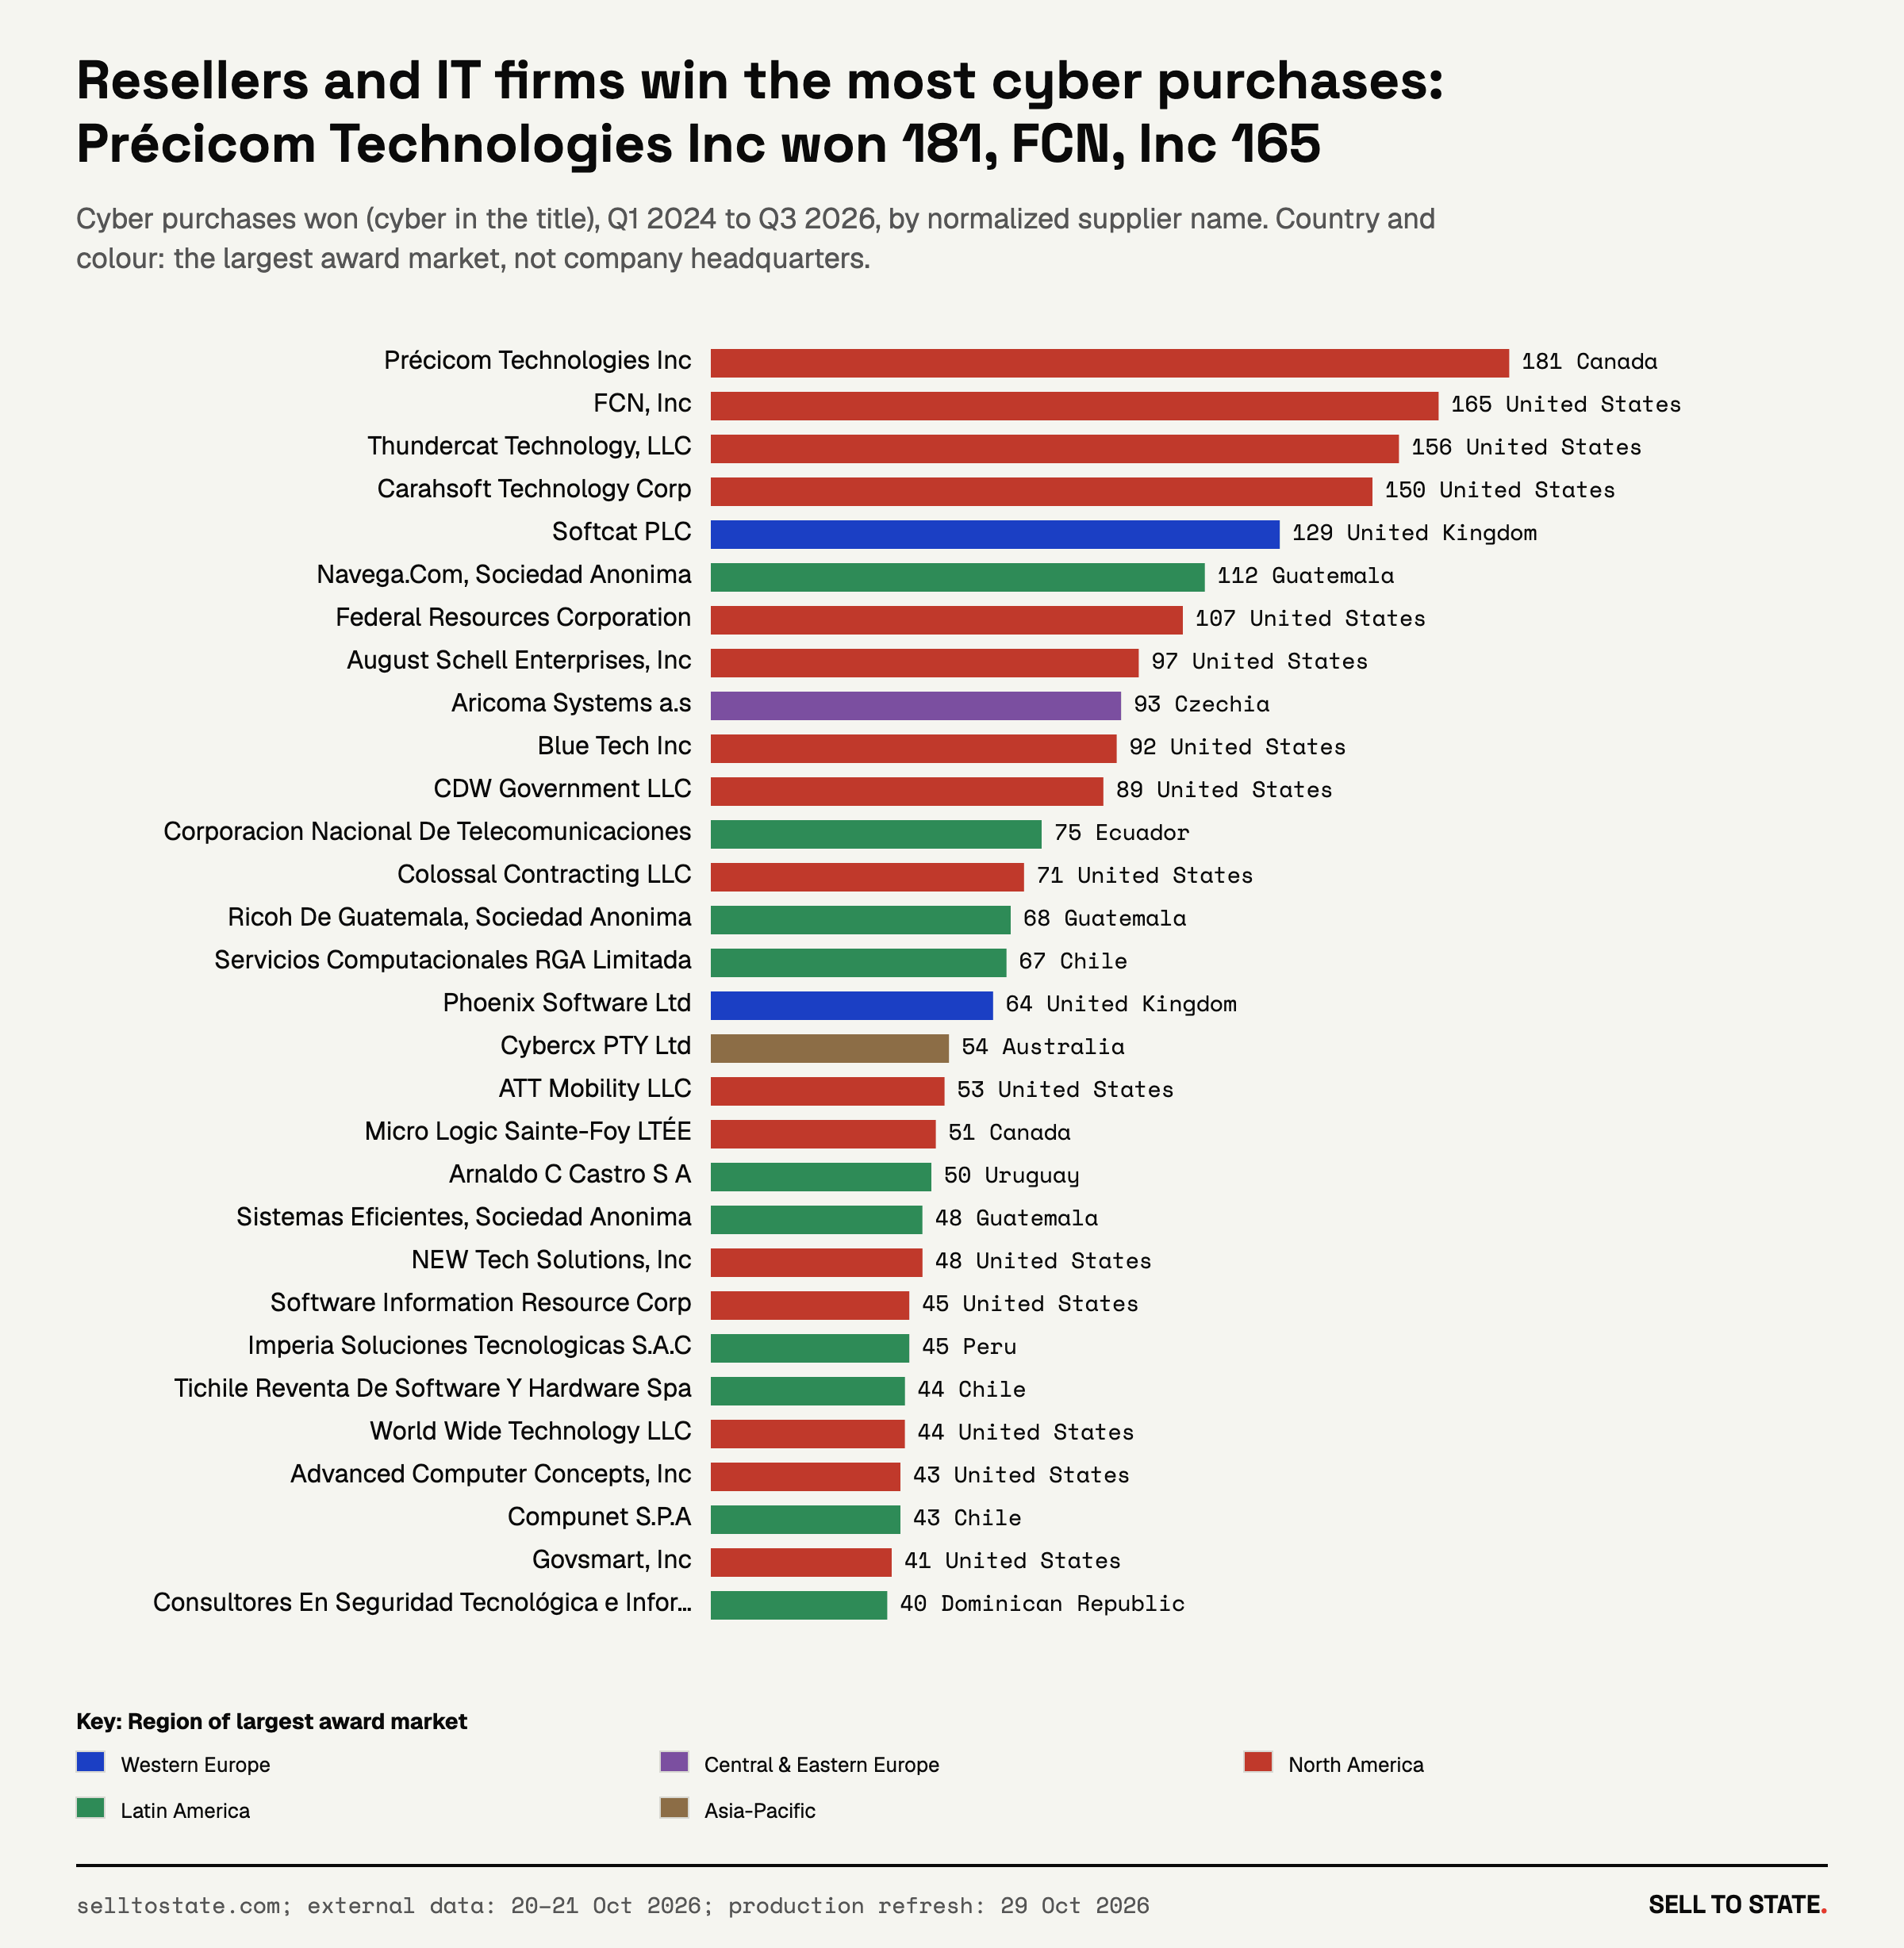
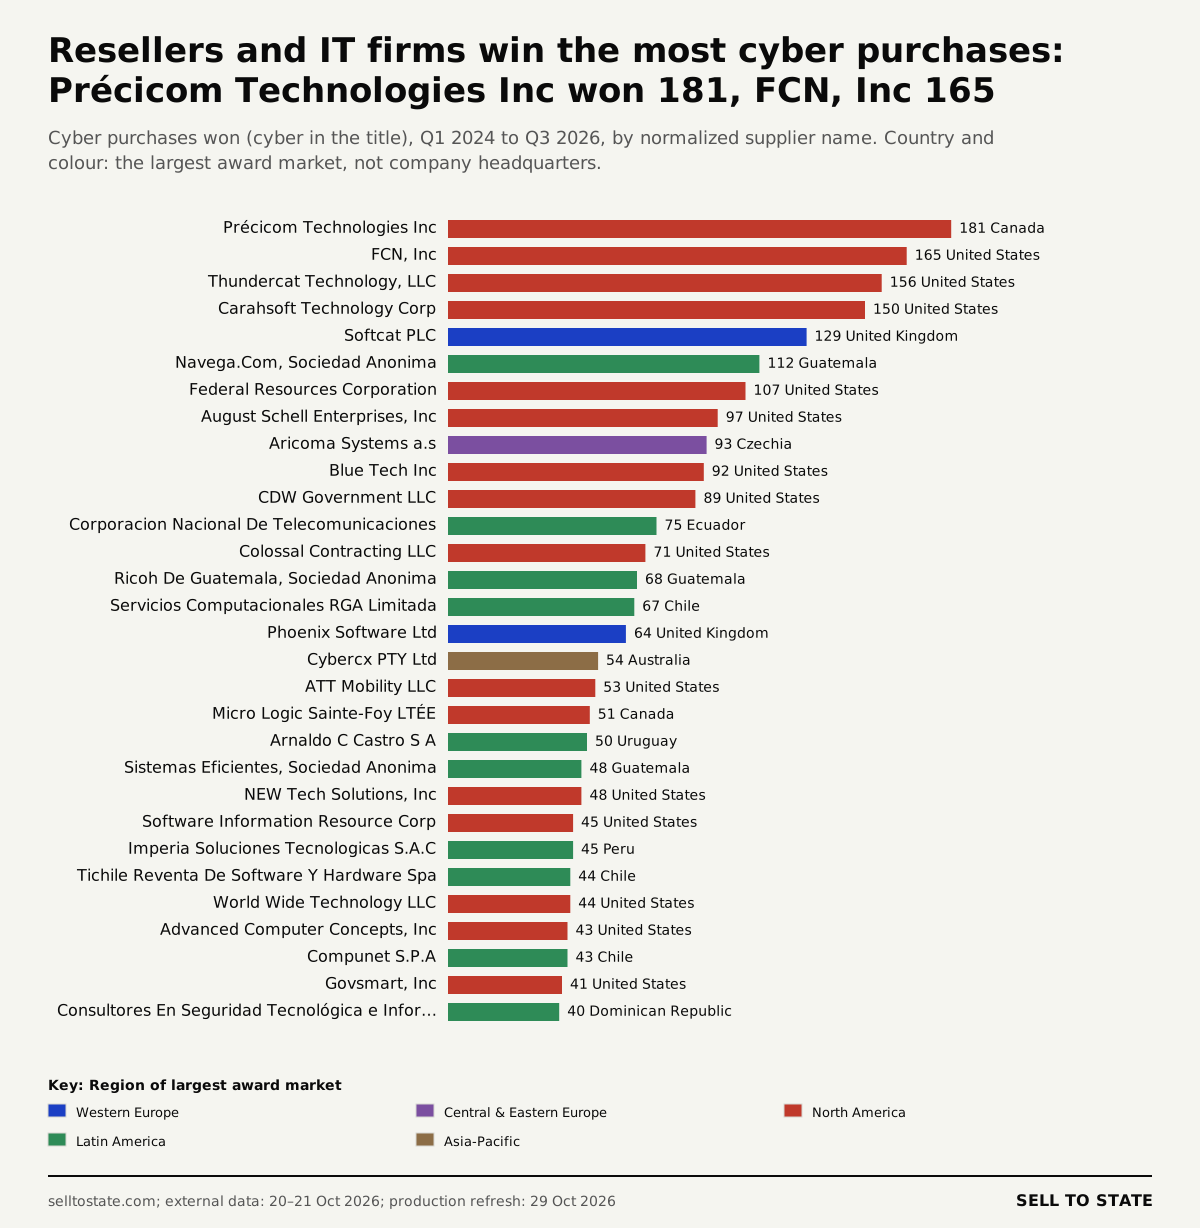
V32: Resellers and IT firms win the most cyber purchases: Précicom Technologies Inc won 181, FCN, Inc 165. PNG · SVG
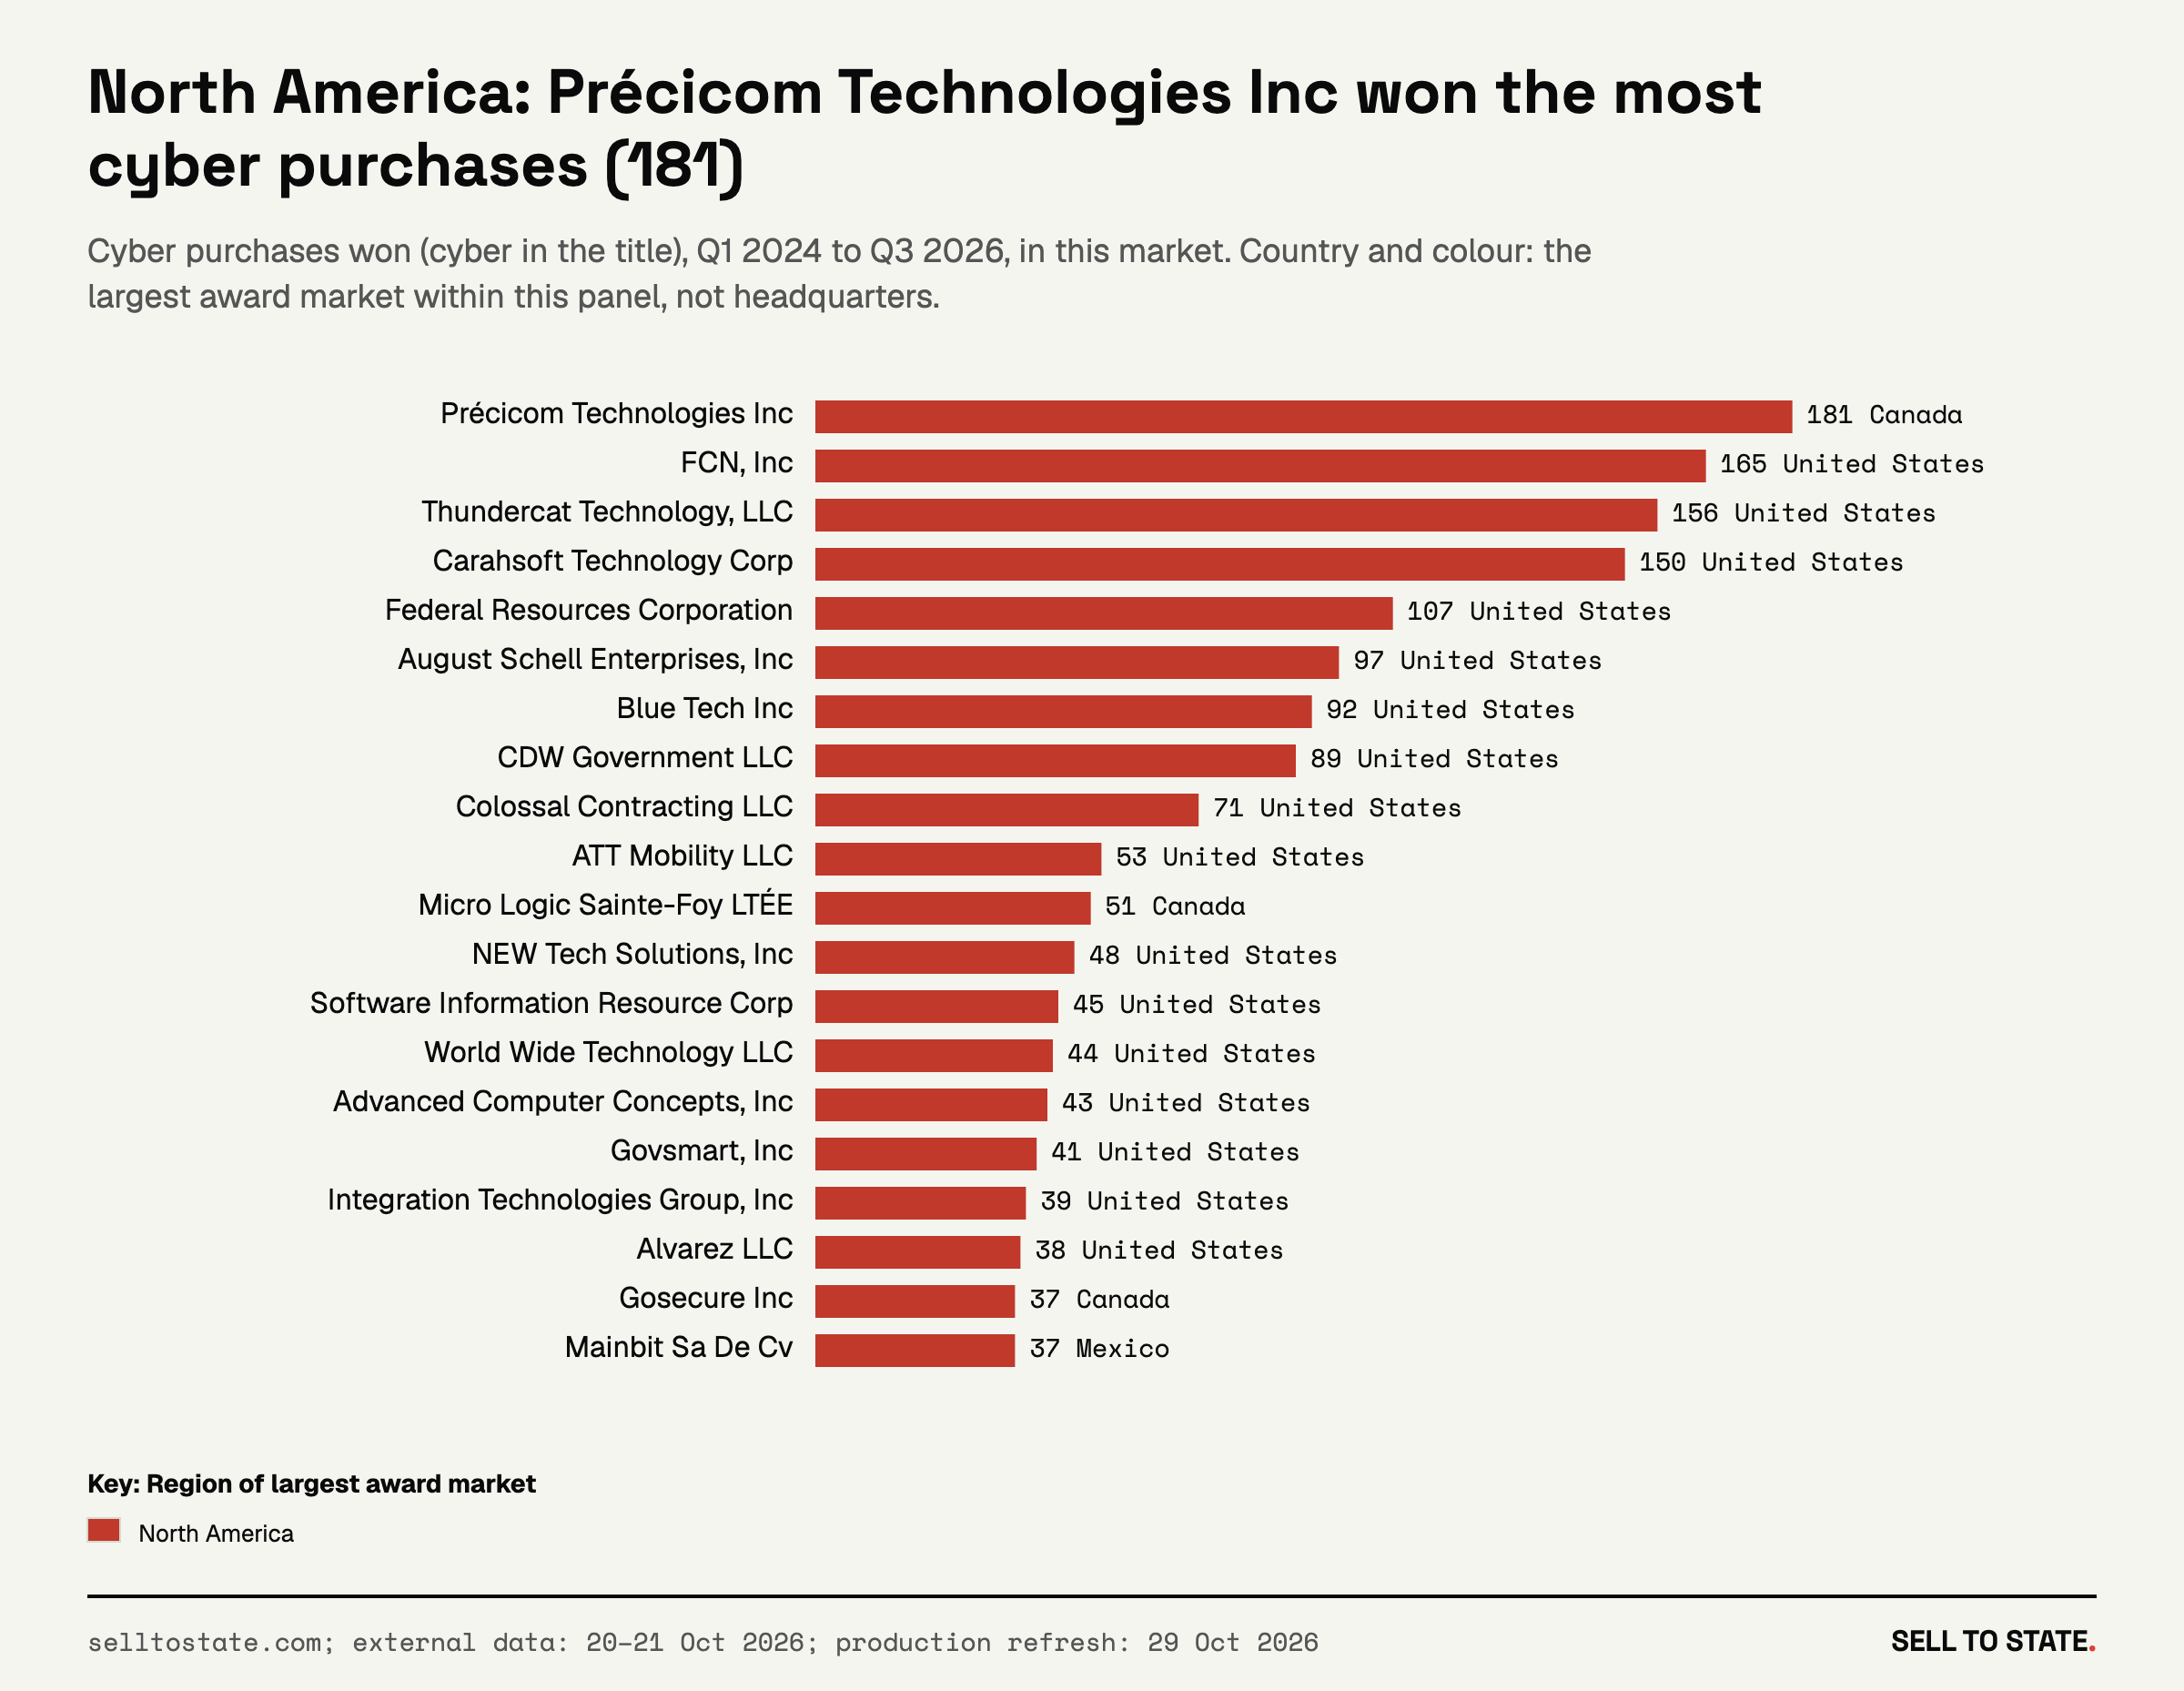
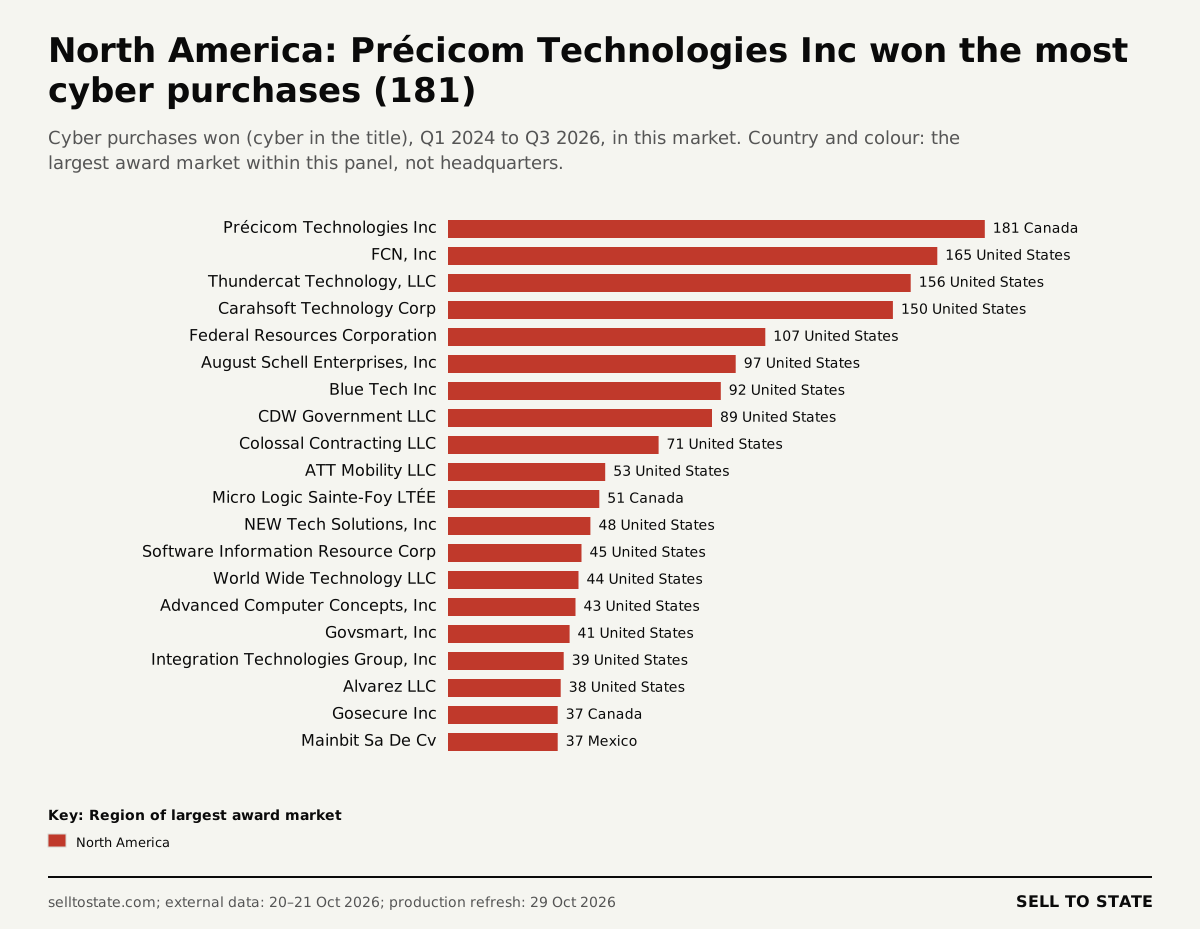
V33: North America: Précicom Technologies Inc won the most cyber purchases (181). PNG · SVG
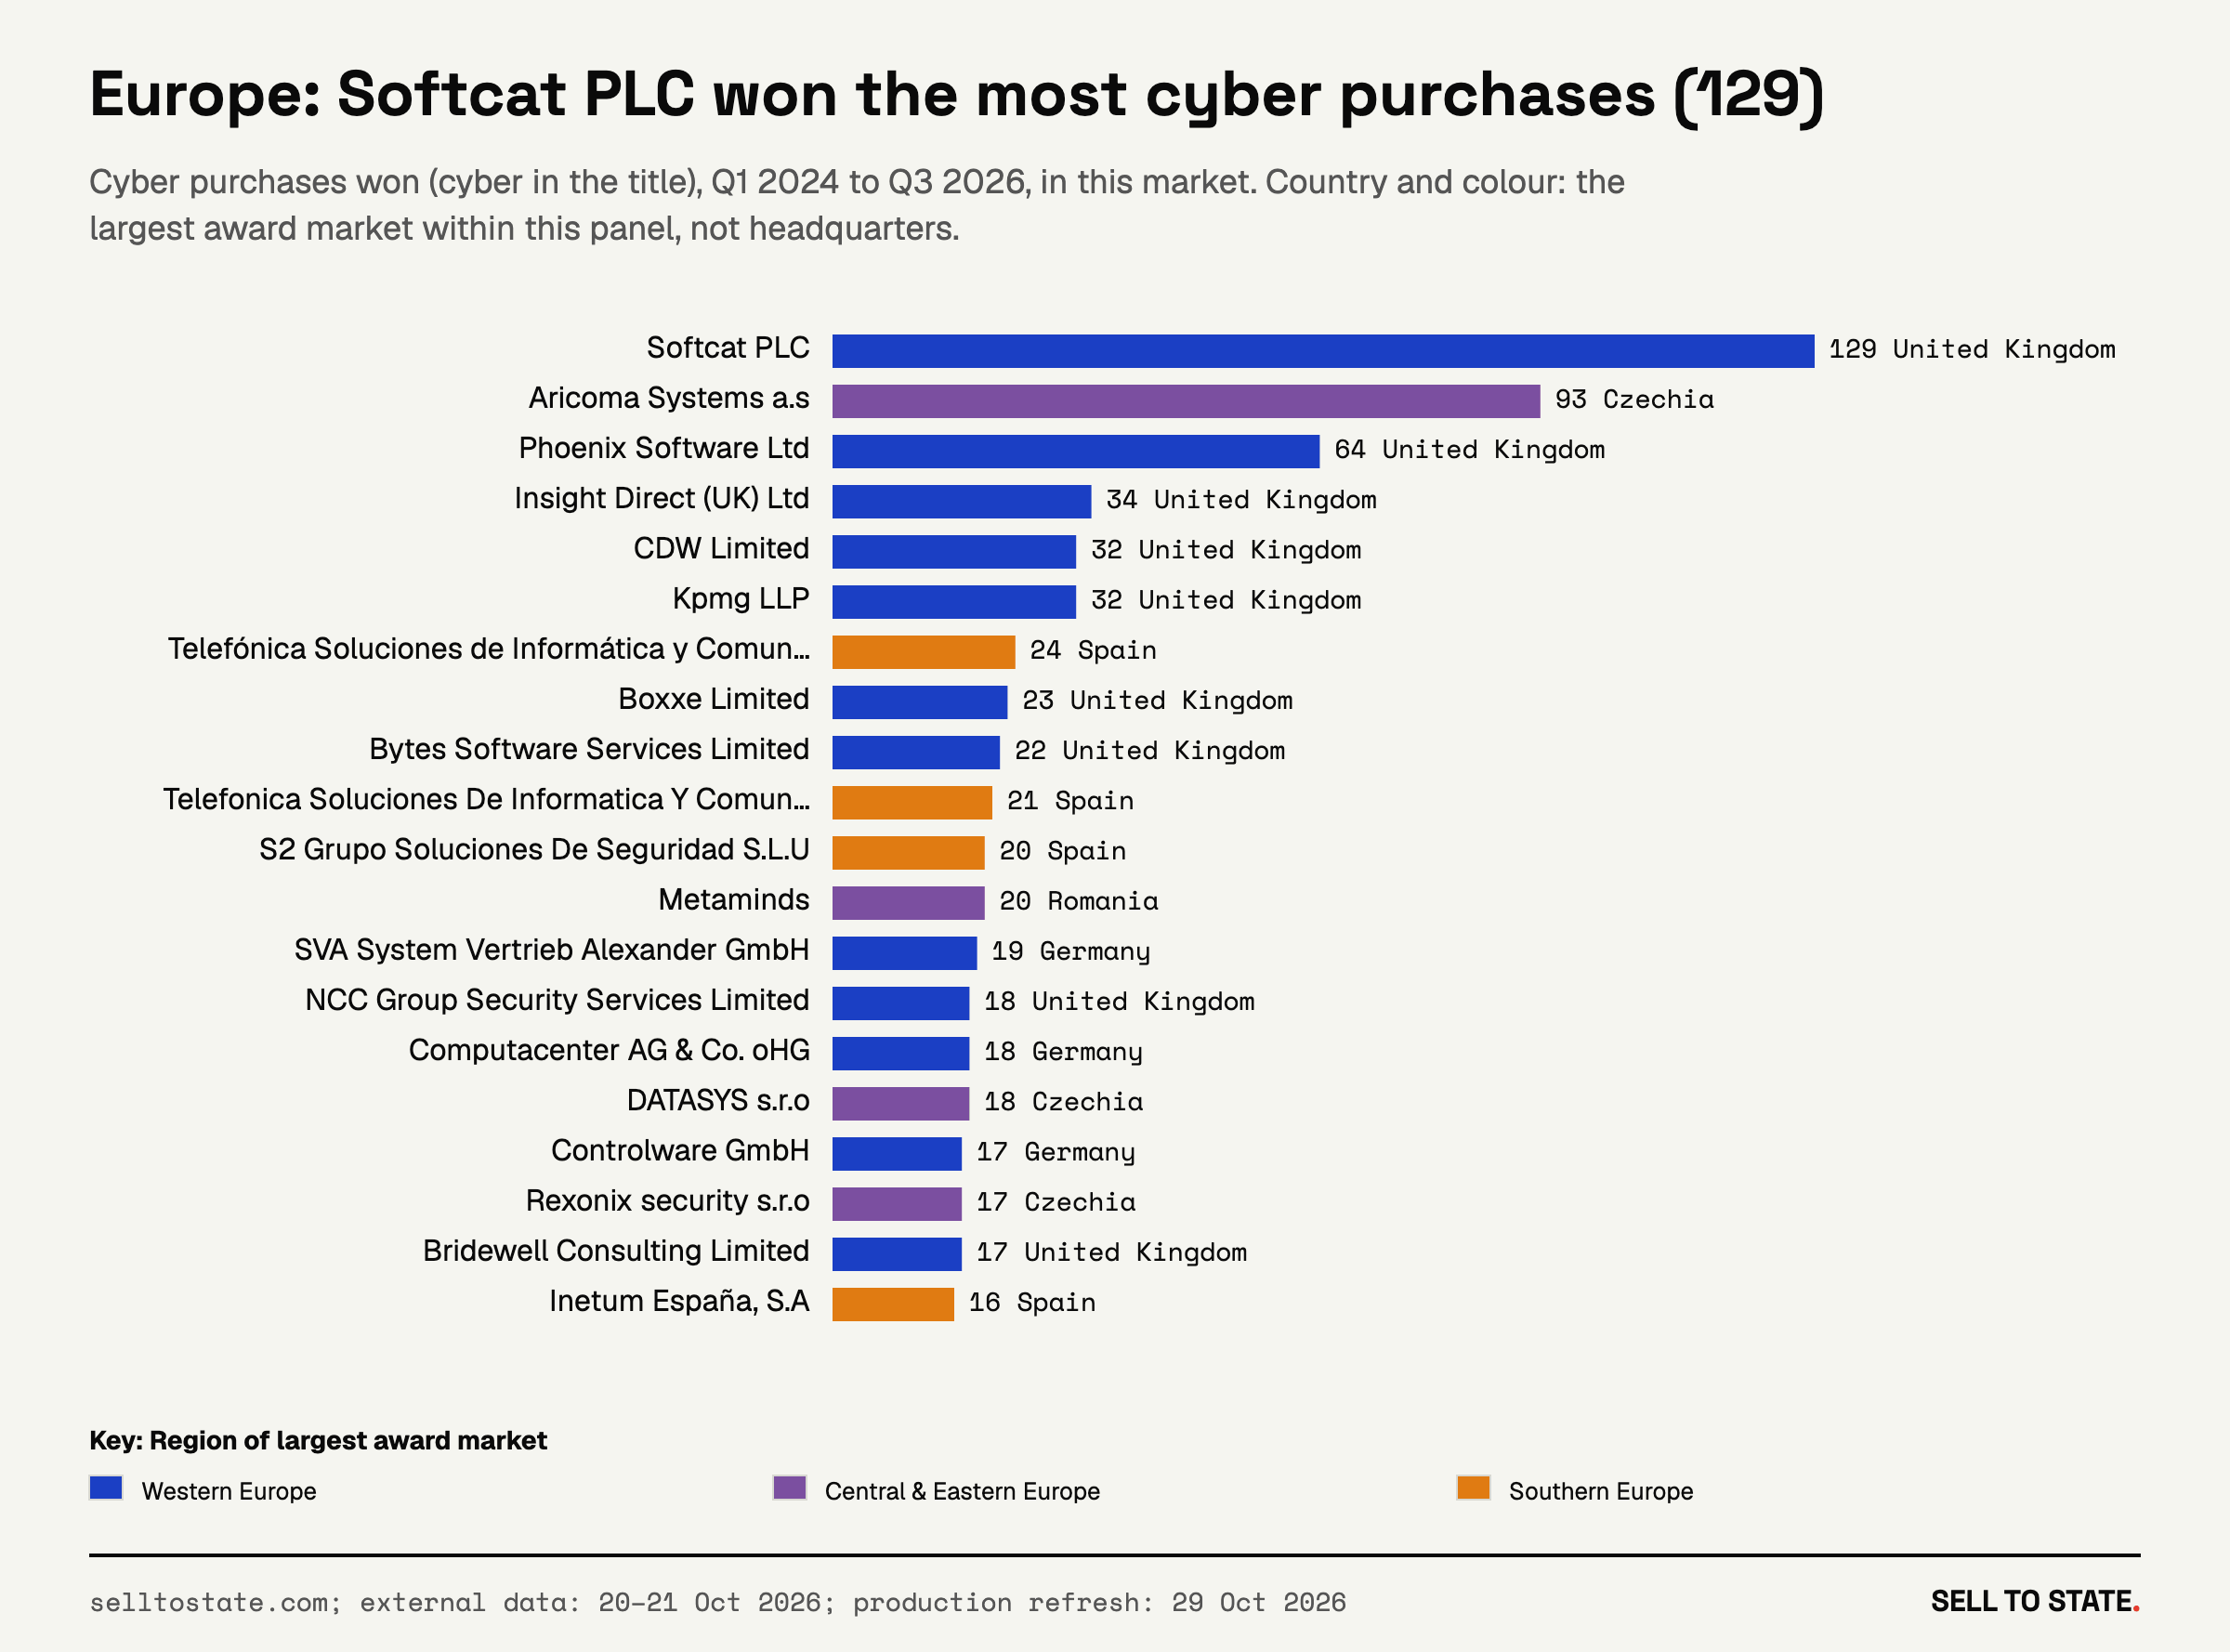
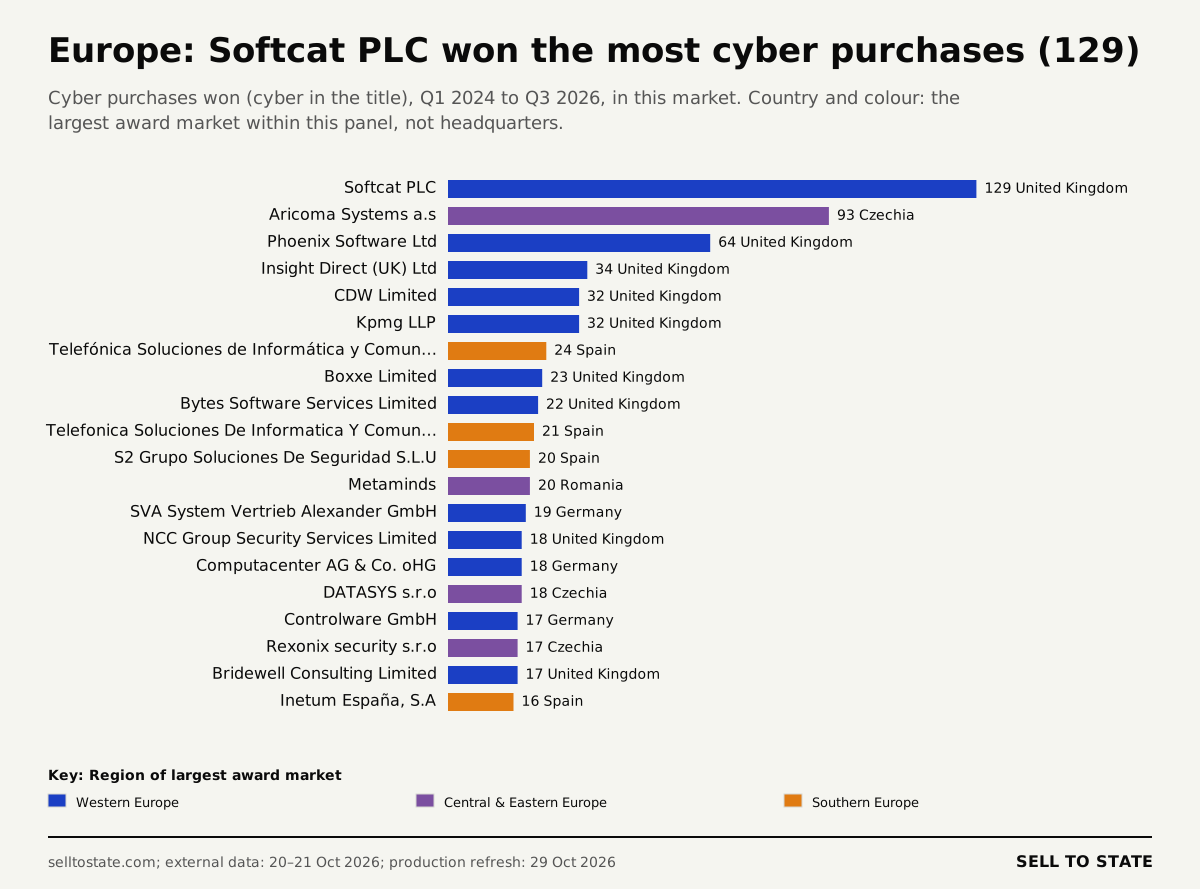
V34: Europe: Softcat PLC won the most cyber purchases (129). PNG · SVG
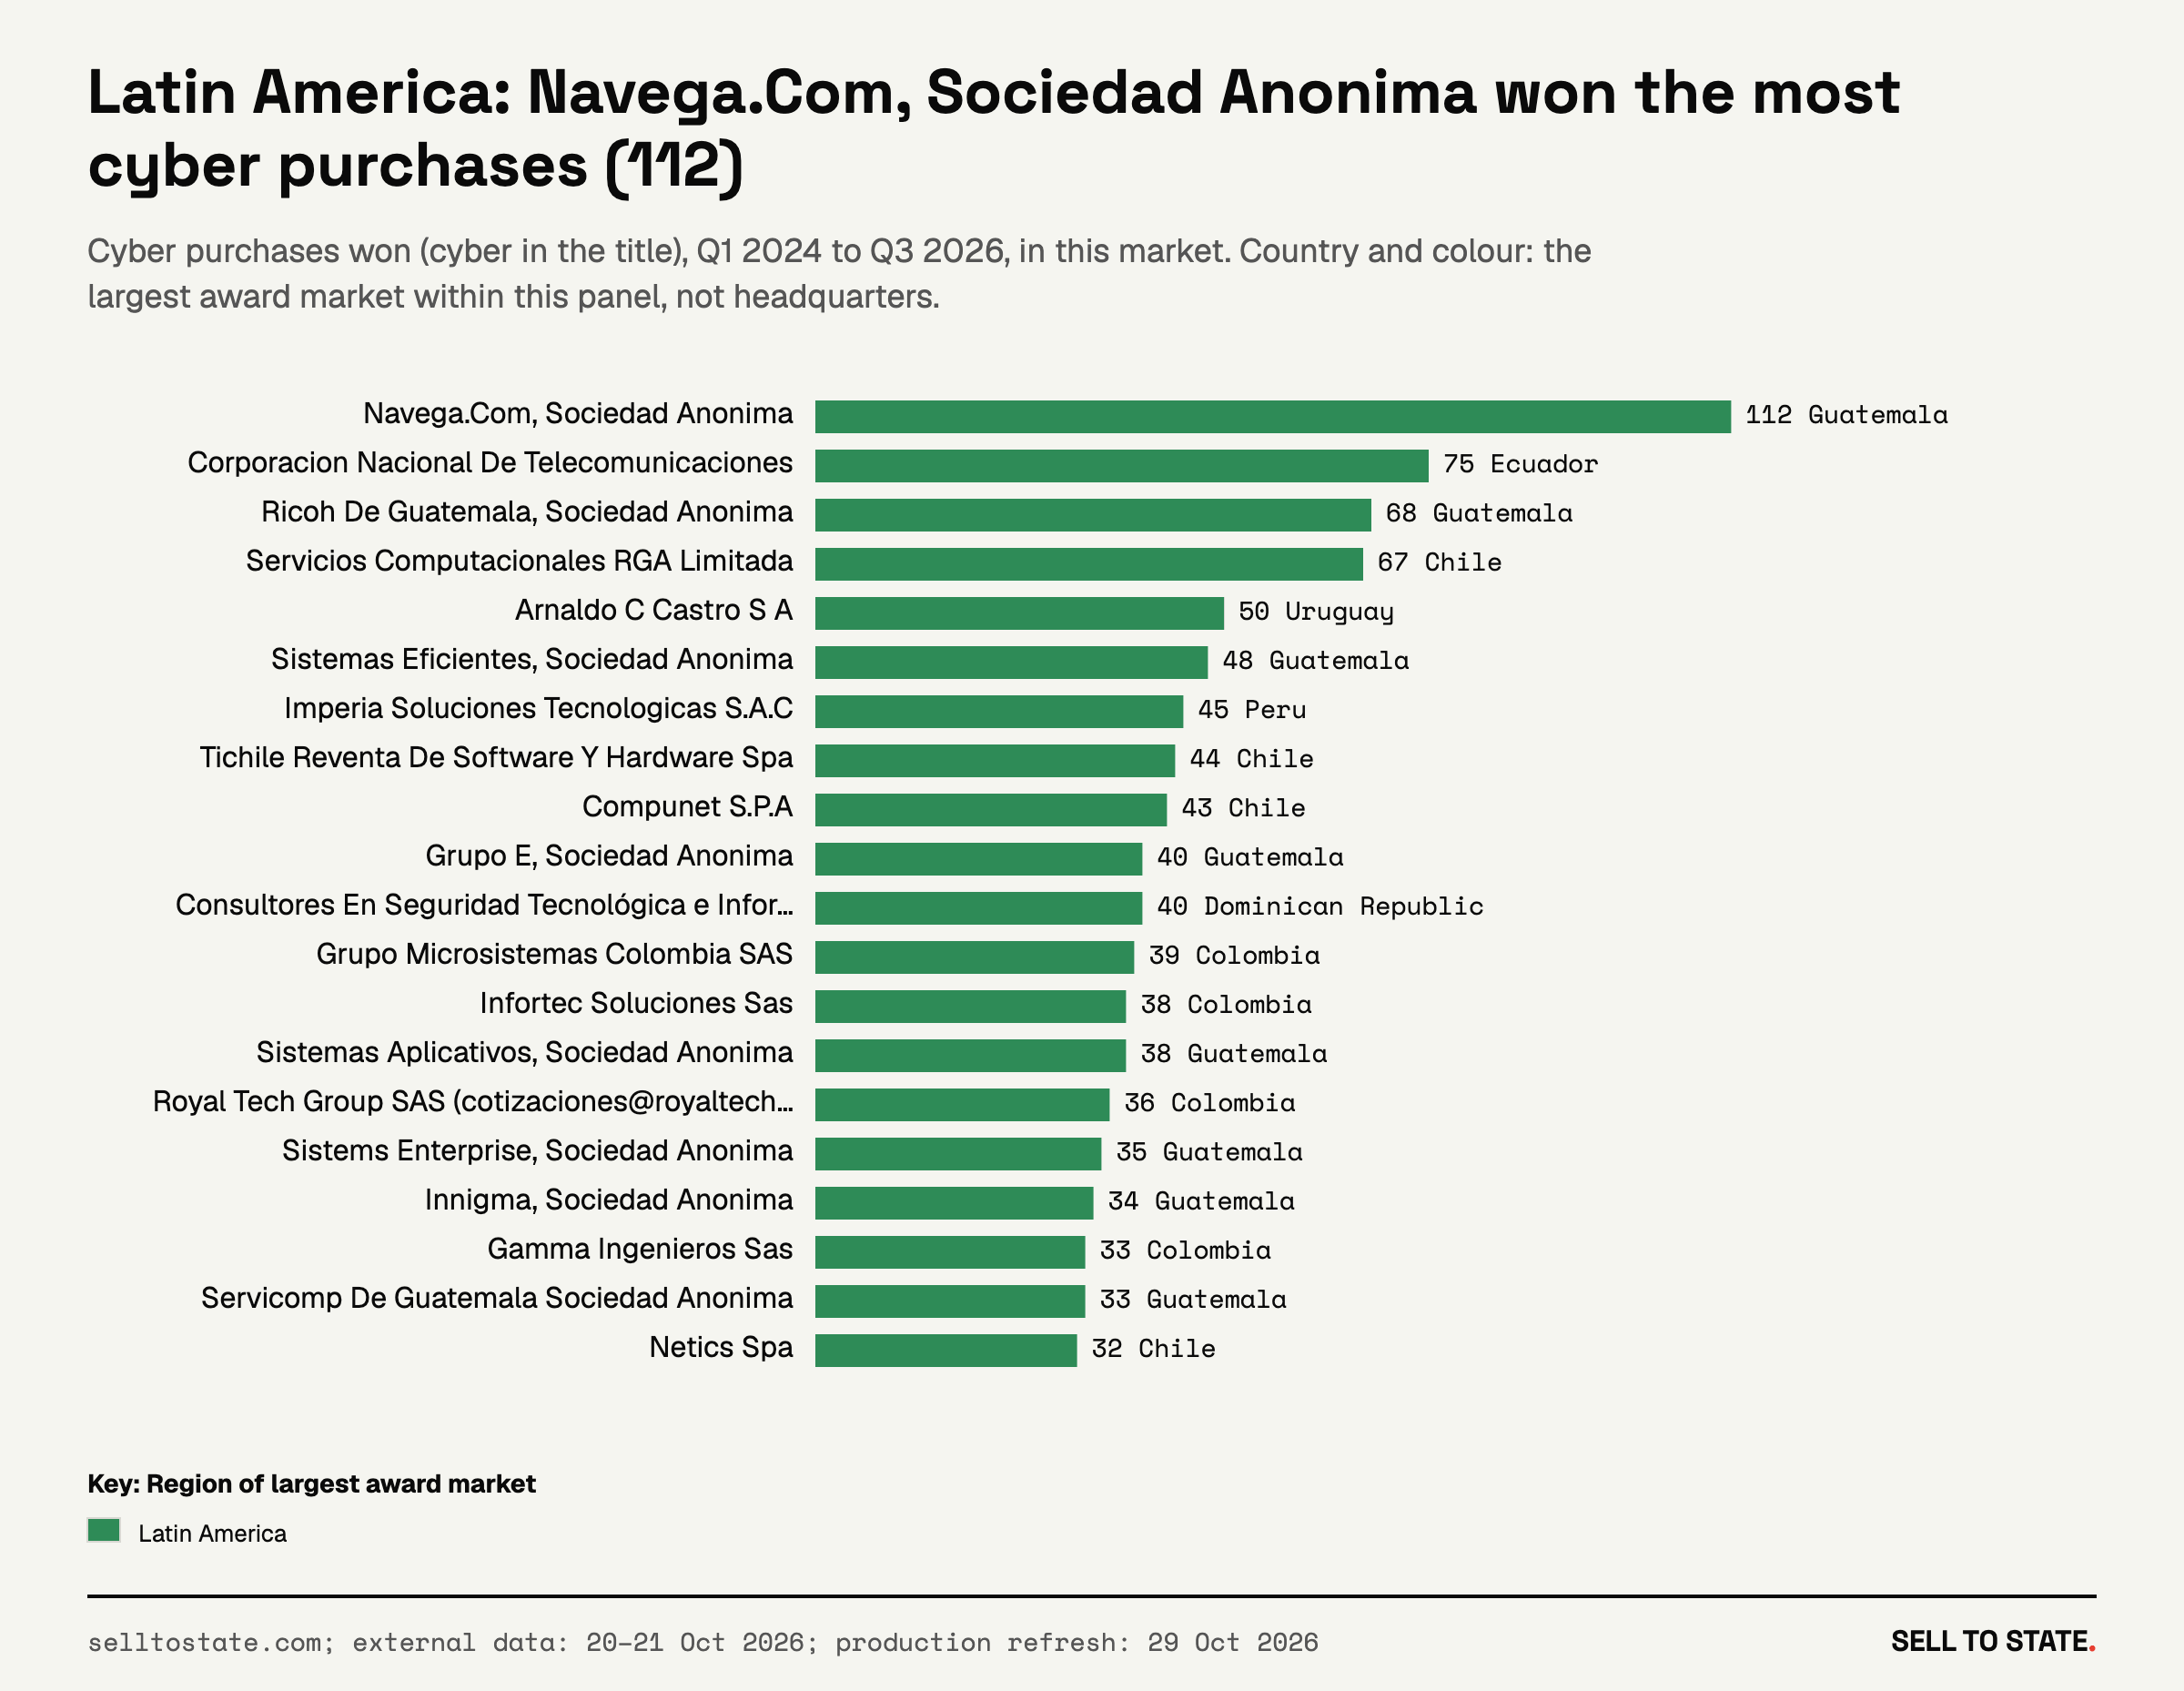
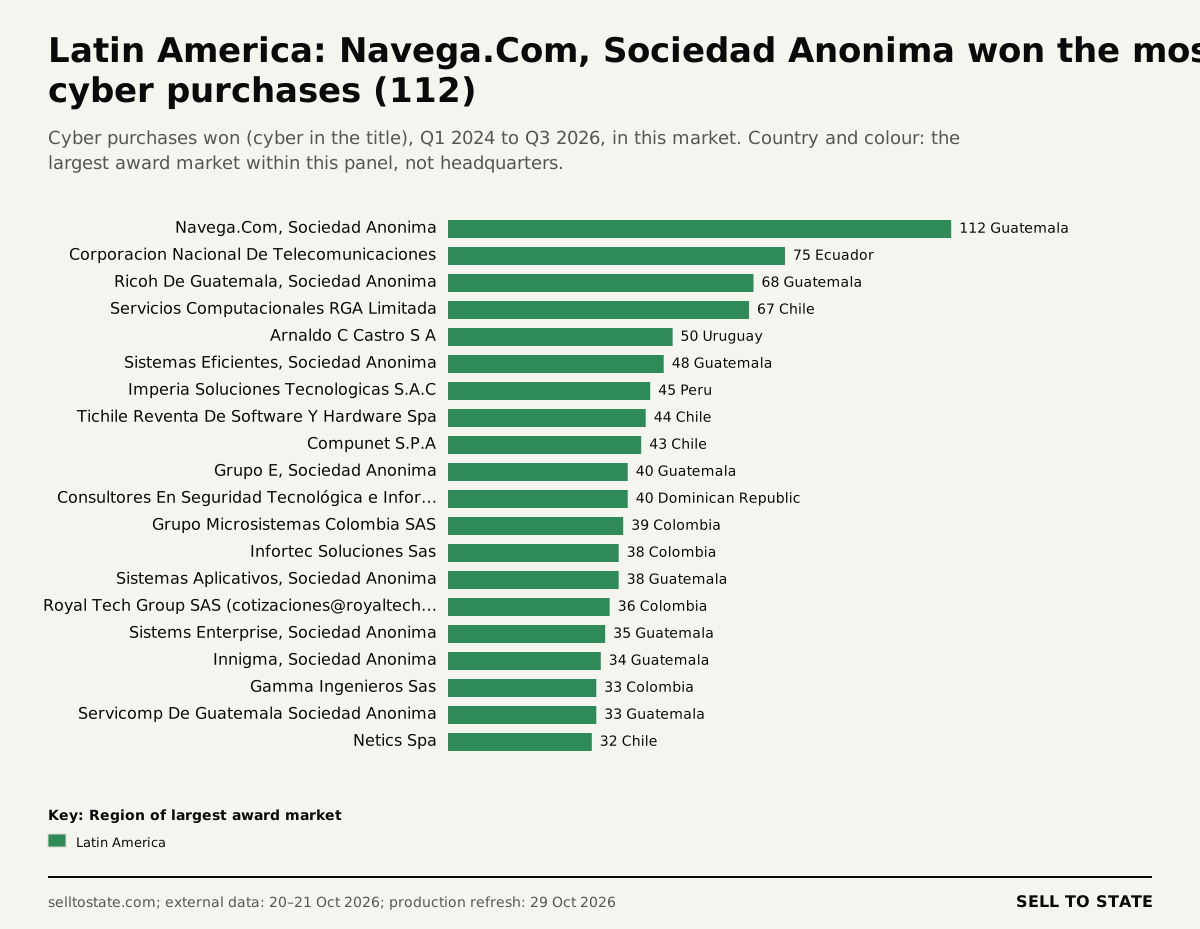
V35: Latin America: Navega.Com, Sociedad Anonima won the most cyber purchases (112). PNG · SVG
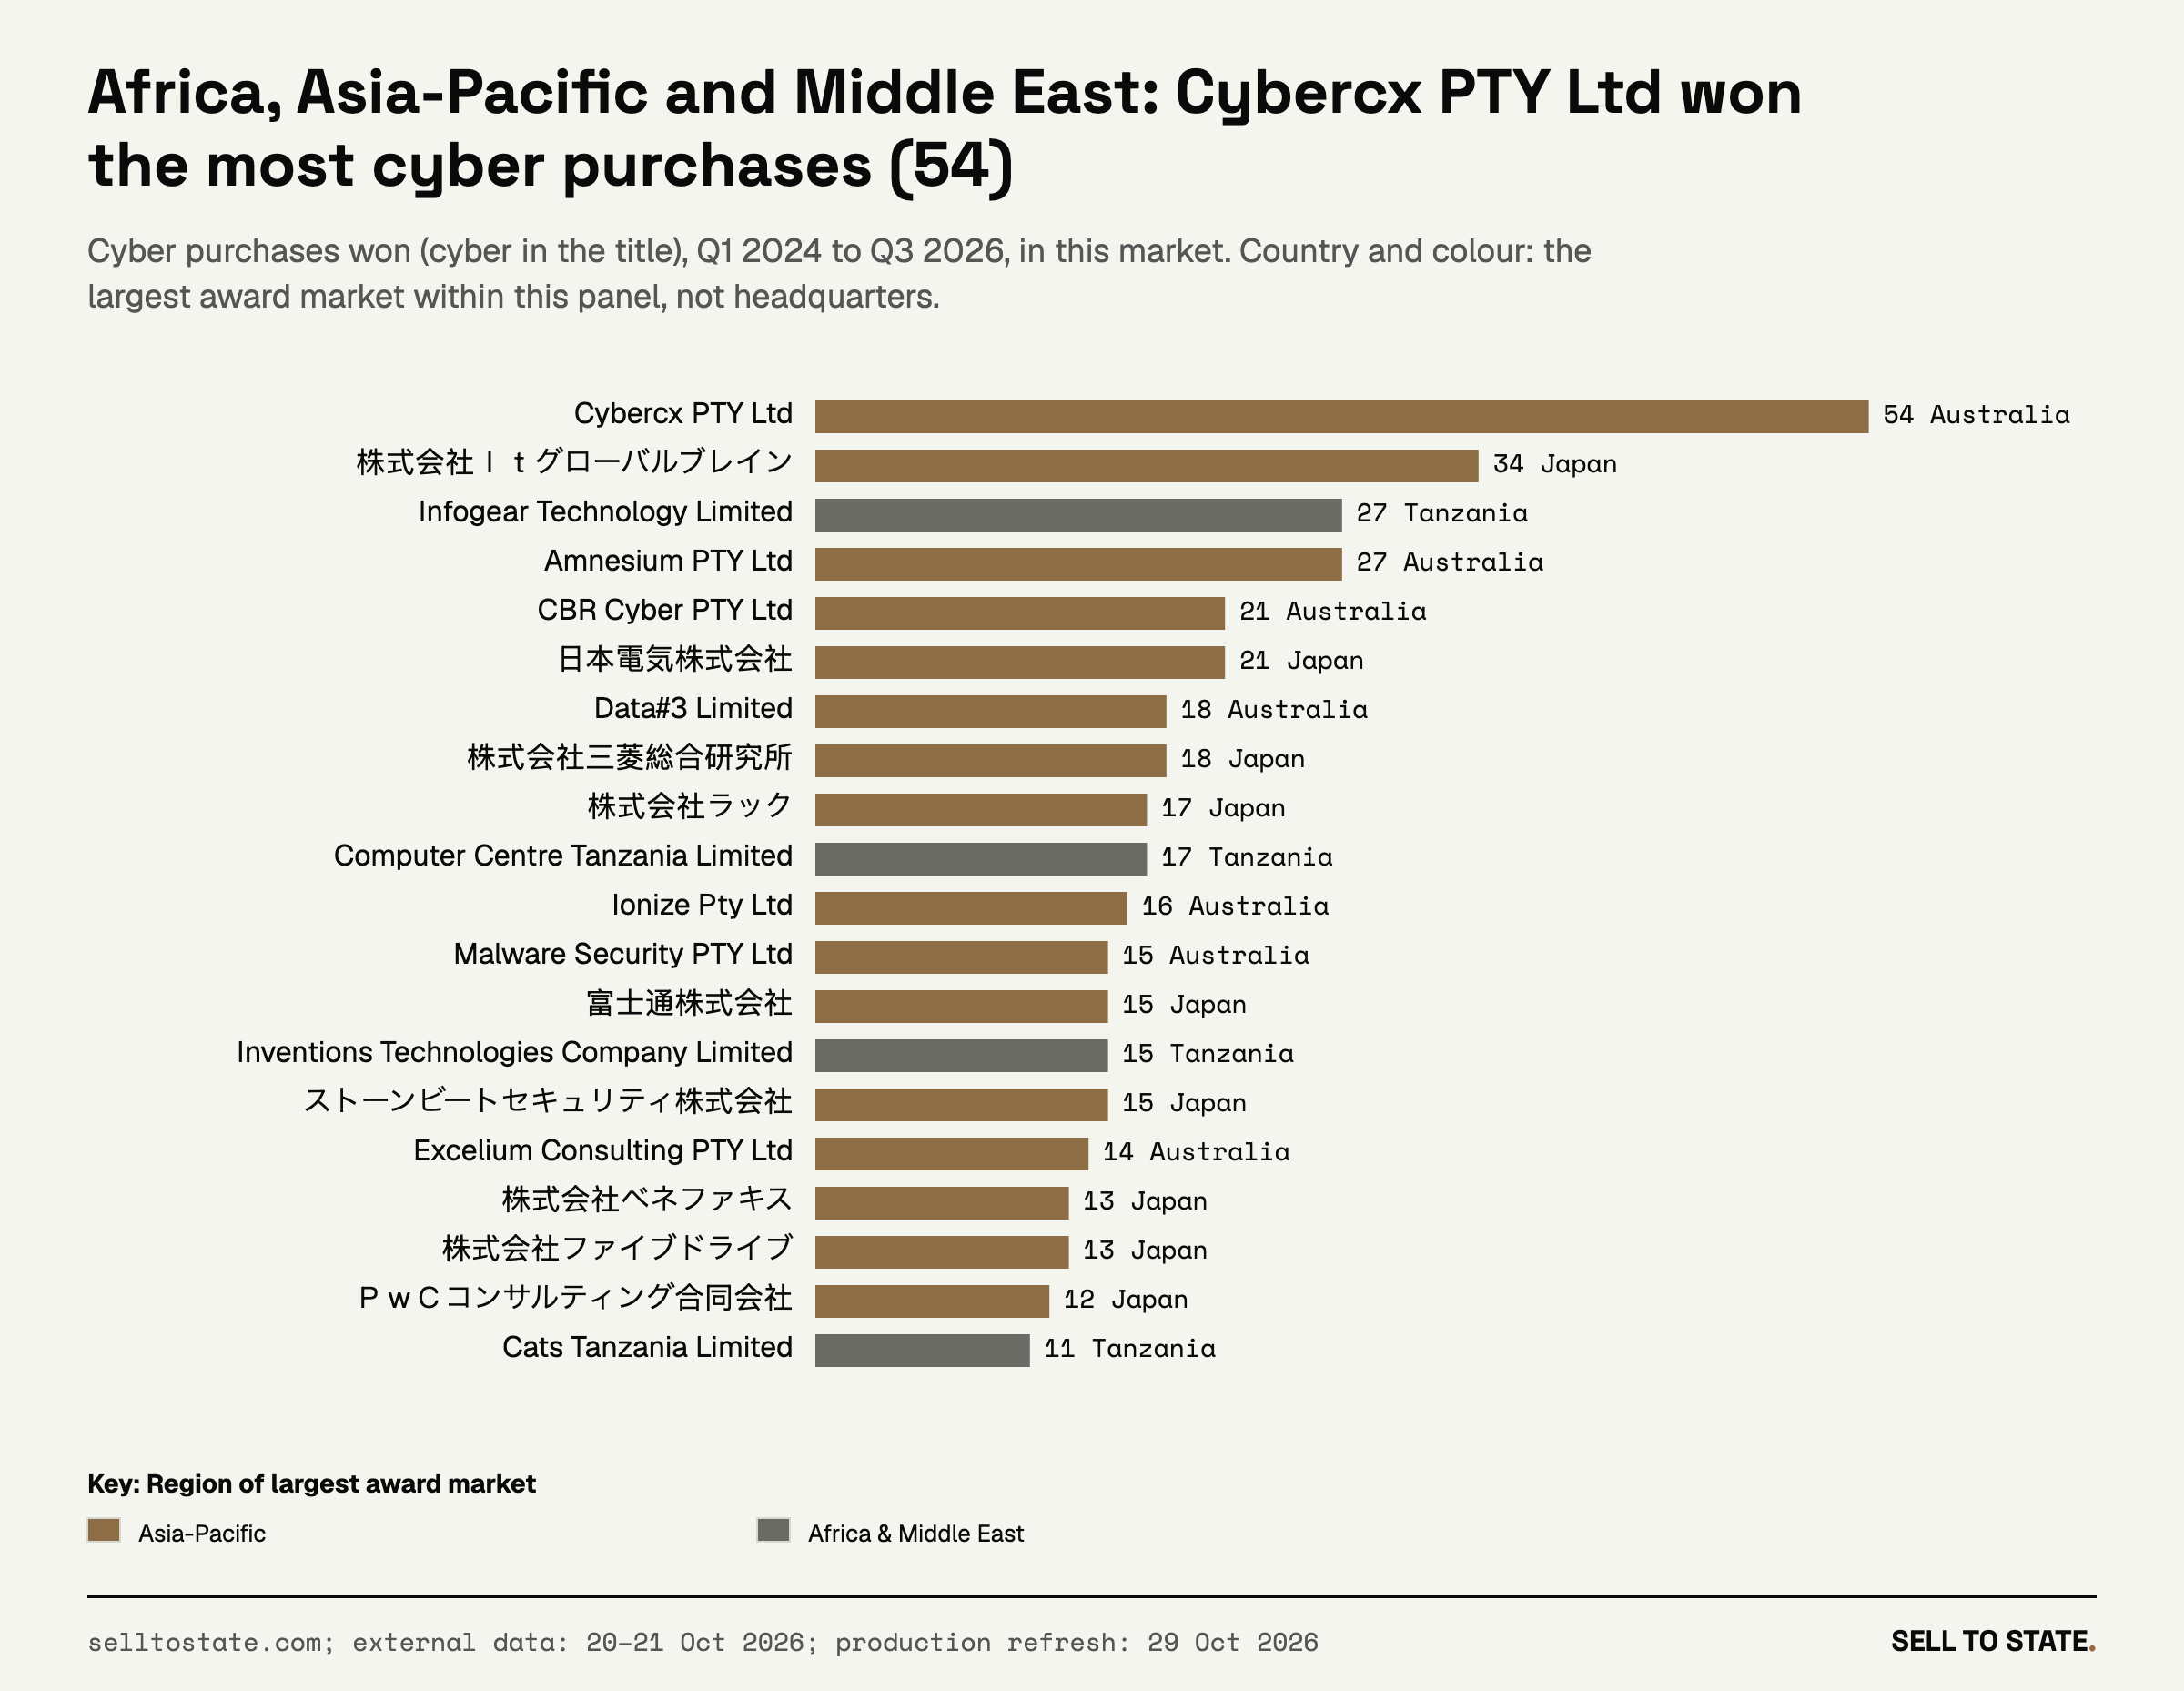
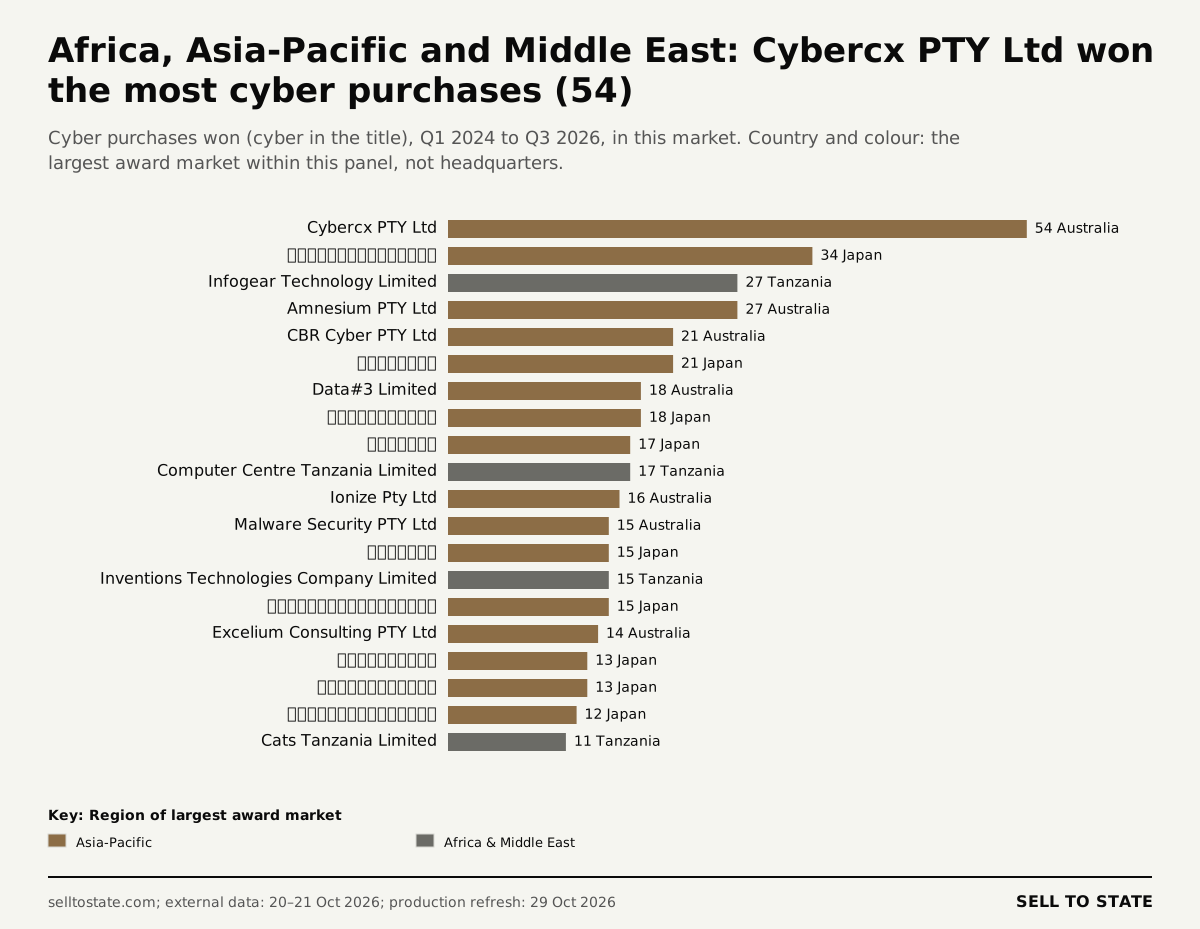
V36: Africa, Asia-Pacific and Middle East: Cybercx PTY Ltd won the most cyber purchases (54). PNG · SVG
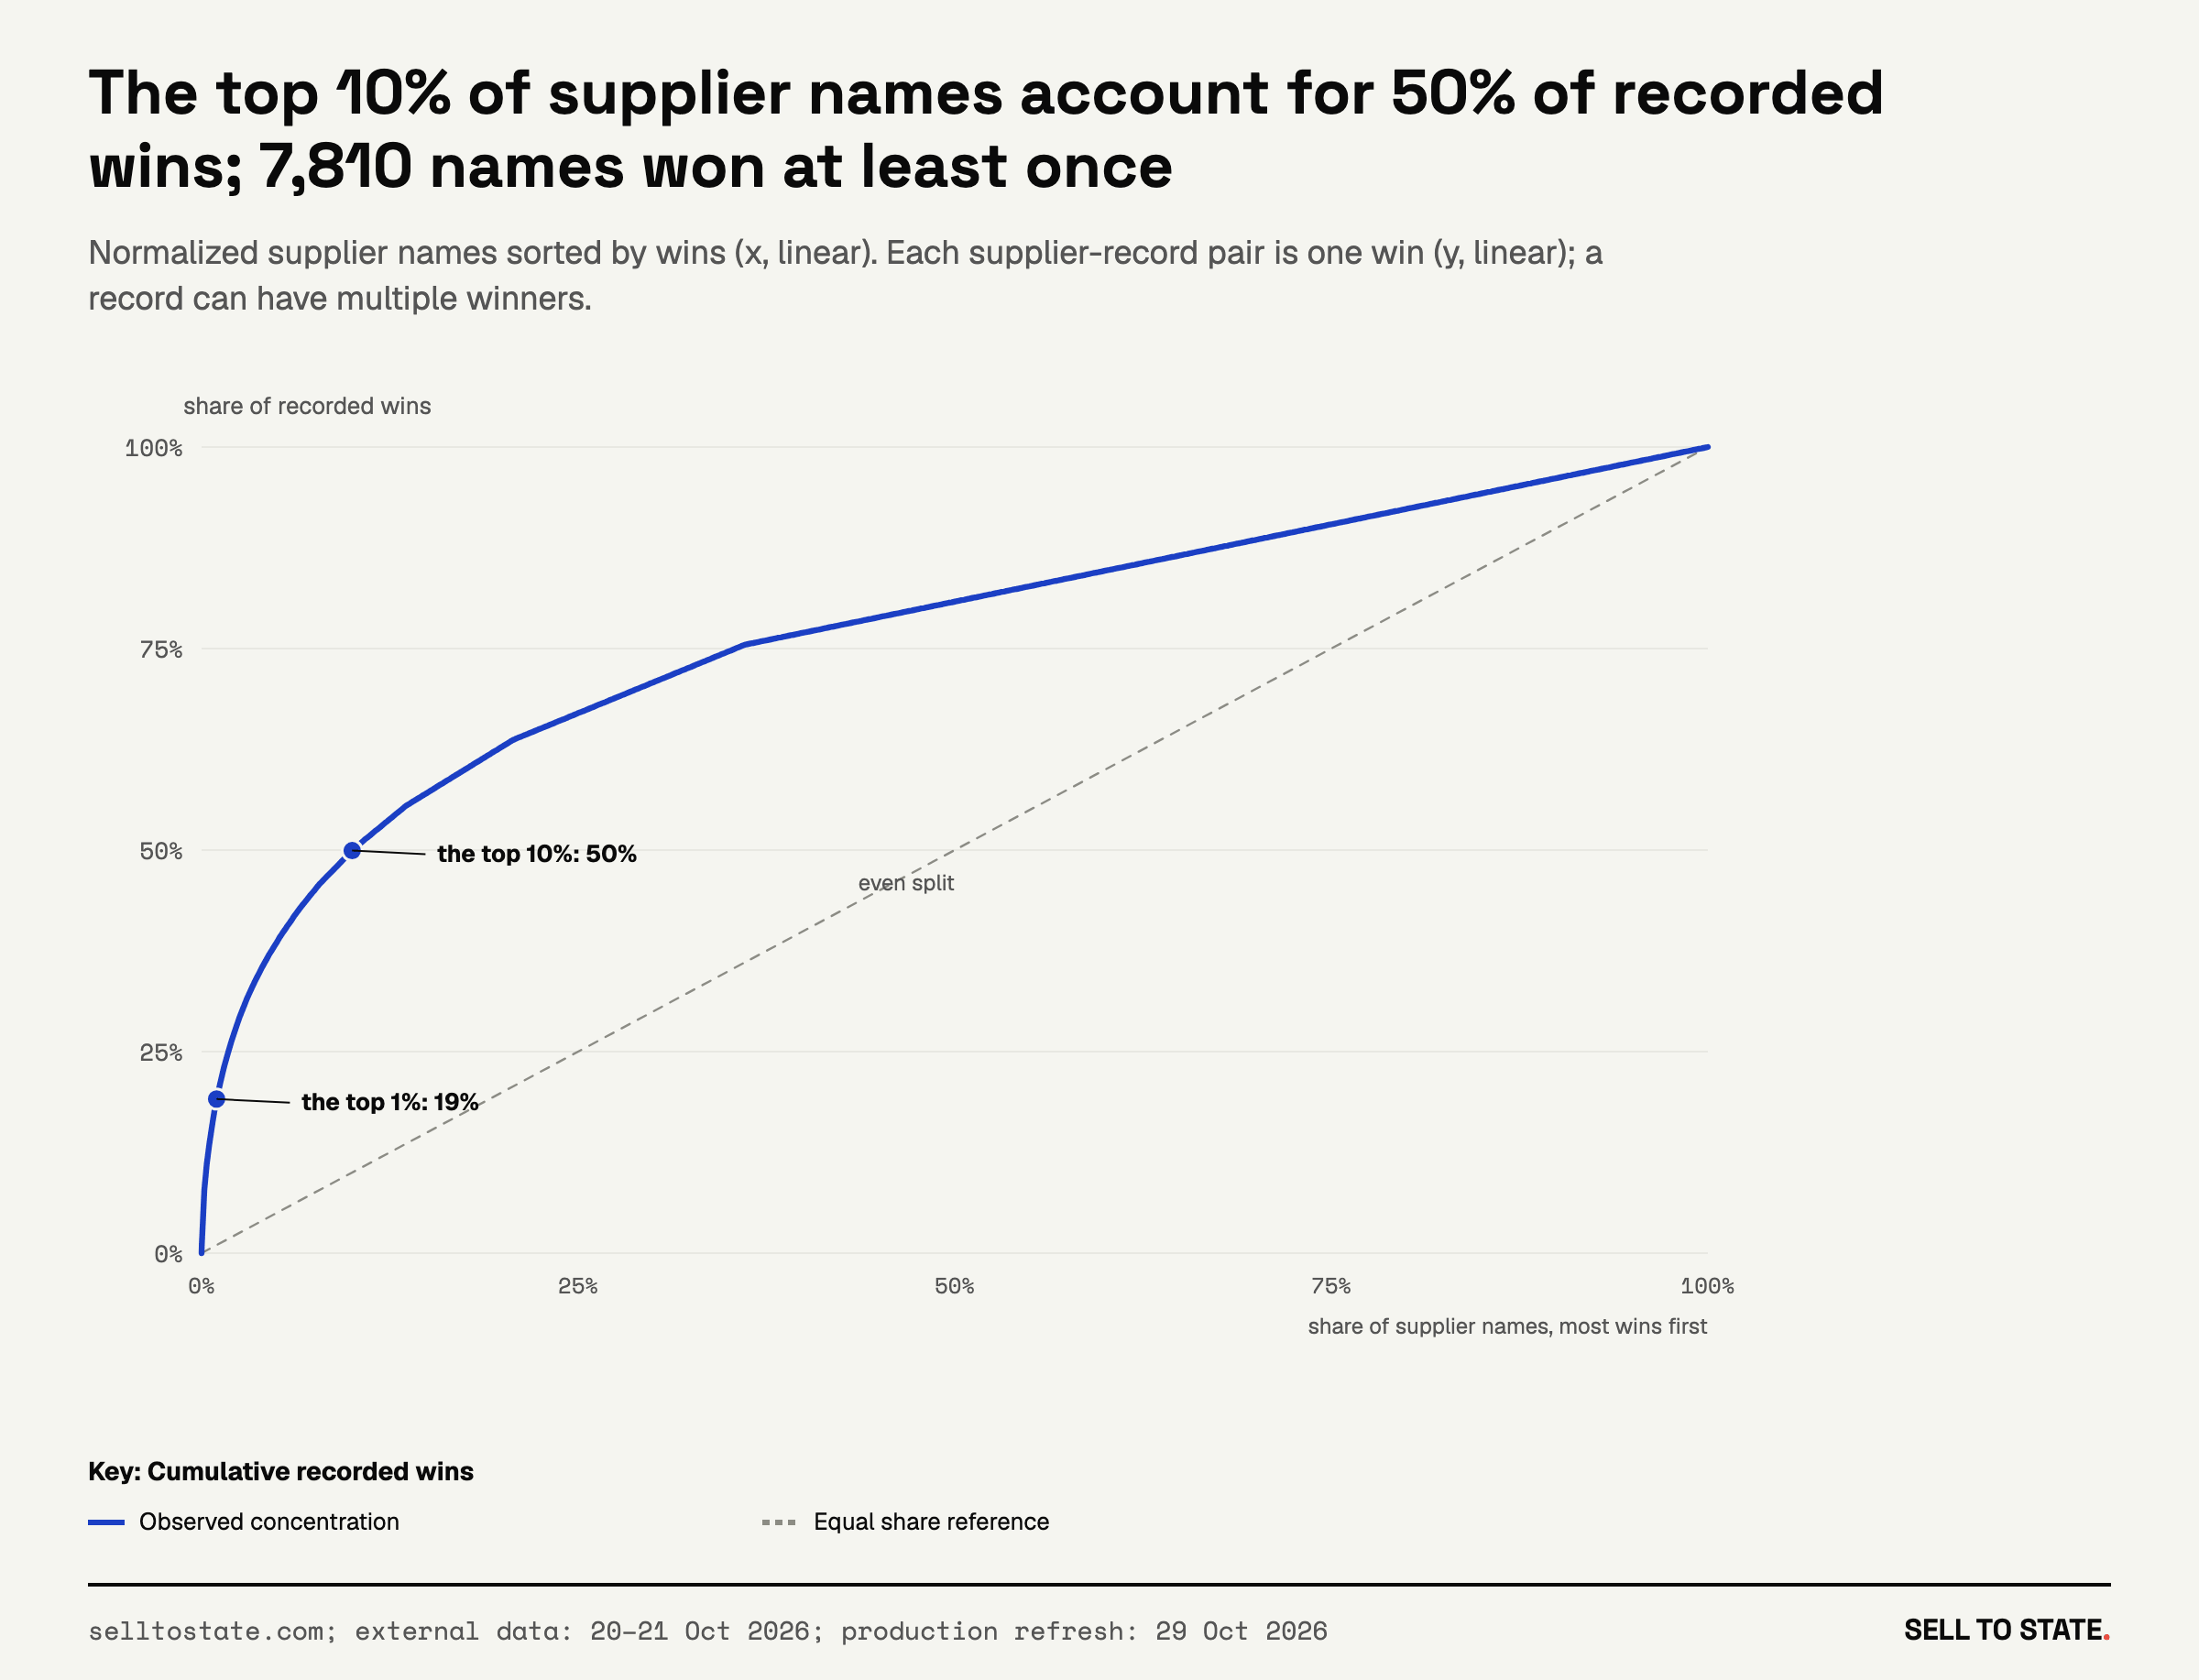
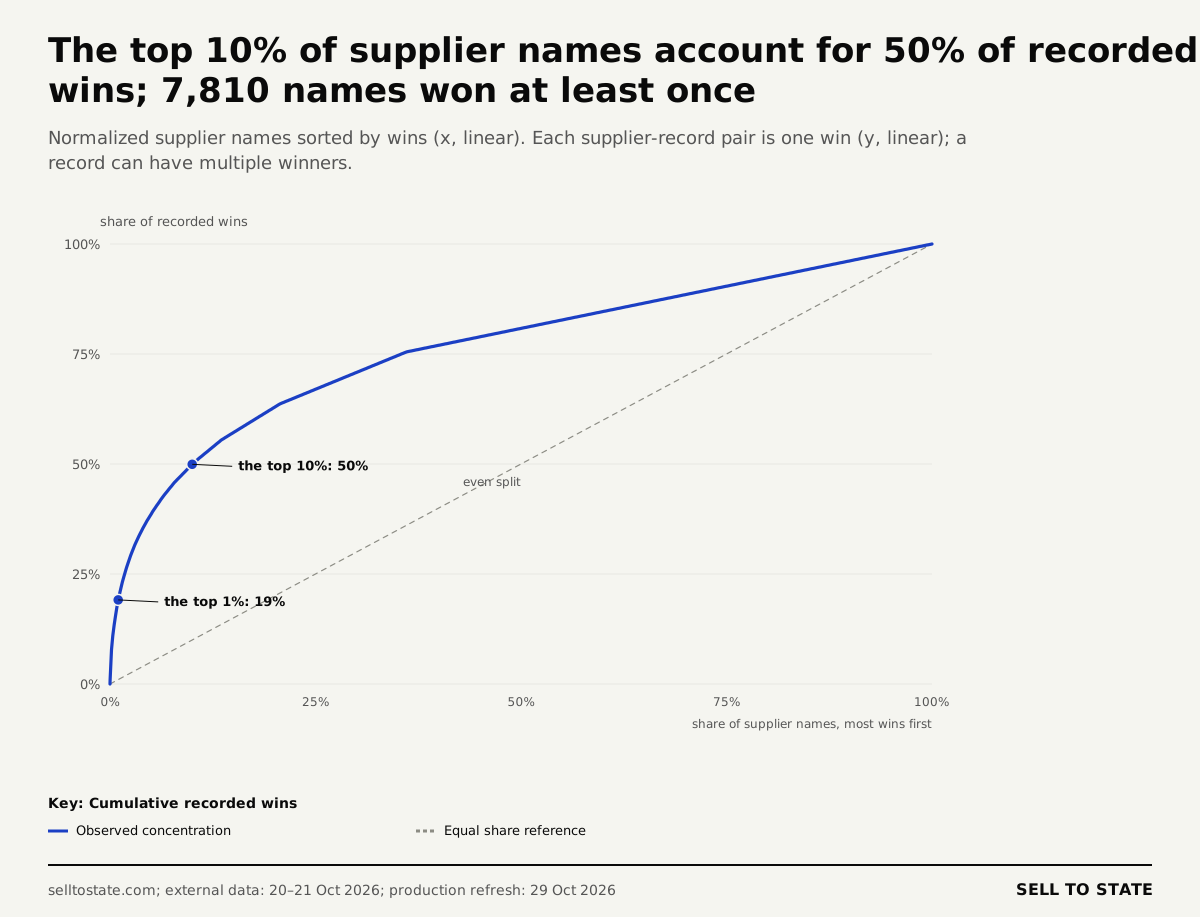
V37: The top 10% of supplier names account for 50% of recorded wins; 7,810 names won at least once. PNG · SVG
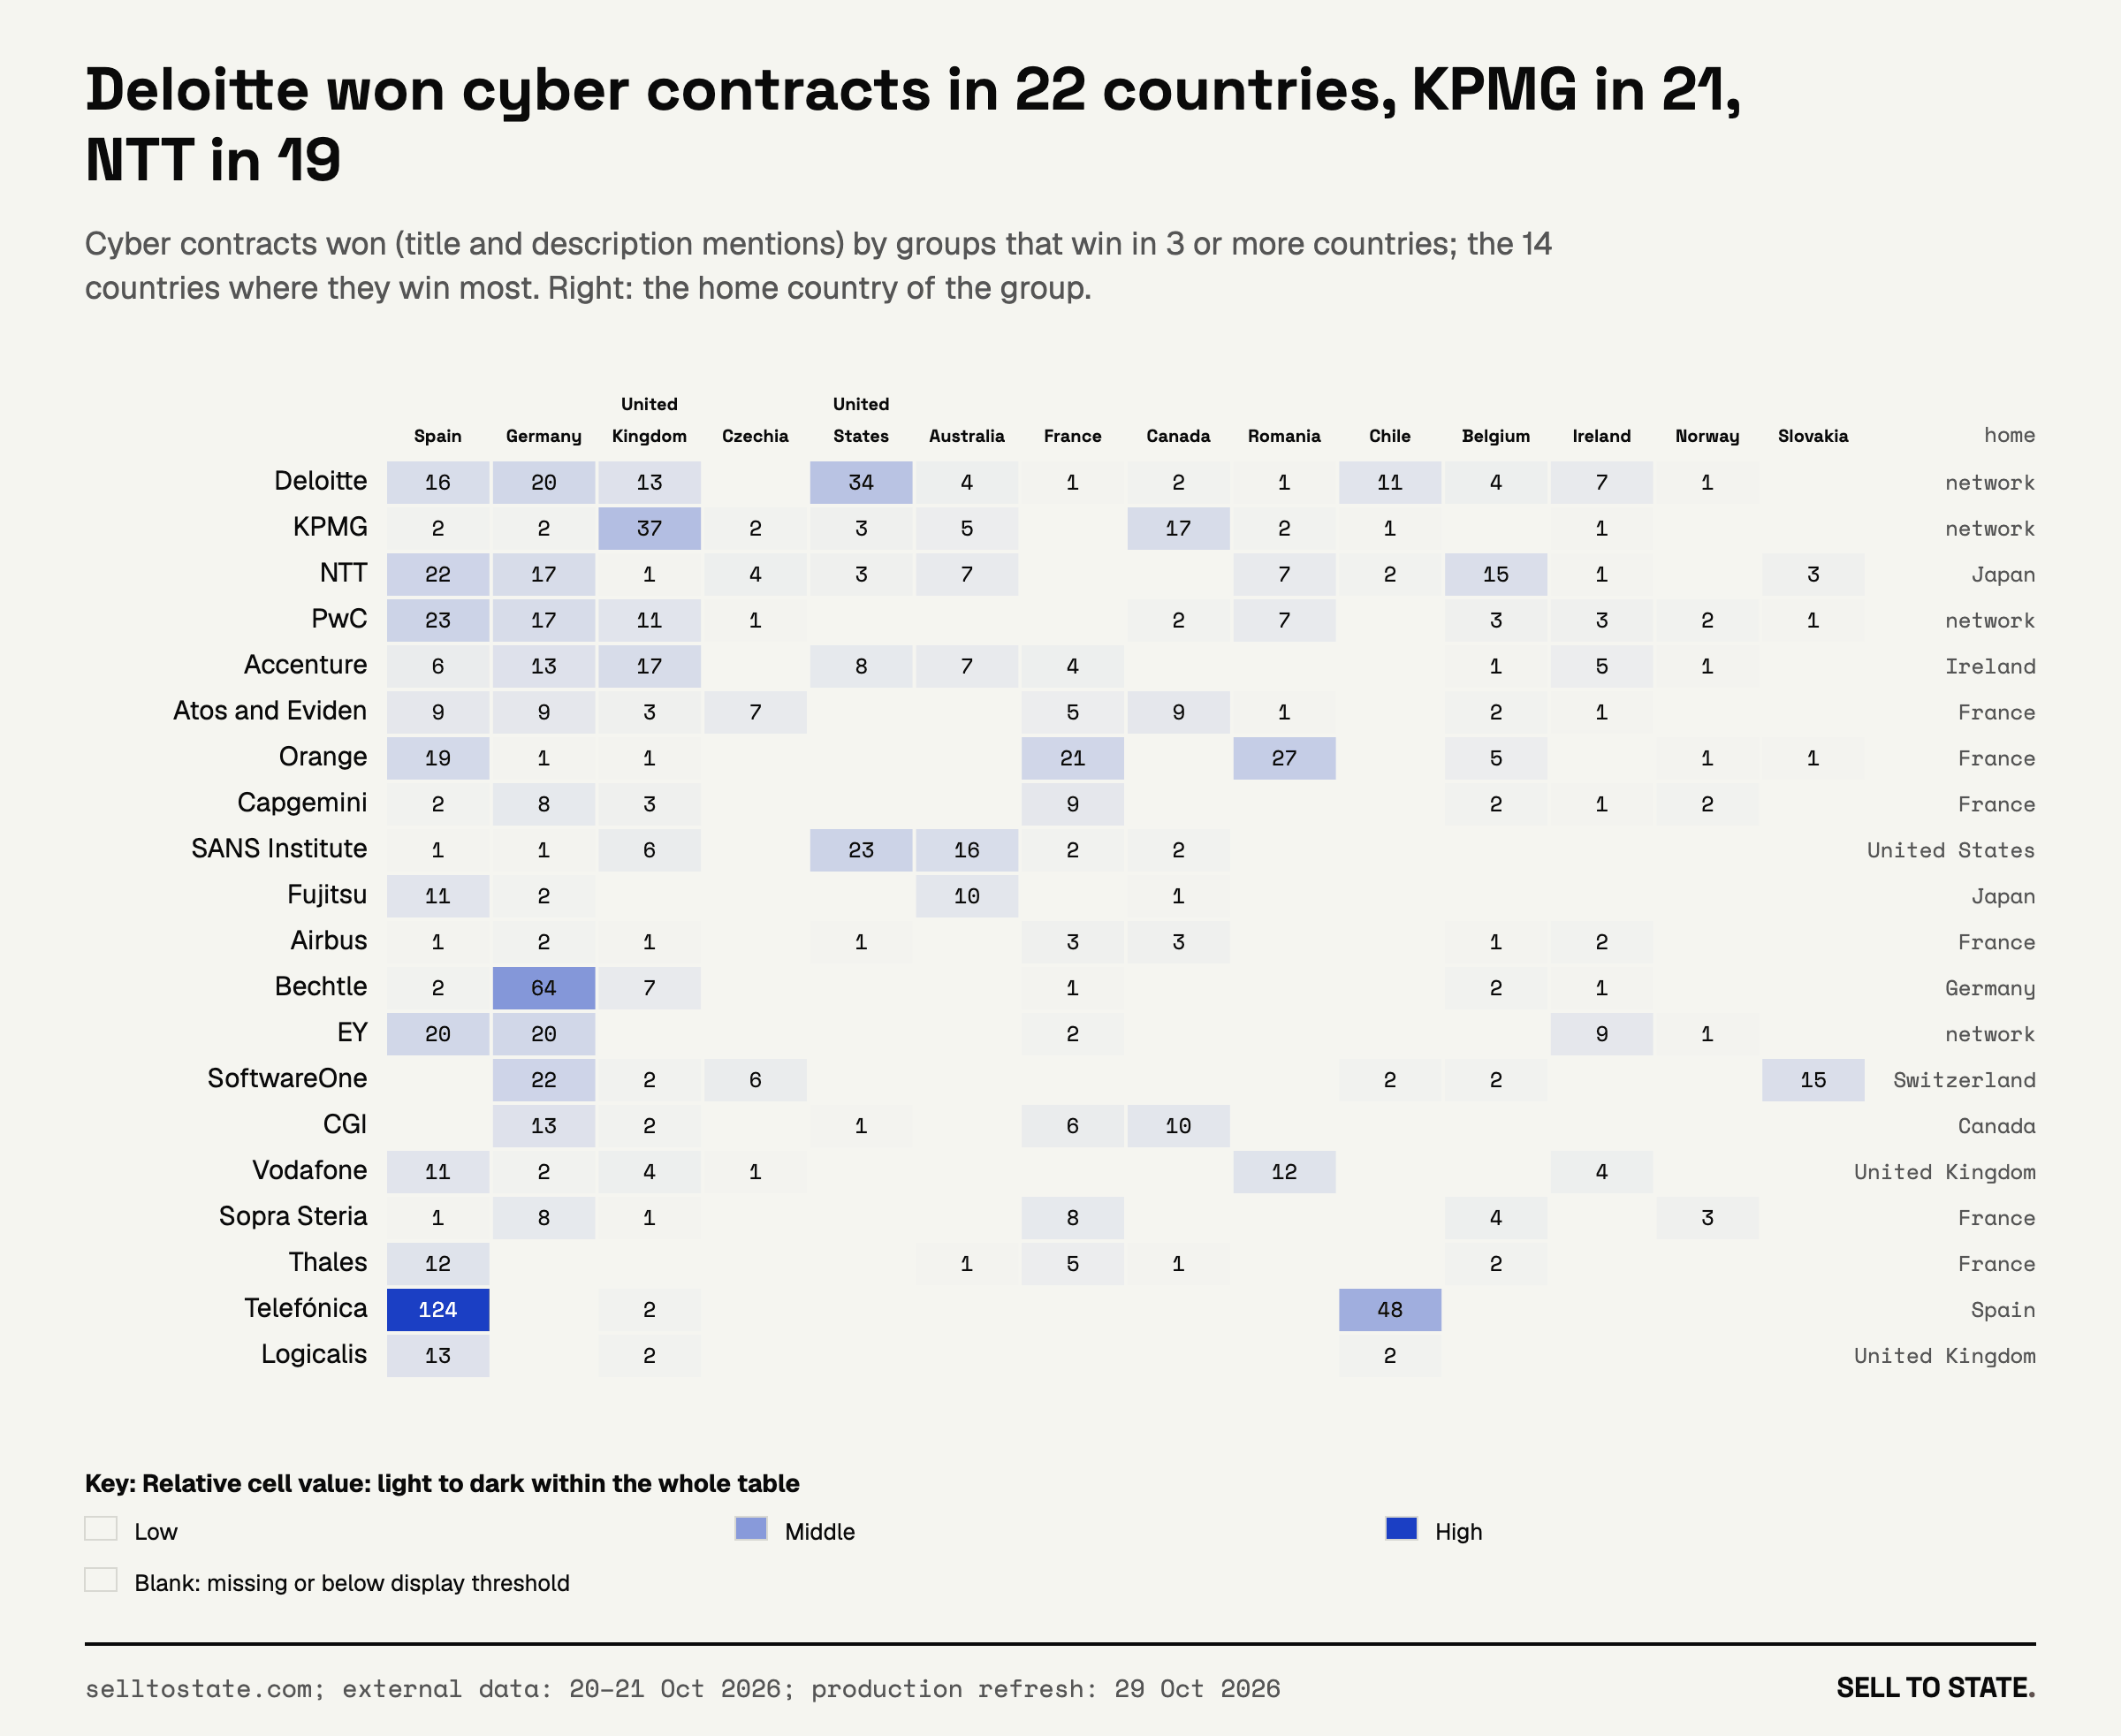
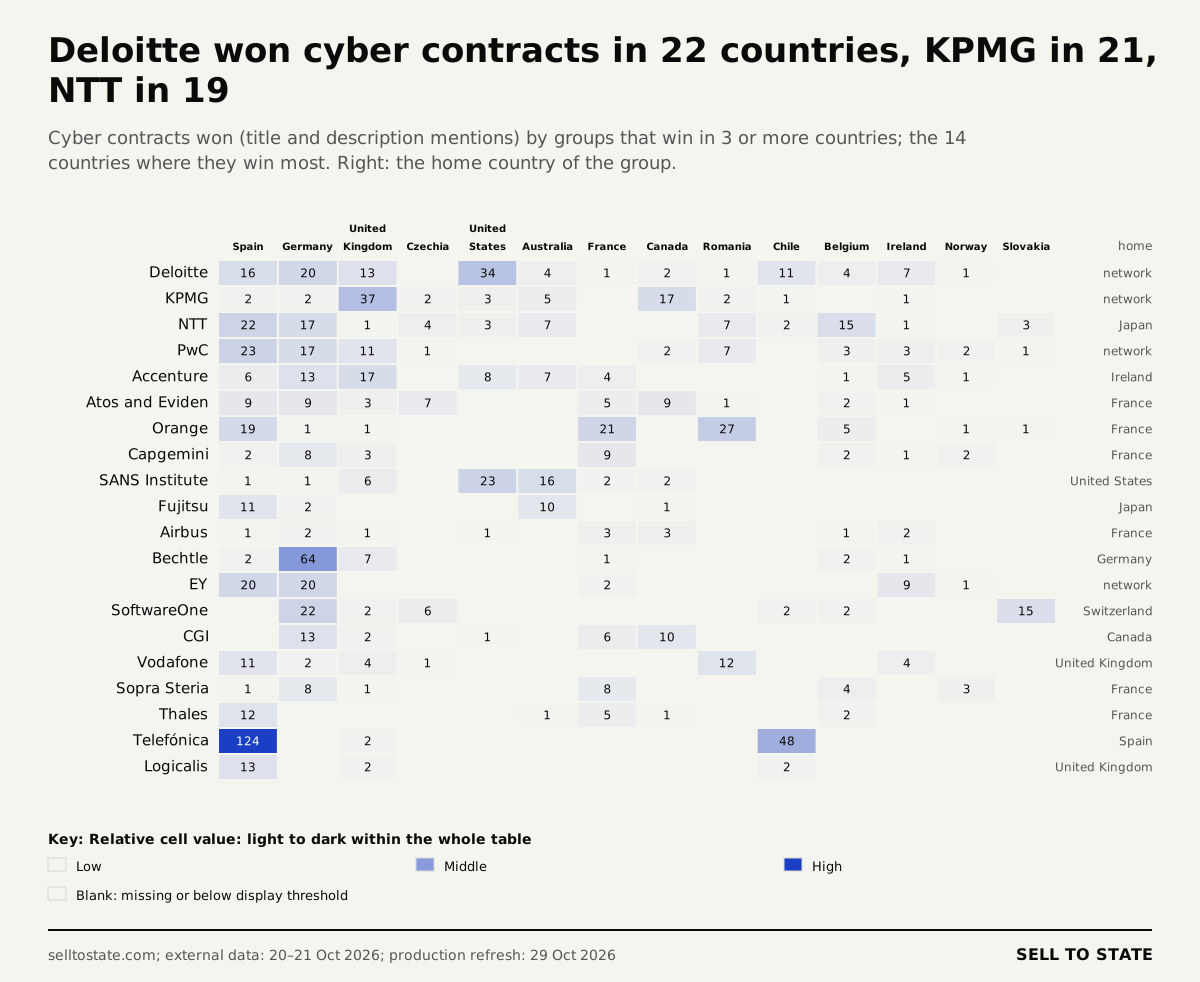
V38: Deloitte won cyber contracts in 22 countries, KPMG in 21, NTT in 19. PNG · SVG
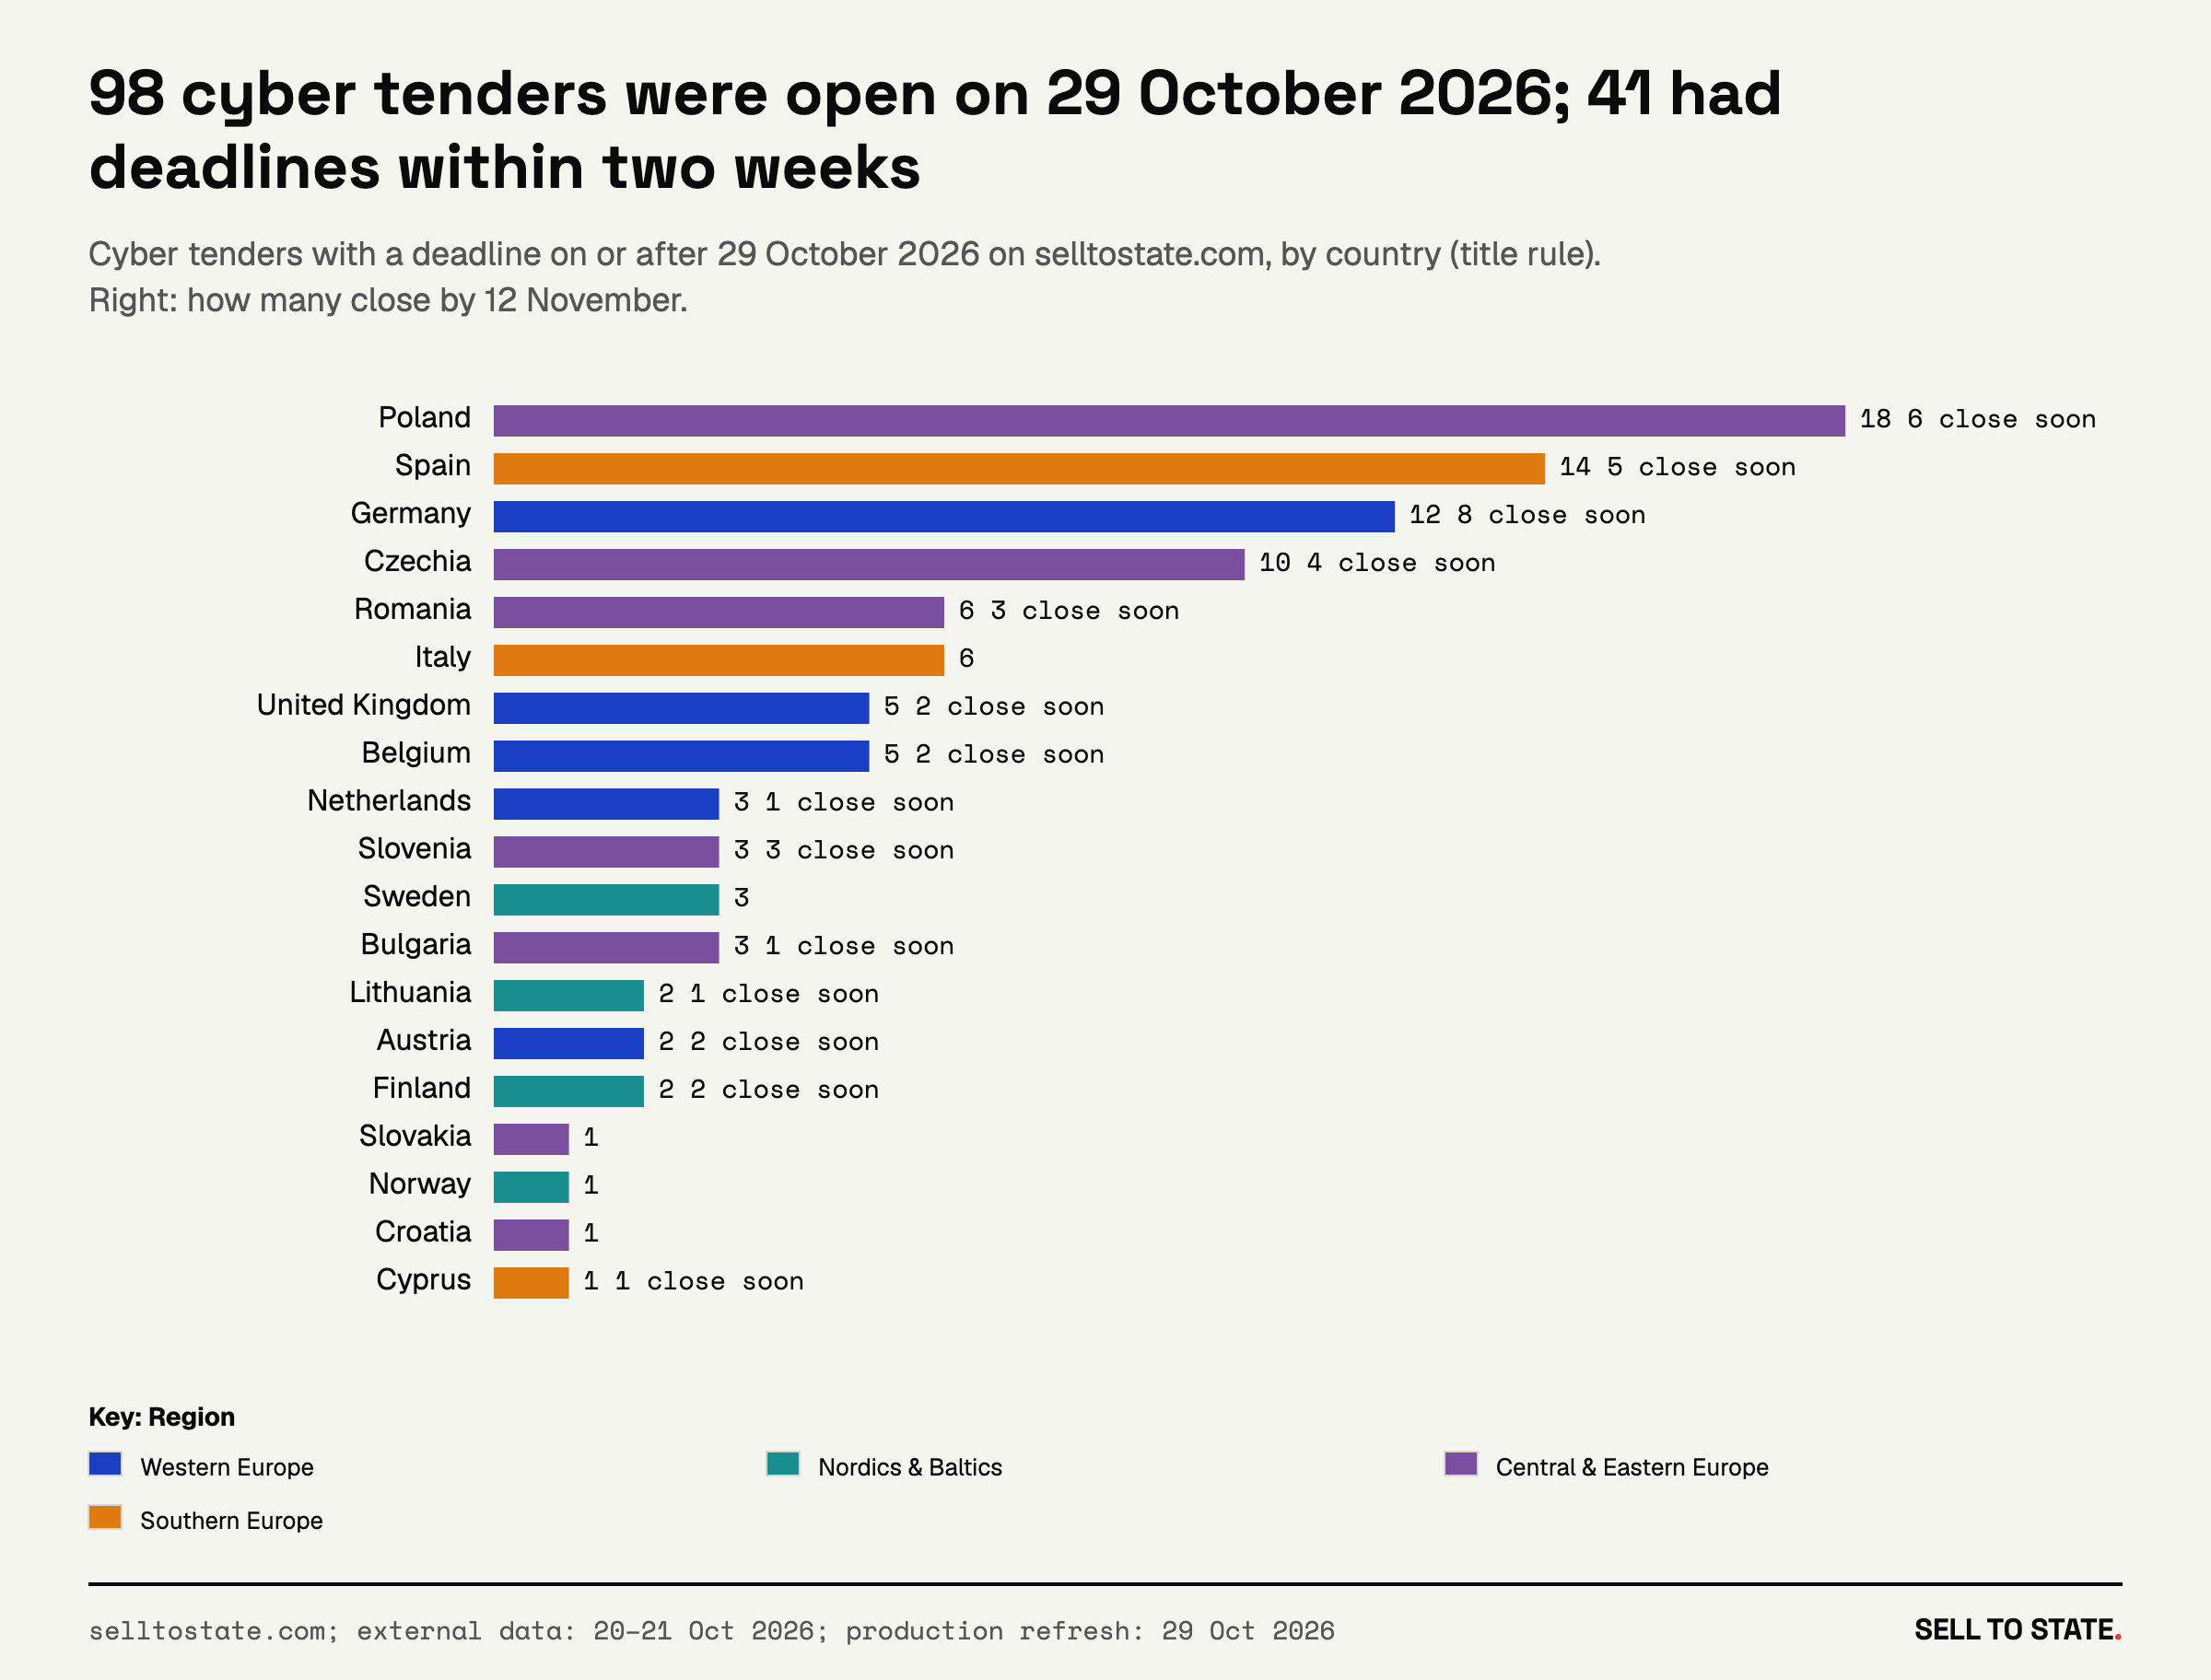
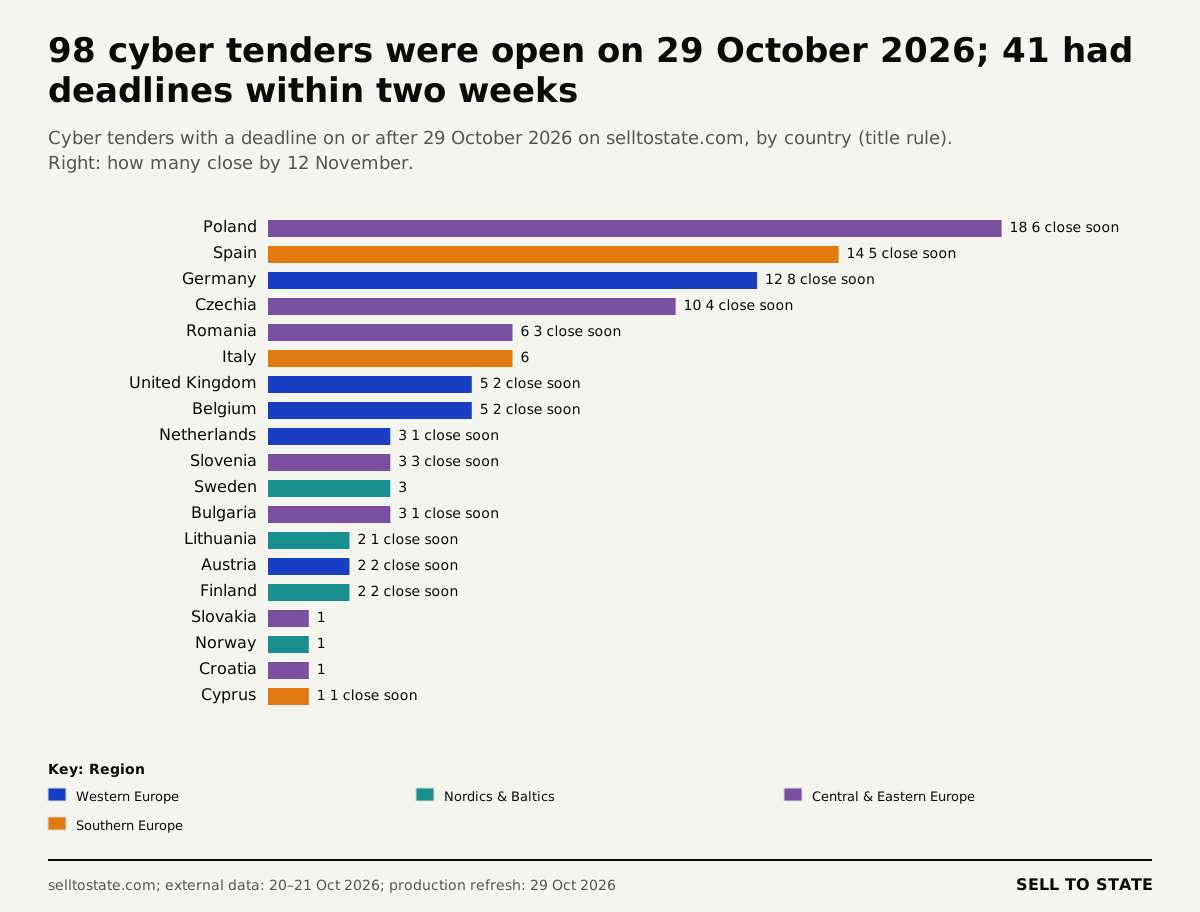
V39: 98 cyber tenders were open on 29 October 2026; 41 had deadlines within two weeks. PNG · SVG
Governments in our 59-country study awarded $4.9 billion in cybersecurity contracts in their last complete fiscal year. These countries hold 27% of the world’s people and 39% of its land. The annual total covers the 56 countries with a complete fiscal year; the United States accounts for 48% of it.
The real market is larger. Many purchases state no usable award value. Contracts where cyber is one part of a wider IT purchase are not in the total. Classified defence buying is not published.
We read 42,840 public procurements for cybersecurity in 59 countries, Q1 2024 to Q3 2026. They come from 27.8 million procurements of 34 sources.
Most countries buy cyber more often than in 2024. In 34 of 55 countries, a larger share of public procurements bought cybersecurity in the last four complete quarters than in 2024. The median country’s procurement rate grew 11.2%. In Europe, Poland accounts for most of the extra procurements, and notices that name EU funds grew. Outside Europe, the median country grew 2.8%, and almost no tender names a law or a fund.
Cybersecurity spending grew outside the United States and fell by half in it. Here, spending means published contract award values, which can cover several years of work. The records show commitments, with no measure of when buyers pay. On the same fiscal quarters, cybersecurity spending outside the United States grew 7.0%. US federal cybersecurity spending fell from $1.54 billion to $791 million. US agencies bought more often, in smaller contracts, and a few very large contracts of fiscal 2025 did not come back. Inside the median country, the median contract value rose 8%.
Who buys and what. In the United States, defence accounts for 43% of cybersecurity spending; in Europe it accounts for 2.7%. Licence renewals are 36% of cyber purchases. Fortinet is the most named vendor in 23 of 36 countries, and local resellers win those contracts. 98 cyber tenders with a known deadline were open on selltostate.com on 29 October 2026.
Methodology: 27.8M procurements from 34 sources, 42,840 buy cybersecurity
We took all published procurements from Q1 2024 to Q3 2026 from 34 sources in 59 countries, and searched them for cybersecurity in the languages of each country. Each country has one primary source, the same as in our study of AI buying, so that each country is counted one way through the whole period. External cybersecurity extracts date from 20 to 21 October 2026; their denominators retain the AI study’s 16 October snapshot. We refreshed the seven production primary sources and both sides of their rates on 29 October. The open-tender list uses the same refresh date. We keep the original country cohort and each country’s source; the other historical extracts retain their original dates.
The unit is the record of the source. A TED notice, an OCDS procurement process, a US contract action, a Colombian signed contract, a Japanese award, a Prozorro procedure. The rate is cyber records per 10,000 records of the same source, country and quarter. For production sources, a procurement key combines the agency and the normalized first 150 description characters. Both counts use that key within the same quarter. Duplicate candidates retain the award record with the largest stated value.
Complete quarters. A quarter counts when the source has 50 or more procurements in it and 60% or more of the country’s median quarter. 46 country-quarters are partial and out, 6 of them in Q3 2026, the United States among them: the US Department of Defense publishes its contracts 90 days late. Growth compares 2024 with the last four complete quarters of each country.
The search. Four families of terms. Cyber words: "cybersecurity", "kybernetická bezpečnost", "cyberbezpieczeństwo", "ciberseguridad", サイバー and their forms. Information security: "seguridad de la información", "Informationssicherheit", 情報セキュリティ, "захист інформації". Product names: firewall, "cortafuegos", "pare-feu", antivirus, EDR, SIEM, SOC, WAF, penetration test, vulnerability scan. Vendor names: Fortinet, Sophos, ESET, Palo Alto Networks, Check Point, Kaspersky, Trellix, Tenable, Splunk, Barracuda and others. In TED and the CPV countries, the security CPV codes count too.
Two layers. The title layer is a procurement whose title names a term: cyber is the purchase. The description layer is a procurement where only the description names a term: cyber is one part of a wider contract, for example a firewall in a hospital IT package. A description match counts only when it names a concrete item (a product, a vendor, the security CPV code) or a cyber word next to a purchase noun ("cybersecurity services", "Lot 4: cybersecurity"). The rule drops 4,413 description mentions that name cyber only as a requirement, in an agency name or in a narrative.
False matches. Each rule removes a known trap. "Firewall" is a fire wall in building works and a firebreak in a forest. "Intrusion detection" is a burglar alarm, "penetration test" is a soil test, "antivirals" are drugs. "Kiberiti" is a match box in Swahili, CyberHo and Cyber TM are surgical lasers, and Barracuda is a boat and a hard disk. Agency names (CISA, BSI, ANSSI, NISC) are removed before the search.
How good the search is. We labelled 1,462 rows by hand. In the title layer, after three rounds, 84.1% of the matches bought cybersecurity, 13.8% bought a security part of a wider purchase and 2.1% were false. In the description layer, the first round found 18.1% false matches. After two more rounds, the rule keeps 93% of the true cyber purchases and 92% of the true parts, and 4.2% of the rows that it keeps are false.
Project names. A title that names cyber only in the name of a funded project ("w ramach projektu", "en el marco del proyecto") is out. There are 518 of them. Building works for a cyber centre, venues, catering and a theatre play about cyberbullying are out too.
Labels. Every procurement gets a purchase type from its title, a capability (what it protects or does), the level and sector of the buyer, the funding programme and the law that it names, and the vendors that it names. A hospital is a buyer whose name is a hospital or a clinic. The utility check identifies water, energy, transport and waste operators and sector authorities from buyer names. It excludes ministries, schools, hospitals and unrelated electronic-communications agencies. The categories can overlap. Utility growth compares the same calendar quarters of 2024 and 2026, with each country-quarter complete in both years.
Supplier names. We normalize case, punctuation and spaces. We merge the UK Phoenix Software Ltd and Limited names after a check against the company’s own acquisition announcement. A repeated supplier name on one procurement counts once. Other names remain separate, so the total counts normalized supplier names. The cross-border table separately groups named international firms and networks; it covers both search layers.
Values. Awarded values in US dollars at 2025 average rates (one euro = 1.13 dollars). A framework value above one million euros is a ceiling, so we leave it out. A TED award with two or more winners is a framework. We read the 82 cyber purchases of 20 million euros and more by hand and removed two values that were not plausible. When a source repeats the same title and the same value in one quarter, the value counts once: 298 values are repeats. A few large IT contracts account for most of the description-layer value. Cybersecurity spending totals use only the title layer, so they exclude the full value of those wider contracts.
Fiscal years. 47 countries end the budget year in December, 6 in June, 5 in March and the United States in September. Money compares this fiscal year so far with the same fiscal quarters of last year, on quarters that are complete in both. So the year-end quarter and the partial quarters do not move the result. The yearly market total sums each country’s last complete fiscal year; 56 of the 59 countries have one.
What is not comparable. TED shows only contracts above the EU thresholds. National portals in Latin America and Africa show every purchase, down to a $900 course. USAspending shows every contract action. So the rate compares well over time inside a country, and between countries with the same kind of source.
Coverage. 59 countries have at least four quarters and 2,000 procurements. We have no open bulk data for India, China, South Korea, Indonesia or Vietnam. GDP per capita is at purchasing power parity, in constant 2021 international dollars (World Bank).
Each family was read by hand until the false matches were few.The title and the description counts move together.
Government cybersecurity spending by country
The annual total combines each country’s last complete fiscal year. The $4.9 billion covers 56 countries with a complete year. The historical counts and procurement-rate comparisons cover a wider group of 59 countries. A published award can commit a buyer to several years of work. Missing award values make the spending totals lower bounds.
Cyber purchases were worth $4.3 billion in 2024 and $4.8 billion in 2025. The first three quarters of 2026 hold $3.1 billion, against $4.0 billion in the same quarters of 2025. The quarterly chart includes the partial US quarter. Q3 2026 holds 598,000 US procurements, against 1.52 million in Q3 2025, because of the defence reporting delay. Use the matched fiscal-quarter comparisons below for the change in spending.
Each third quarter is the end of the US fiscal year. The last US quarter is still incomplete: the Department of Defense publishes its contracts 90 days late.
US cybersecurity spending fell; spending elsewhere rose 7.0%
We compare fiscal years on the same complete quarters. Each country compares this fiscal year so far with the same fiscal quarters of last year. Outside the United States, cybersecurity spending went from $1.61 billion to $1.73 billion. With the United States, it went from $3.16 billion to $2.52 billion.
Each country compares the same fiscal quarters in both years, so the year-end quarter and the incomplete quarters do not move the result.
The US decline combines fewer large awards and smaller typical contracts. In the first three quarters of fiscal 2026, US agencies placed 673 cyber purchases, against 602 a year earlier. The median US purchase fell from $145k to $118k.
The largest awards were smaller. The five largest US cyber purchases of the first three quarters of fiscal 2025 held $560 million; in fiscal 2026, $185 million. The largest was a $311.2 million interim award of the Department of State. The State Department went from $314 million to $3.1 million, the Department of Energy from $201 million to $25 million.
Defence bought more often in smaller contracts. The Department of Defense placed 363 cyber purchases, against 291. Its median purchase fell from $193k to $108k, and its total from $687 million to $460 million.
The decline extends beyond the largest awards. Without the five largest contracts, US cybersecurity spending went from $983 million to $606 million. The 90th percentile fell from $4.7 million to $2.6 million.
European cybersecurity spending rose through Poland
European cybersecurity spending rose 4.4%, while spending outside Poland fell 18.4%. On matched fiscal quarters, published award values rose from $1.01 billion to $1.06 billion. Those totals cover 850 awards with a value before and 1,110 after. Poland rose from $38 million to $262 million; the rest of Europe fell from $973 million to $794 million.
Europe: 850 awards with values before and 1,110 after. More frequent purchases and larger spending totals are separate measures.
Spending rose in 22 of 55 countries on matched fiscal quarters. Large awards and missing values affect each country’s result. More frequent cybersecurity purchases can coincide with lower award totals.
Country spending table: calendar-year totals and matched fiscal-year changes
The table shows every country by calendar year, with the fiscal-year change on the right. A country whose fiscal year ends in March or June can move one way by calendar year and the other way by fiscal year. Some countries state few values: Germany states a value for 12% of its cyber purchases.
Each row is shaded on its own scale. A country whose fiscal year does not end in December can move one way by calendar year and the other way by fiscal year.
Cybersecurity procurement frequency by country
Cyber buying is densest in Central Europe. Of the countries with 20,000 or more procurements, Slovakia buys cyber most often: 233 of every 10,000 procurements in the last four complete quarters. Poland follows with 215, Czechia with 180. The United States has 2.5, because its source counts every contract action, including each order under a framework.
The 59 countries hold 27% of the world's people and 39% of its land. Grey: no open procurement data.
The median country went from 38 cyber procurements per 10,000 in Q1 2024 to 59 in Q3 2026. The 25th and the 75th percentile moved up too. The number of countries per quarter changes because we use complete quarters only.
The middle of the field moved up; the top quarter moved up most.
In 34 of 55 countries, the rate grew between 2024 and the last four complete quarters. Three countries more than doubled it: Poland, Slovakia and Luxembourg. The United Kingdom went from 81 to 111, Greece from 117 to 164. In 21 countries the rate fell, among them Germany (76 to 69), France (34 to 27) and the Netherlands (64 to 58).
A coloured dot to the right of the grey one is growth.
Outside Europe, the median procurement rate grew 2.8%
Outside Europe, 13 of 24 countries grew, and the median one by 2.8%. Only 1.4% of their cyber procurements in 2026 name a fund or a law, against 1.0% in 2024. These counts describe explicit mentions. Programmes and regulations can affect a purchase without appearing in its notice.
Each panel prints the first and last observed quarterly rates and their dates. These are quarterly endpoints, separate from the annual growth comparison.
North America.Mexico went from 20 to 30, Canada from 61 to 59, the United States from 2.3 to 2.5. The US rate is low because its source counts every contract action.
Latin America. The median country grew 1.7%. Colombia went from 13 to 12 and Brazil from 27 to 26. Licence renewals and individual specialists make up much of the region’s cyber purchases.
Asia-Pacific.Singapore went from 123 to 121 and Japan from 46 to 54; 3 of 4 countries grew.
Africa. The median country grew 0.7%. South Africa went from 66 to 81. Nigeria fell from 32 to 14 and Kenya from 44 to 37.
Comparisons with income and government AI procurement
Richer countries buy cyber more often, with wide differences inside each income group
The richest third of the countries buys a median of 63 cyber procurements per 10,000; the poorest third buys 26. The middle third buys 57.5. The thirds split at a GDP per capita of $31k and $52k, at purchasing power parity. The rank correlation of income and rate is 0.37: Slovakia and Poland buy cyber more often than richer Germany and Norway.
The link is loose (rank correlation 0.37): Slovakia and Poland buy cyber more often than richer Germany and Norway.
Countries in each income group increased their procurement rate. 11 of the 19 richest countries and 9 of the 18 poorest grew. The chart describes their income and procurement rates over time. It cannot isolate the effect of income on cyber purchases.
Governments buy cyber 2.5 times as often as AI, down from 4.8 times
In 48 of 52 countries, cyber procurements outnumber AI procurements in the last four quarters. In 2024, the median country bought cyber 4.8 times as often as AI. Now it buys cyber 2.5 times as often. AI buying grew in 48 of 49 countries, in the median country 2.1 times; cyber buying grew in 34 of 55.
Dots above the dashed line buy cyber more often than AI.
The two rates go together (correlation 0.61): a country that buys more of one buys more of the other. Differences between source units also affect these cross-country comparisons.
Cybersecurity funding and public-sector purchase waves
Europe placed 3,427 more cyber procurements a year in the last four complete quarters than in 2024, and 63% of the increase is Poland. The United Kingdom added 300, Spain 215 and Slovakia 148. Without Poland, 20 of 30 European countries grew, the median one by 15.7%.
Funds are named far more often than laws. European cyber procurements that name an EU fund went from 450 in 2024 to 909 in 2025 and 1,190 in the first nine months of 2026. 20.6% of the European cyber procurements in 2026 name a fund or a law, against 9.8% in 2024. The EU recovery fund appears most often among the named programmes. Its line falls in Q3 2026, after the last day for the work in Poland.
Funds are named far more often than laws.
A mention identifies a programme or a rule in the notice. NIS2 extended the scope of EU cybersecurity rules, including to waste and wastewater management. Member states had to transpose it by 17 October 2024. Tenders that name NIS2 went from 44 in 2024 to 148 in 2025. GDPR appears in 200 European cyber procurements in the last four quarters, up from 74 in 2024. The notices cite it as a data clause; the law dates from 2018. The EU medical device regulation appears in 5.
Hospital cybersecurity: KHZG, IROP and KPO
Across the 59 countries, hospitals place 6.8% of cyber procurements; Poland, Czechia and Germany hold 72% of all hospital cyber procurements in the study. Each of these countries has a programme that pays hospitals for cyber security.
Each country has a fund that pays hospitals for cyber security, and each fund has a last day.
Germany: the hospital future fund (KHZG). The law requires that at least 15% of each grant goes to IT security, and the first end date of the programme was in 2024. German hospitals placed 180 cyber procurements in 2024 and 55 in the first three quarters of 2026.
Czechia: the EU regional programme (IROP). In 2022 the programme opened calls for the cyber security of hospitals, police, fire services and regions. Czech hospitals peaked at 89 cyber procurements in Q3 2025 and placed 24 in Q3 2026.
Poland: the EU recovery plan (KPO). Investment D1.1.2 paid for digital records and cyber security in hospitals; its last day for the work was 7 August 2026. Polish tenders that name it went from 2 in 2024 to 558 in 2026. Polish hospitals went from 10% of the Polish cyber procurements in 2024 to 47% in 2026, with 498 in Q1 2026 and 67 in Q3 2026.
Water cybersecurity procurement and Poland’s Cyberbezpieczne Wodociągi programme
Water and sewage operators and sector authorities placed 388 cyber procurements in 27 countries. Their calendar-year inventory includes incomplete quarters. The growth check pairs the same complete quarters in both years.
Water-sector purchases rose from 69 to 104 on matched quarters, with Poland and the United Kingdom accounting for the increase. We compare Q1 to Q3 of 2024 and 2026, and keep each country-quarter only when it is complete in both years. Poland went from 0 to 29 and the United Kingdom from 3 to 13. The other countries together went from 66 to 62. Polish notices use the project name "Cyberbezpieczny Wodociąg". The CPPC programme page names it "Cyberbezpieczne Wodociągi" and identifies the EU recovery plan as its funding source.
Transport-sector purchases rose from 78 to 122; electricity, gas and heat purchases fell from 116 to 106. Waste and recycling went from 9 to 2, too few records for a broad conclusion. These are procurement counts. We lack the total number of all purchases by utilities, so we cannot calculate a procurement rate for each sector.
Each row prints both counts. Buyer-name matches include operators and sector authorities; they do not show the reason for a purchase.
These sector patterns identify buyers and programmes for a closer check. The European Commission’s NIS2 summary lists cybersecurity duties for covered energy, transport, water, wastewater and waste operators. A seller can check each buyer’s compliance work, grant and renewal dates. The records cannot establish whether fear of terrorism or sabotage caused the purchase.
Water and sewage cybersecurity purchases by country and calendar year
The table is an inventory of published records. Its annual totals include incomplete quarters. Use the matched-quarter comparison above for the change over time.
Each row is shaded on its own scale. Outside Poland and the United Kingdom, most rows hold a few procurements a year.
Government cybersecurity buyers
In the United States, defence accounts for 43% of cybersecurity spending; in Europe it accounts for 2.7%. US federal awards account for 94% of defence cybersecurity spending in the study. Across all countries, defence places 7% of cyber purchases and accounts for 23% of their value. In Europe, local and regional governments account for 13%, hospitals and health services 13%, tax, finance and customs 13%, police and justice 11%.
94% of defence cybersecurity spending in the study comes from US federal awards.
National governments place 44% of all cyber procurements, local governments 18%. In Europe and Latin America, regions, towns and public companies buy a large share. In North America, the sources cover mostly the national government.
Europe buys more at the local and regional level; North America and Asia-Pacific buy nationally.
The largest single buyers are US defence departments. The Navy placed 422 cyber procurements, the Air Force 374 and the Army 225. Outside the United States, the largest buyers are a Honduran buyer unit named Unidad Central (251) and the Bank of Zambia (132). The market is wide: 10,932 buyers placed at least one cyber procurement, and the 10 largest placed 4.8% of them.
10,932 buyers placed at least one cyber procurement.
What governments buy: cybersecurity products and services
Licence renewals are the largest purchase type. Licence renewals and subscriptions are 36% of the cyber purchases and 33% of their money. Managed security services are 7% of the purchases and 11% of the money. These services can cover people and operations over several years.
Read across a row: a type that is darker in money than in count buys large contracts.
The service types divide the work by task and duration. An audit checks the security once. A compliance project writes the rules and the documents. A managed service runs the security every day. A licence renewal buys one product, while a new system buys several products and the labour to install them, so its median is 7.4 times as large.
A licence buys one product for a period; a managed service and a new system buy people and work.
Cybersecurity purchase types: definitions and real contract examples
Each example is a real purchase near its type’s median contract value.
Type
What the buyer gets
A real purchase near the median
Median
Licence renewals and subscriptions
The right to use a named product for a period, with updates and support
"TENABLE RENEWAL FY25", Federal Aviation Administration, United States: $38,063
$38,054
Appliances and hardware
Firewall boxes, switches, servers, keys and other devices
"Cyber security in AGEL hospitals: switches", AGEL clinic, Czechia: $68,026
$67,810
New systems: supply and set-up
A new capability: products plus the work to install and connect them, once
"Installation solution Microsoft Defender Plan 2", town of Drummondville, Canada: $273,755
$280,334
Managed security services
A provider runs part of the security for the buyer, often around the clock: a security operations centre (SOC), monitoring, response
Security operations centre (SOC) services, Agência para a Modernização Administrativa, Portugal: $208,960
$208,838
Tests and audits
An outside check: a penetration test, a vulnerability scan, an ISO 27001 audit
Information security audits, Québec health insurance board, Canada: $44,566
$44,837
Advice, policies and compliance
Paper work: risk analysis, security policies, preparation for ISO 27001 or NIS2, studies
ISO 27001 information security management system, Rwanda Civil Aviation Authority: $103,406
"Online cybersecurity training courses", US Navy: $19,401
$20,211
Individual specialists
One person on a service contract; 87.6% of them in Colombia
Professional services for the information security system, police pension fund, Colombia: $13,366
$10,692
Insurance
A cyber-risk insurance policy
"Annual Cyber insurance policy 2024-2025", University of Bedfordshire, United Kingdom: $51,424
$49,775
The purchase mix is stable over time. Managed security services went from 6.3% of the cyber purchases in the first four quarters to 7.5% in the last four. The other types moved less.
Each colour is one purchase type. Brown: products with no stated form; grey: all other types.
Each region buys its own mix. North America buys the most licence renewals, 49% of its cyber purchases, many of them US federal orders for Trellix, Tenable or Cisco. Latin America buys the most individual specialists, 19%, because Colombia hires cyber specialists on personal service contracts. Central and Western Europe buy more new systems and services: their tenders come from TED, which shows the larger contracts.
Cyber purchases by region and purchase type.
Cybersecurity capabilities bought in each region
Network and perimeter security is the largest need in 5 of 10 regions and 25.4% of all cyber purchases. Endpoint protection and antivirus is 16.9%, monitoring, detection and response 12.8%, identity and access 1.5%. The labels describe what the purchase protects or does.
Firewalls and antivirus lead everywhere; identity, data protection and email security are small in every region.
Cybersecurity contract values: medians, percentiles and concentration
The median cyber purchase went from $28k in Q1 2024 to $80k in Q3 2026, but the mix of sources made most of that change. TED contracts, which are above the EU thresholds, were 8.6% of the purchases with a value in 2024 and 19.8% in 2026. Latin American contracts, which are small, went from 45.9% to 34.7%. In the 21 countries with 20 or more valued purchases in both fiscal years, the median contract rose 8%, and it rose in 13 of them.
Most of the rise is the mix of sources: more European contracts, fewer Latin American ones.
Published contract values are larger in Europe than in Latin America. The median cyber purchase is $11k in Latin America, $12k in Africa, $97k in North America and $427k in Southern Europe. TED publishes only contracts above the EU thresholds. Purchase types also differ: a town’s antivirus renewal and a ministry’s managed service cover different work and periods.
European notices come from TED, which publishes only contracts above the EU thresholds.
Defence, police and tax agencies account for 63% of US cybersecurity spending and 27% of European cybersecurity spending. Every European sector has a median of $249k or more, and every Latin American sector $26k or less. These comparisons combine differences in source coverage, purchase types and buyers. They provide a starting range for a comparable contract.
Compare inside a column: the region and its source set the price level, the sector moves it less.
A few contracts hold most of the money. The largest 1% of cyber purchases hold 46% of the money. The median cyber purchase is $51k, and the middle half costs $11k to $261k.
One or two large contracts decide the yearly total of most countries.
Cybersecurity vendors, suppliers and contract winners
Fortinet leads the vendor names in public procurements
23% of cyber procurements name at least one vendor, and Fortinet is in 27.2% of them. Kaspersky is second with 13.5%, Sophos third with 8.3%. Fortinet is the most named vendor in 23 of 36 countries. ESET leads in Ukraine, where Kaspersky is banned, and Trellix and McAfee in the United States.
23% of cyber procurements name at least one vendor.
Cybersecurity vendors named in each country
ESET leads in Ukraine, Kaspersky in East Africa, Trellix in the United States.
Kaspersky fell from 15.3% to 5.5% of the vendor-naming procurements, and 98% of its mentions are in Latin America and Africa.Tanzania alone has 824 of the 1,355 mentions: 68.8% of the Kaspersky mentions sit inside a PC, laptop or office-supply tender that lists "Kaspersky antivirus" as one line. The EU and the United States have 12 together. The US Department of Commerce banned Kaspersky sales to US persons in 2024.
69% of the Kaspersky mentions sit inside a PC, laptop or office-supply tender.
Who wins government cybersecurity contracts
Fortinet is named in the titles of 2,005 cyber purchases and won 0 of them. Sophos won 2, Microsoft 13. The observed winners include resellers and integrators. Précicom Technologies won 181 cyber purchases from Quebec buyers, FCN 165, Thundercat 156 and Carahsoft 150 from US federal buyers. Softcat won 129 in the United Kingdom and Ireland.
The vendors that the tenders name almost never win; their resellers do.
Leading cybersecurity suppliers by regional market
Each panel ranks supplier names by purchases won inside that market. The country label identifies the market with the most purchases for that supplier. Colours use the same region palette as the buyer charts. We merge the verified UK Phoenix Software Ltd and Limited alias; other names remain separate. The total describes normalized supplier names. Several names can belong to one corporate group.
Counts cover this regional market only. Supplier names are not a consolidated ranking of corporate groups.Counts cover this regional market only. Supplier names are not a consolidated ranking of corporate groups.Counts cover this regional market only. Supplier names are not a consolidated ranking of corporate groups.Counts cover this regional market only. Supplier names are not a consolidated ranking of corporate groups.
Most TED awards with a winner country went to a domestic supplier. In TED, 96.7% of the cyber contracts with a winner country went to a company registered in the buyer’s country. Across the title-layer records, 7,810 normalized supplier names won at least one cyber purchase. The 10 most frequent names took 6.3% of the recorded wins.
Concentration of recorded supplier wins.
International cybersecurity supplier groups and networks
The wider two-layer search identifies 41 groups with cyber-related awards in three or more countries. Deloitte appears in 22, KPMG in 21, NTT in 19, PwC in 17, Atos and Eviden in 14, Accenture in 14, Orange in 13. These groups won 8% of the contracts with a named winner, and their median contract is $288,947, against $41,498 for all other winners. This comparison includes contracts where cyber is part of a wider purchase. The group rules combine subsidiaries and, for consultancies, networks of national firms.
Most groups win at home and in the neighbouring countries: French groups in France and Belgium, Nordic groups in the Nordics.
Open cybersecurity tenders: 29 October 2026 snapshot
On 29 October 2026, 98 cyber tenders with a known deadline were open on selltostate.com, in 19 countries. Poland had 18, Spain 14, Germany 12. 41 had deadlines within two weeks of the snapshot; the median tender closed in 18 days. 25 bought licence renewals, and 2 were for Polish water companies.
This is a dated inventory. Check the current deadline and documents in the live search before you plan a bid.
Poland, Spain and Germany had the most open cyber tenders in this snapshot.
For sellers
Size the market with comparable award data. The study records $4.9 billion in published awards across 56 countries’ last complete fiscal years. Check coverage, contract duration and the buyer’s purchase history before you treat an award total as annual demand.
Check funding windows. Hospital procurements peaked at different times in Germany, Czechia and Poland. Polish water notices name a specific grant. Read the programme terms, eligible buyers and deadlines before you build a list.
Check renewal conditions. Licence renewals are 36% of cyber purchases. Read the named product, licence period, reseller conditions and evaluation criteria in each tender. The study records winners; it cannot establish why a bid won.
Assess local resellers and integrators. In TED, 96.7% of cyber awards with a winner country went to a domestic supplier. Use the supplier lists to identify possible partners, then check their capabilities and authorizations.
Compare like contracts. Use the country, purchase type, contract duration and source threshold when you compare prices. The percentile charts show the spread that a single median hides.