By Vlad Nadymov 9 min read
Government spending data usually tells you how much a state spends. We used it to answer a different question: who wins the contracts. In the latest 12 months of our data, the top 1% of suppliers won 8% of Ireland's public contracts. In Uzbekistan, the top 1% won 47%.
Most of the government spending data online is US government spending data about federal budgets. We counted something else: 1,362,144 contract awards in the 39 countries where Sell to State holds more than 2,000 award records. Below is what the count shows country by country, then the same questions by contract value, and how to check your own market before you bid.
Most suppliers win one government contract
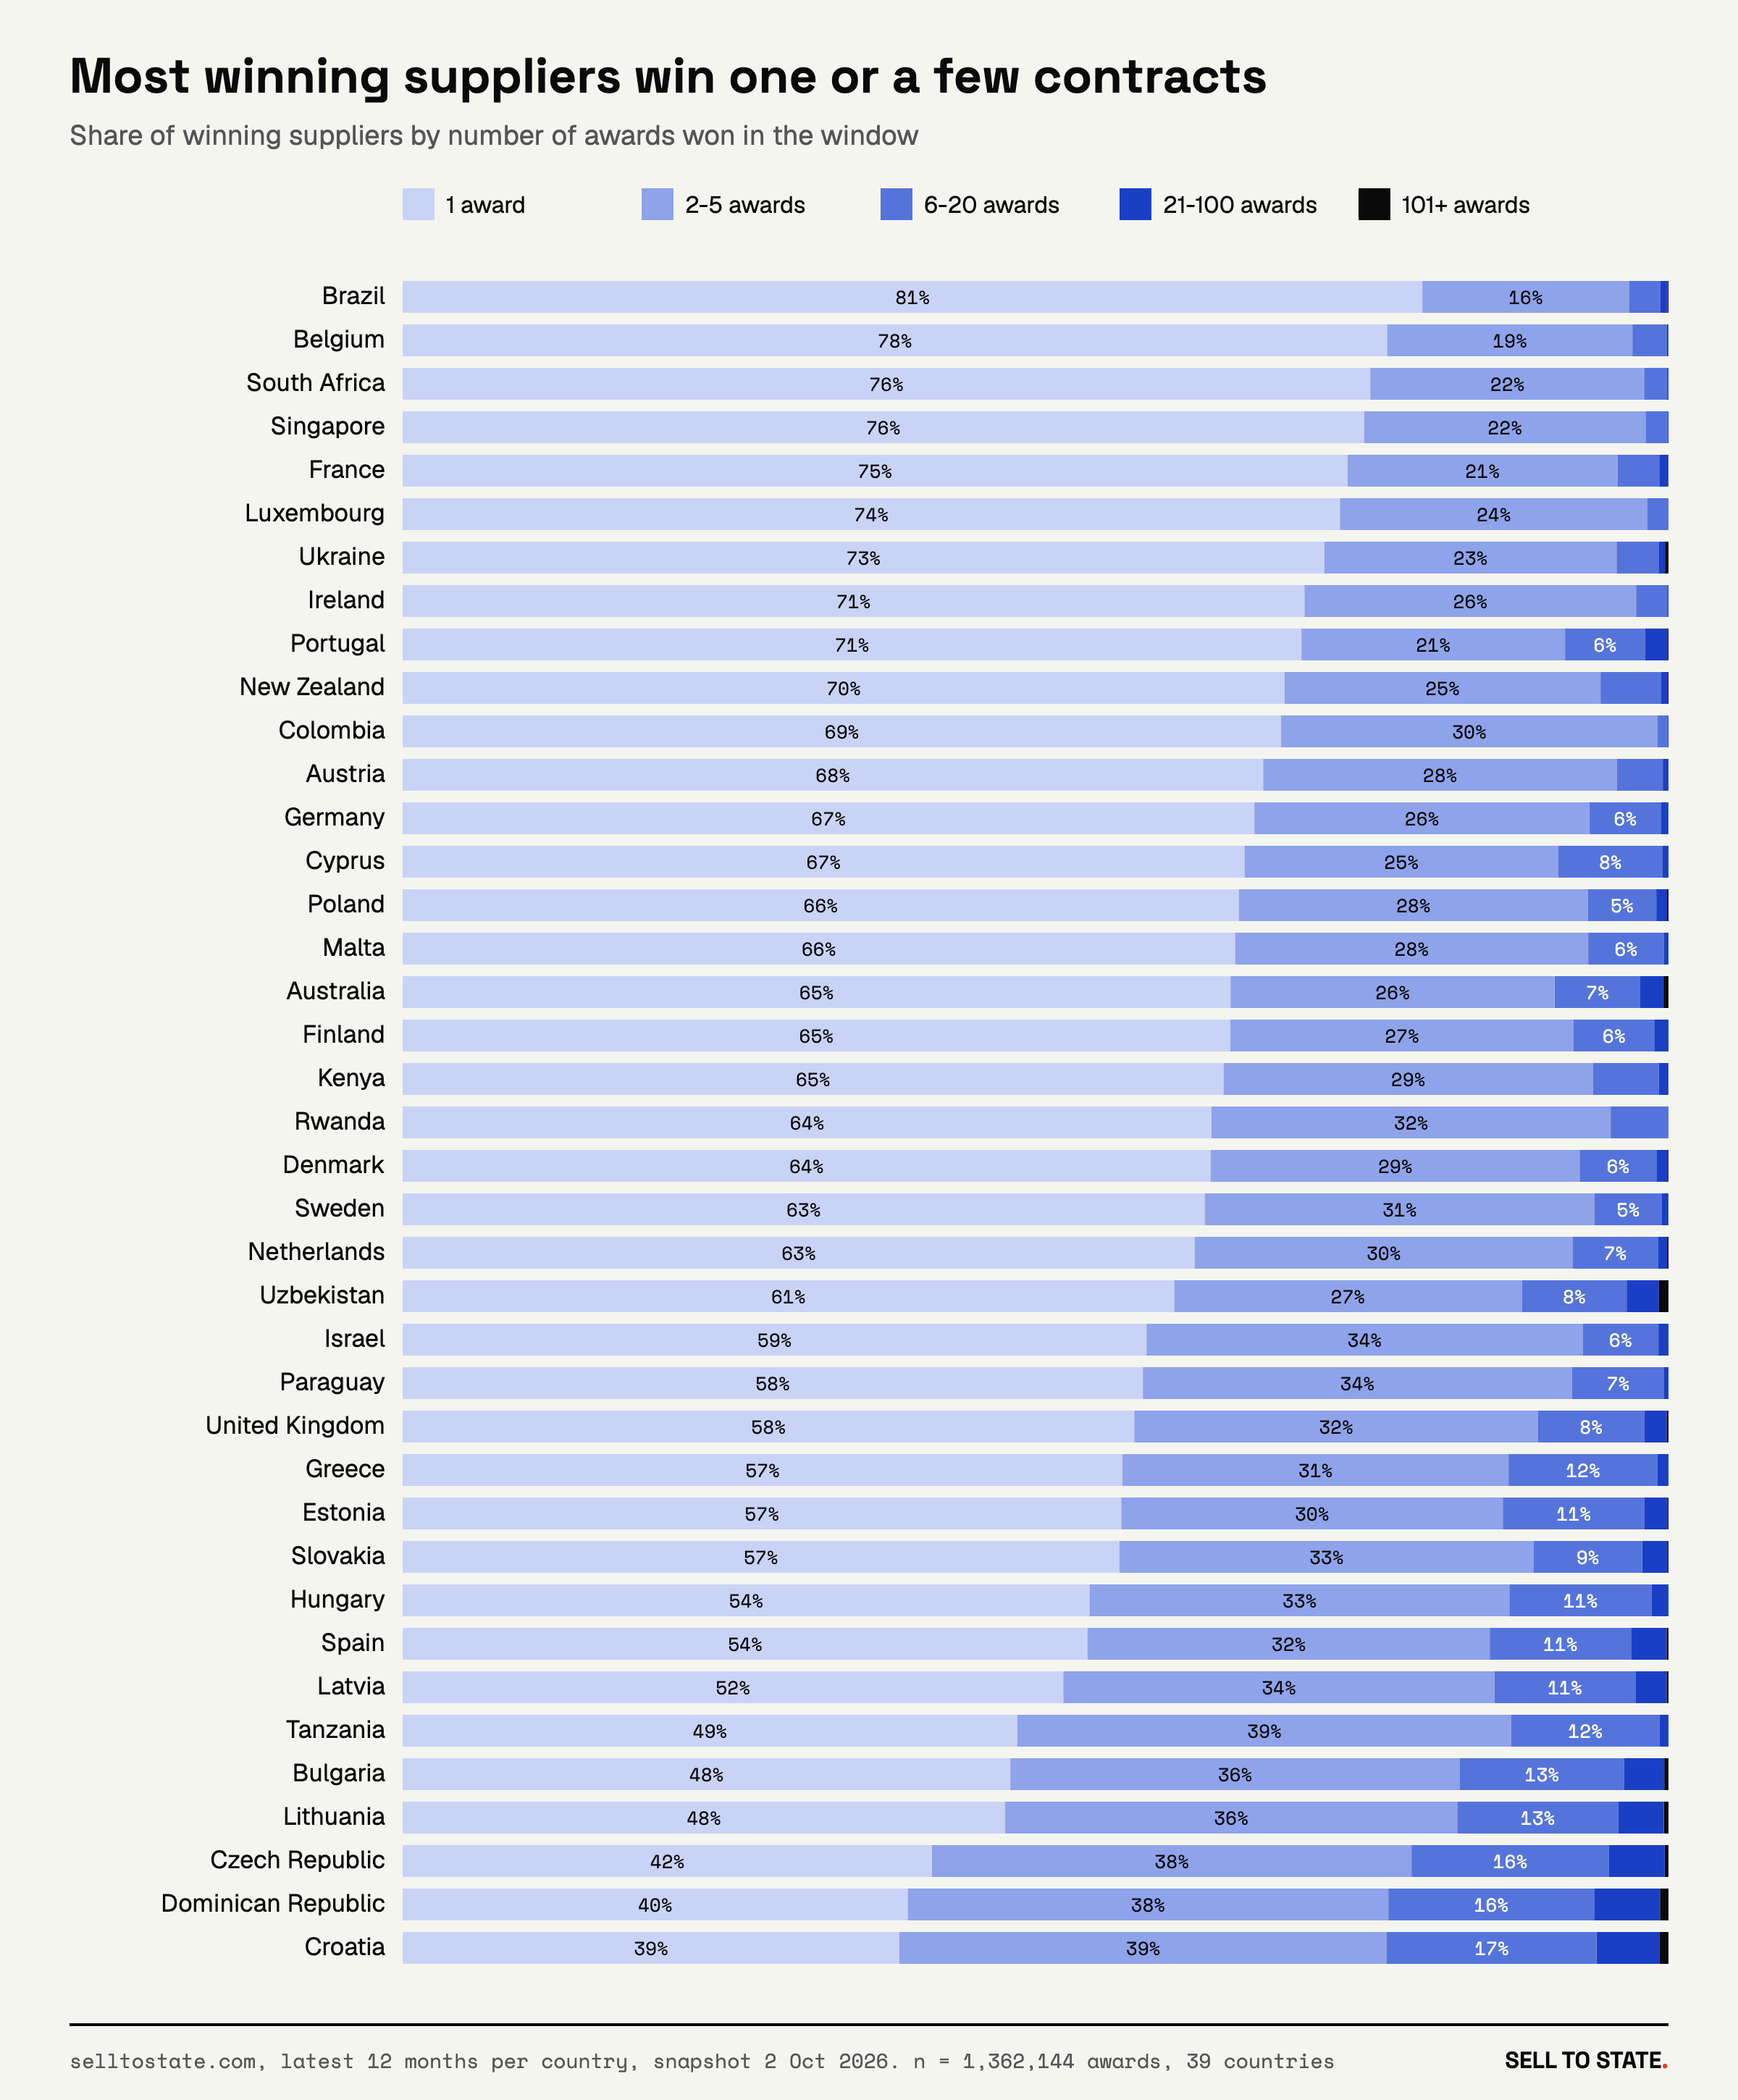
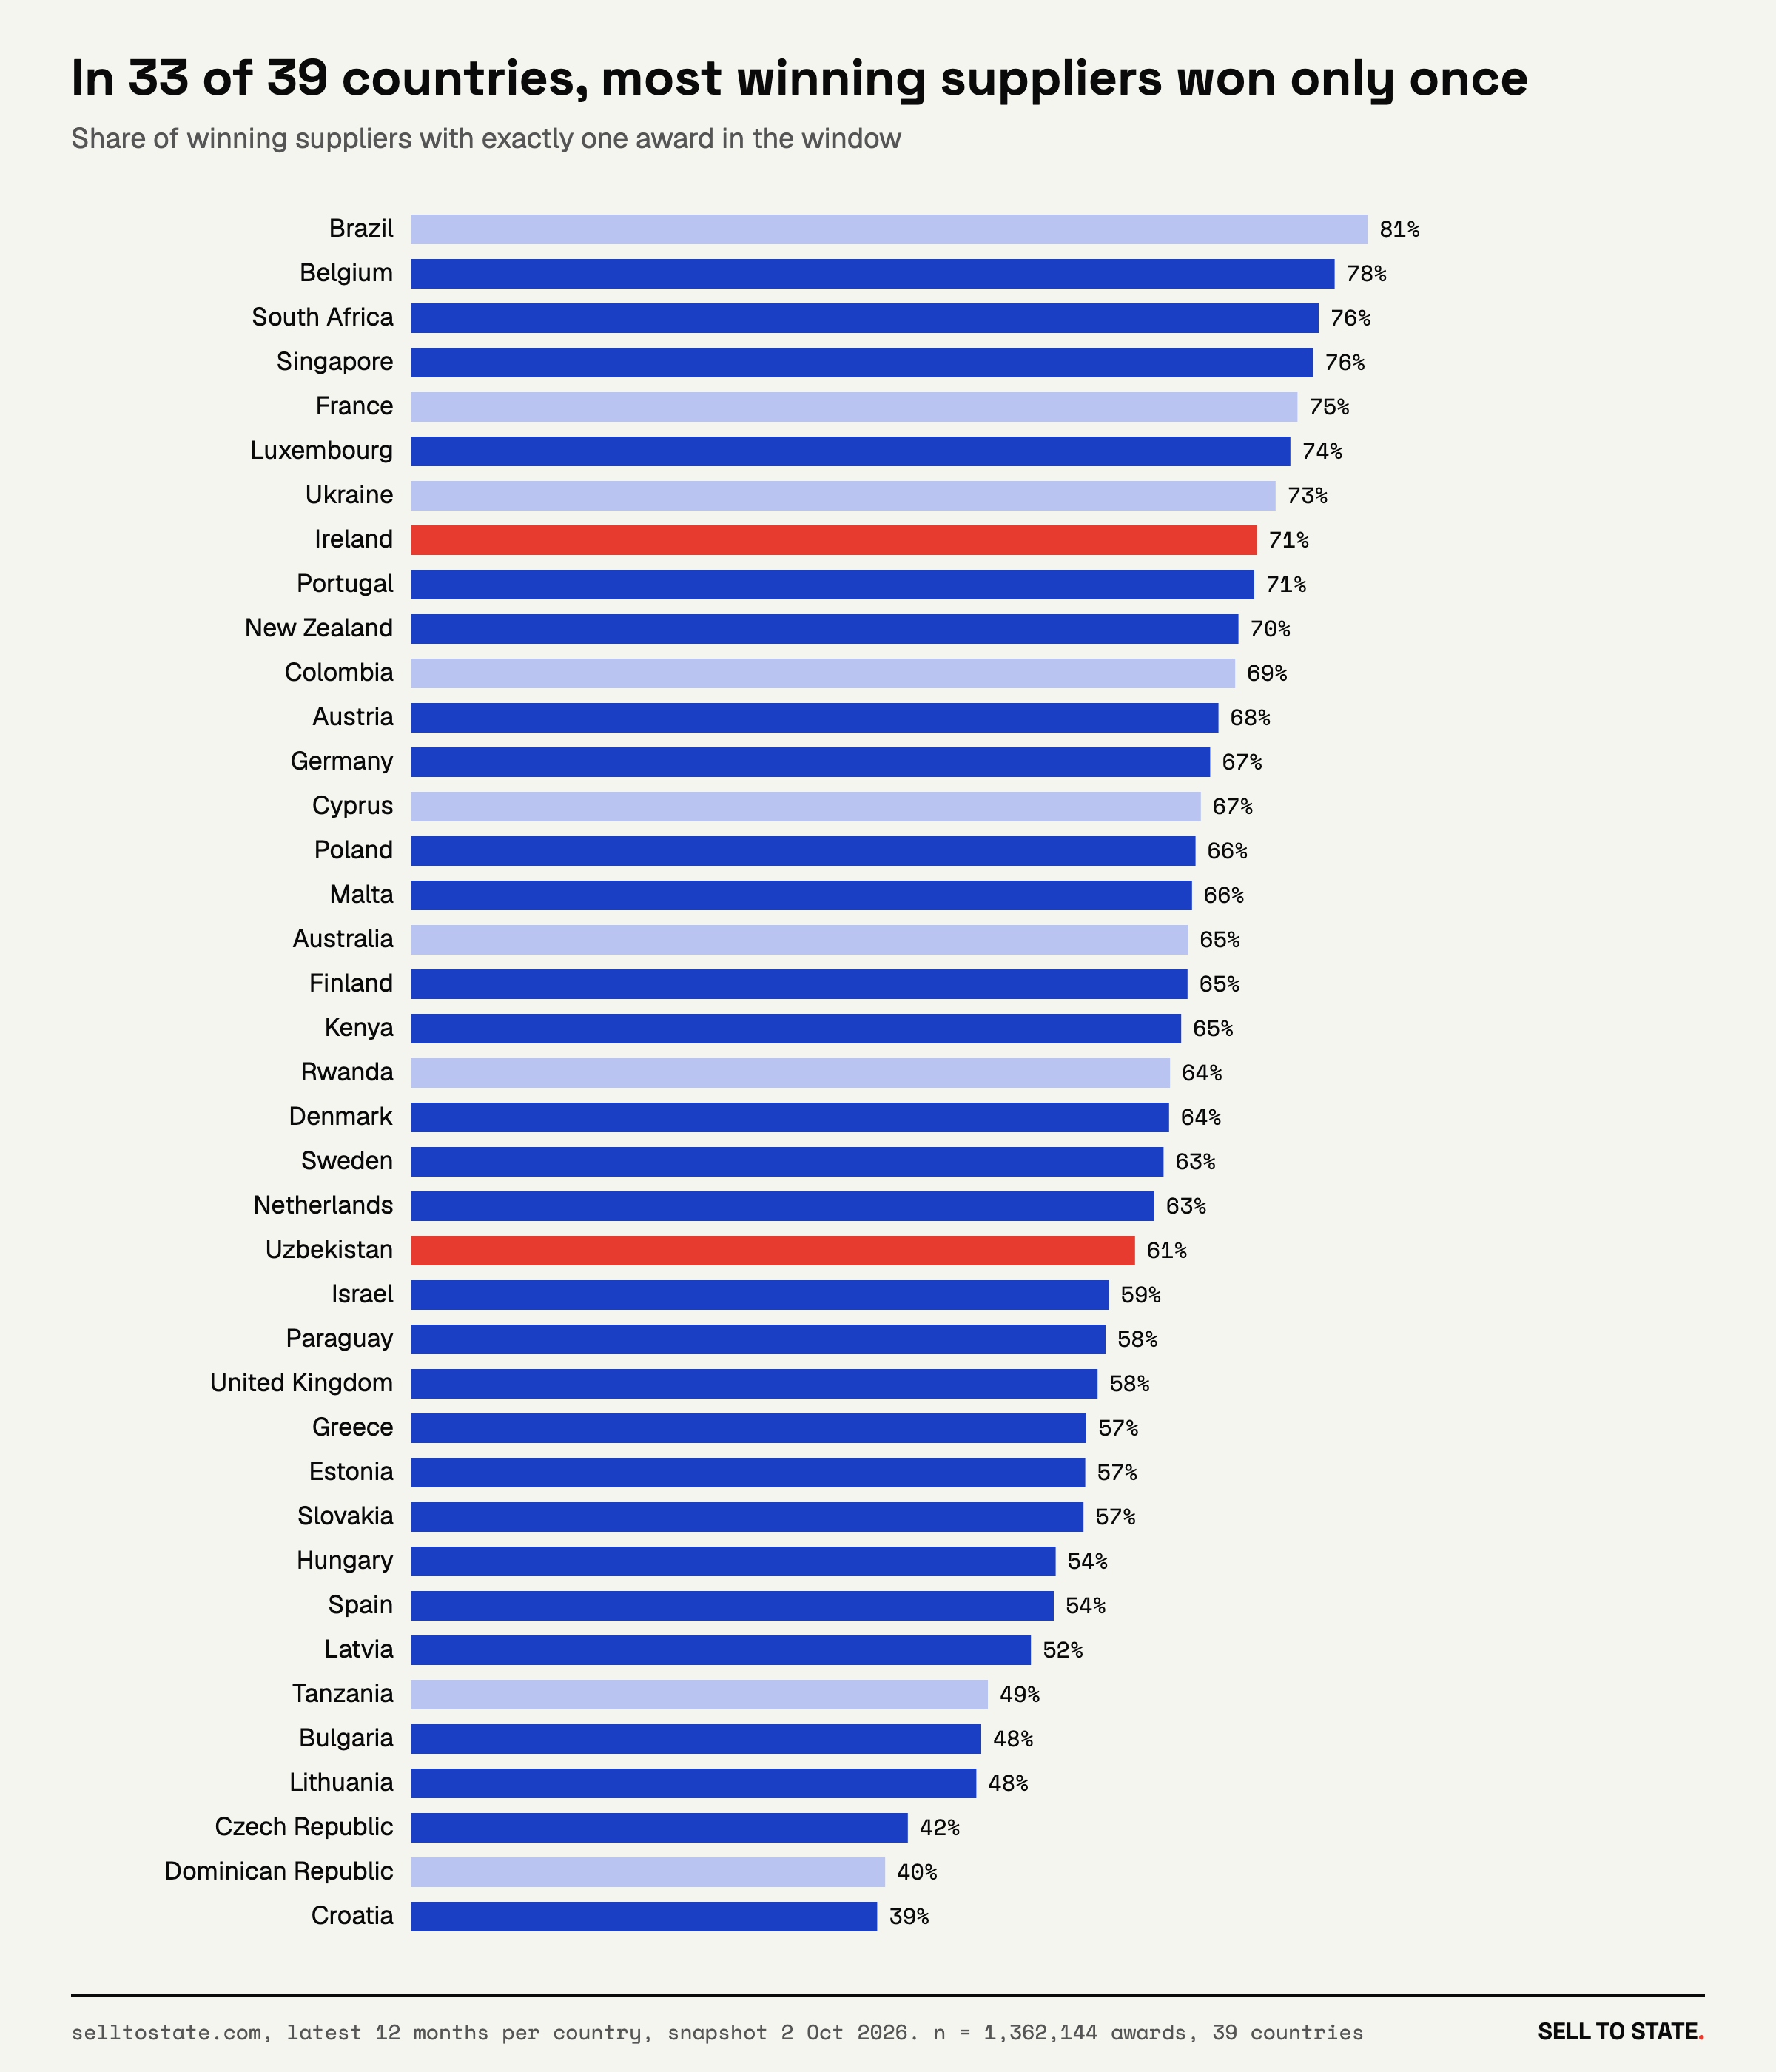
In 33 of the 39 countries, most winning suppliers won exactly one contract in the year. In Belgium, 78% of suppliers that won anything won only once. In Ireland the share is 71%, in Germany 67%, in the United Kingdom 58%. At the other end are the Czech Republic with 42% and Croatia with 39%.
For a bidder, a high one-award share is good news. It means buyers in that market sign with many firms they have not used before. The first contract is still hard work, but it is common.
Most contracts still go to repeat winners
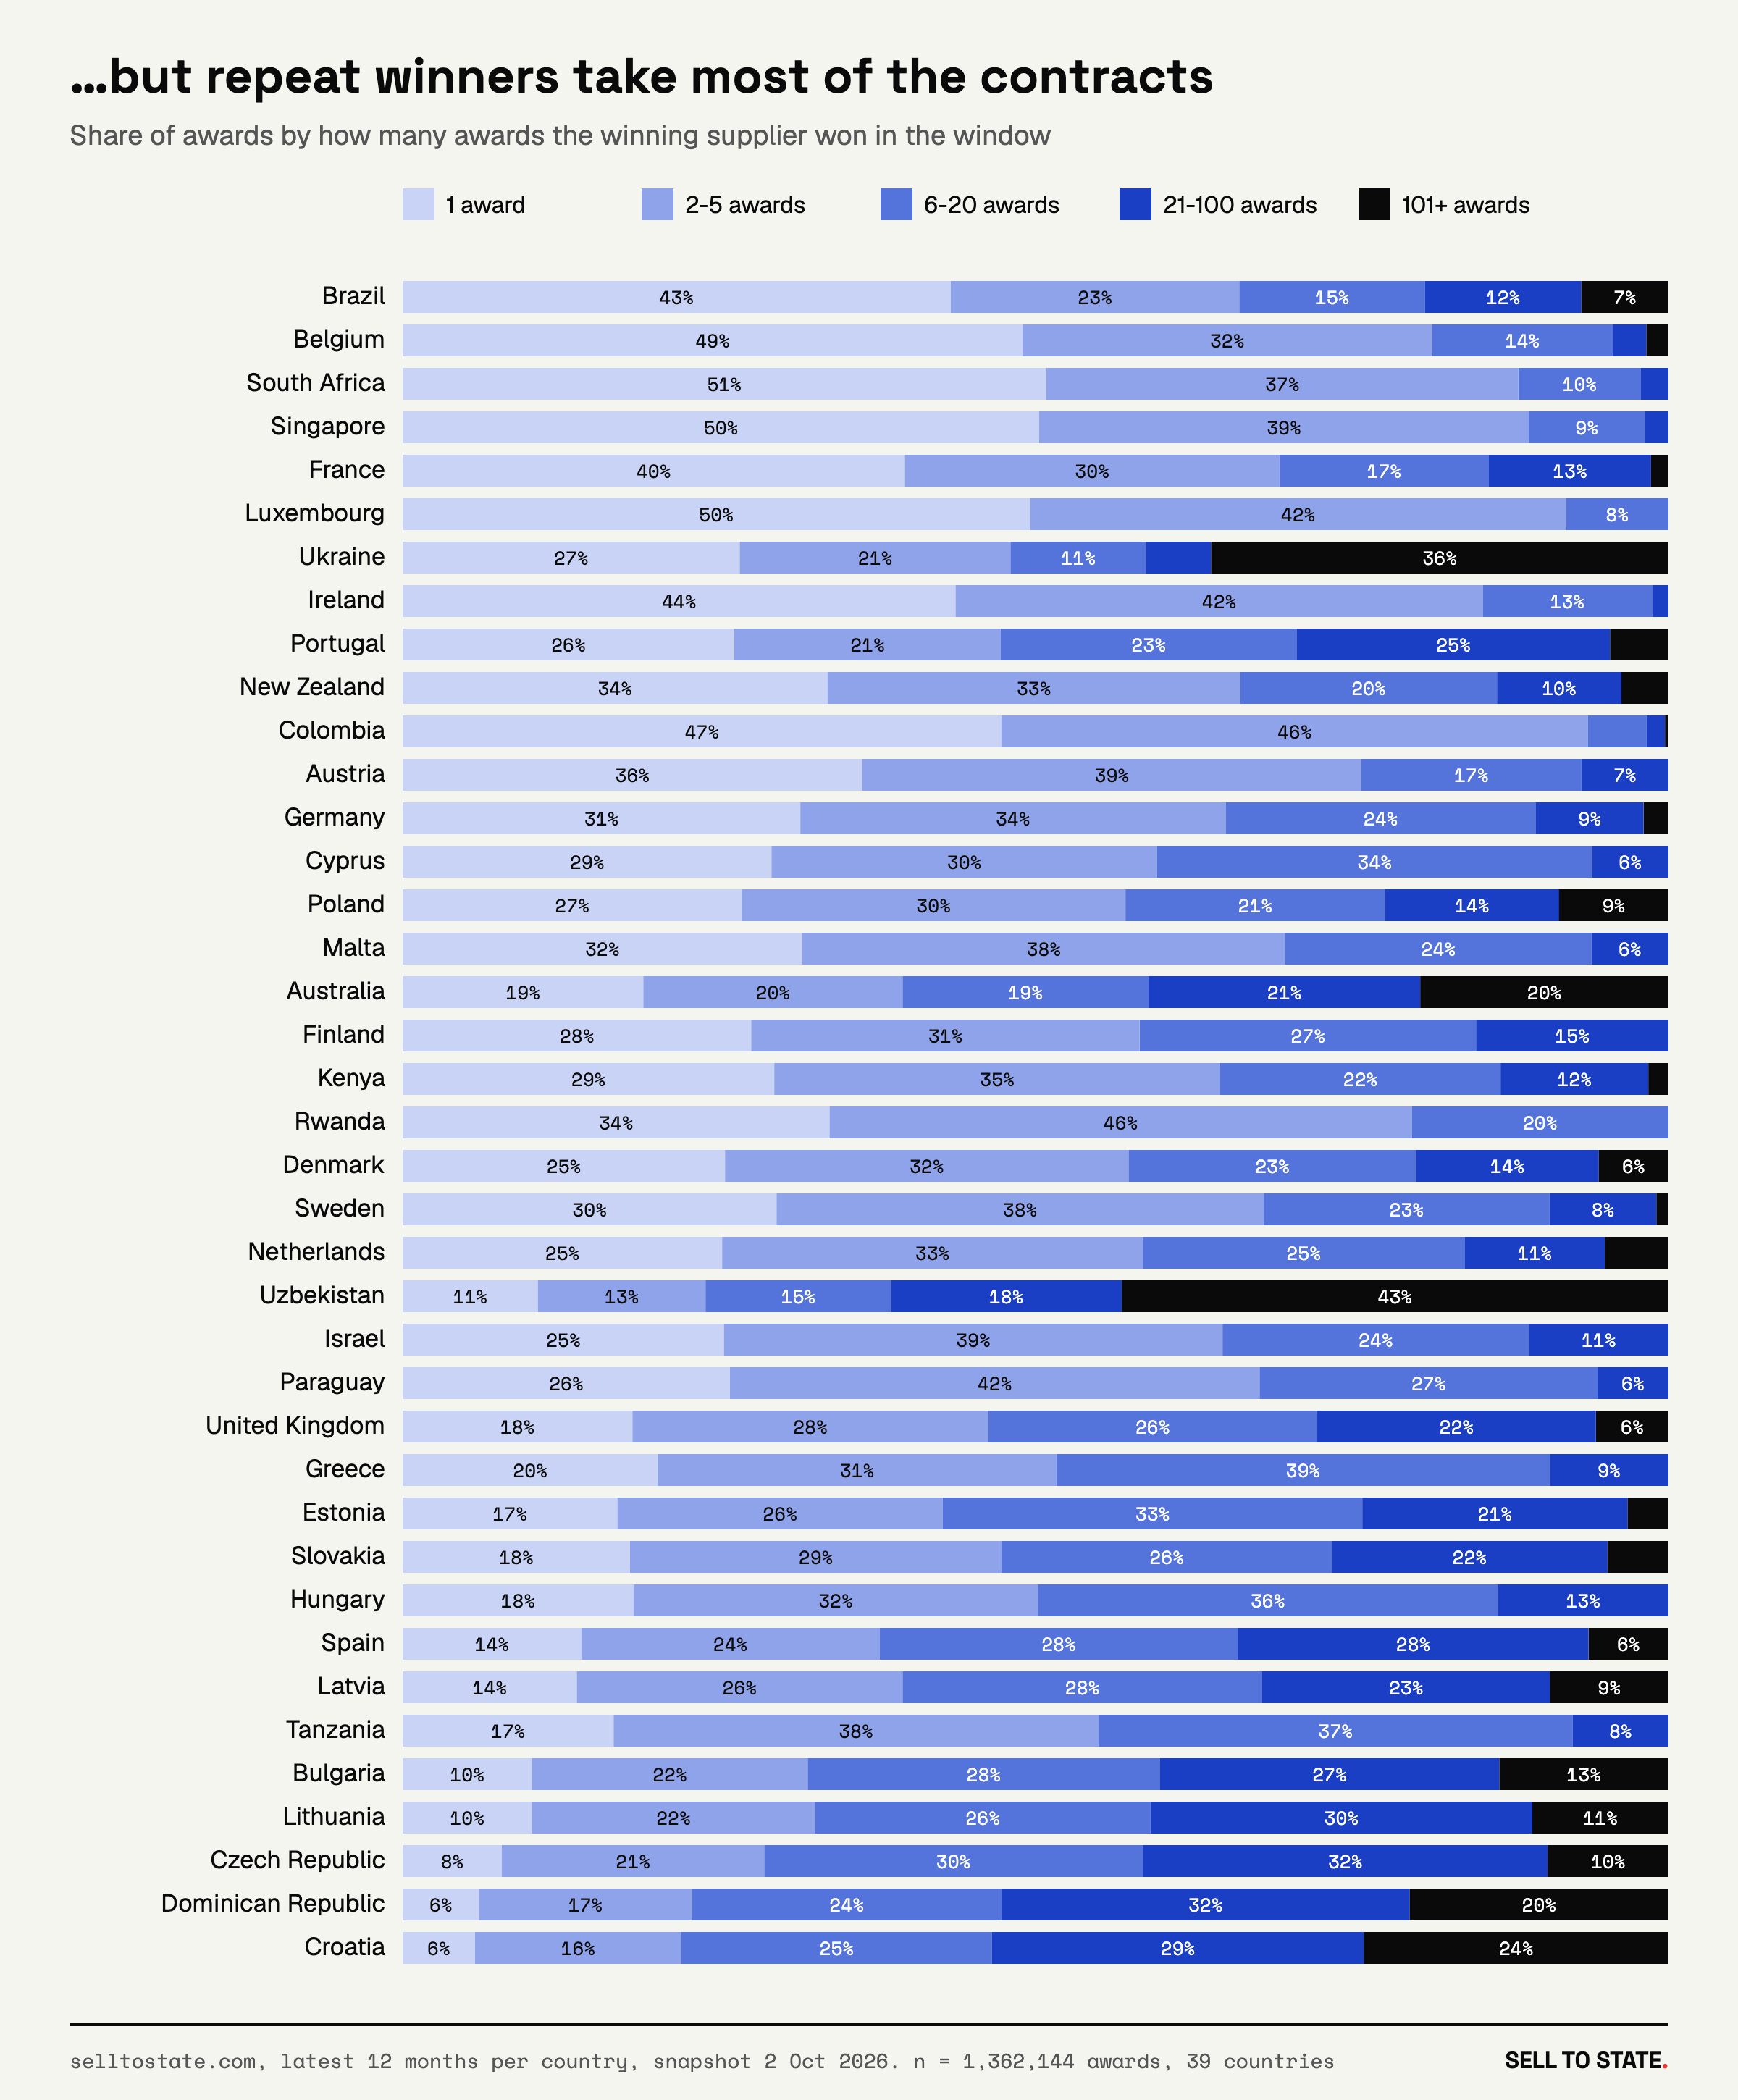
The one-time winners are many, but they do not hold most of the work. In the United Kingdom, suppliers with six or more awards are 10.3% of all winners and hold 53.7% of the contracts. In Spain the same group is 14.1% of winners and holds 62.3%. In Uzbekistan it is 11.6% of winners and 76.1% of the contracts.
Both facts are true at the same time. The long tail of one-time winners is long, and the head of repeat winners is heavy. Which one matters depends on what you sell: a one-off service or a repeat supply contract.
The concentration ranking: 39 countries
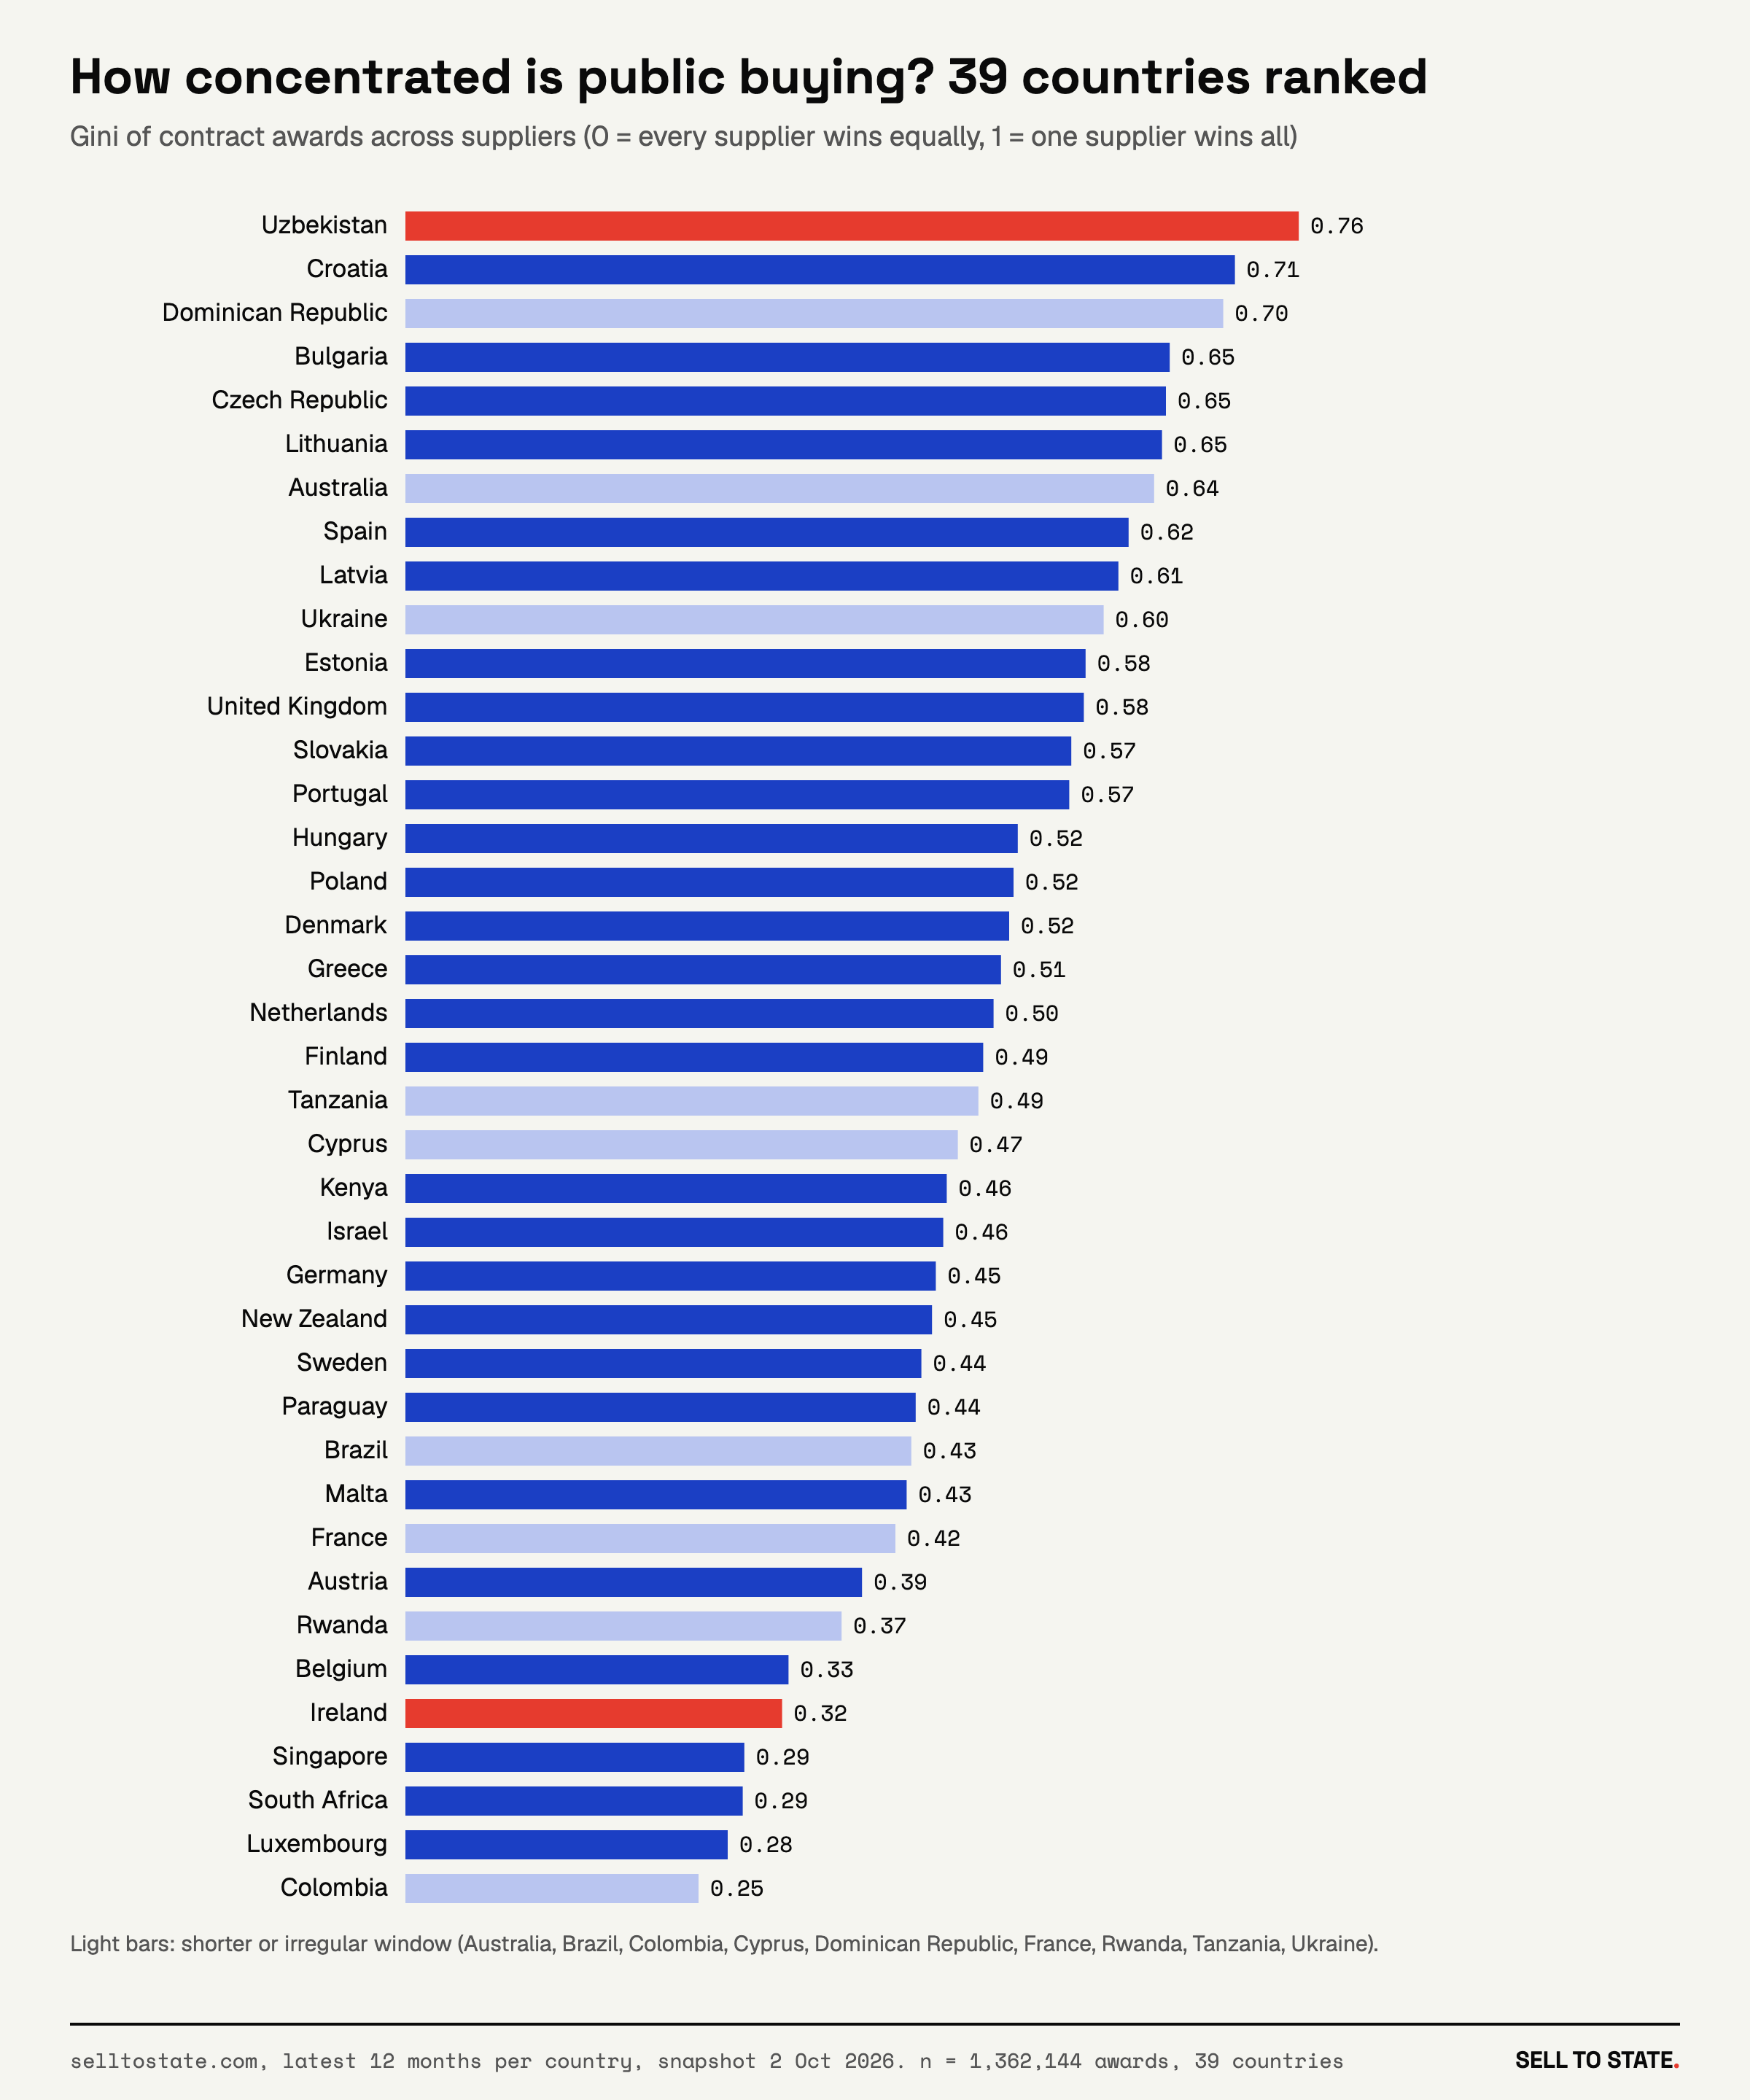
To compare countries with one number, we use the Gini coefficient of awards across suppliers. At 0, every supplier wins the same number of contracts. At 1, one supplier wins all of them. Uzbekistan (0.76), Croatia (0.71), Bulgaria (0.65) and the Czech Republic (0.65) are the most concentrated markets with a full 12-month window. Luxembourg (0.28), South Africa (0.29), Singapore (0.29) and Ireland (0.32) are the least concentrated.
Six markets, six curves
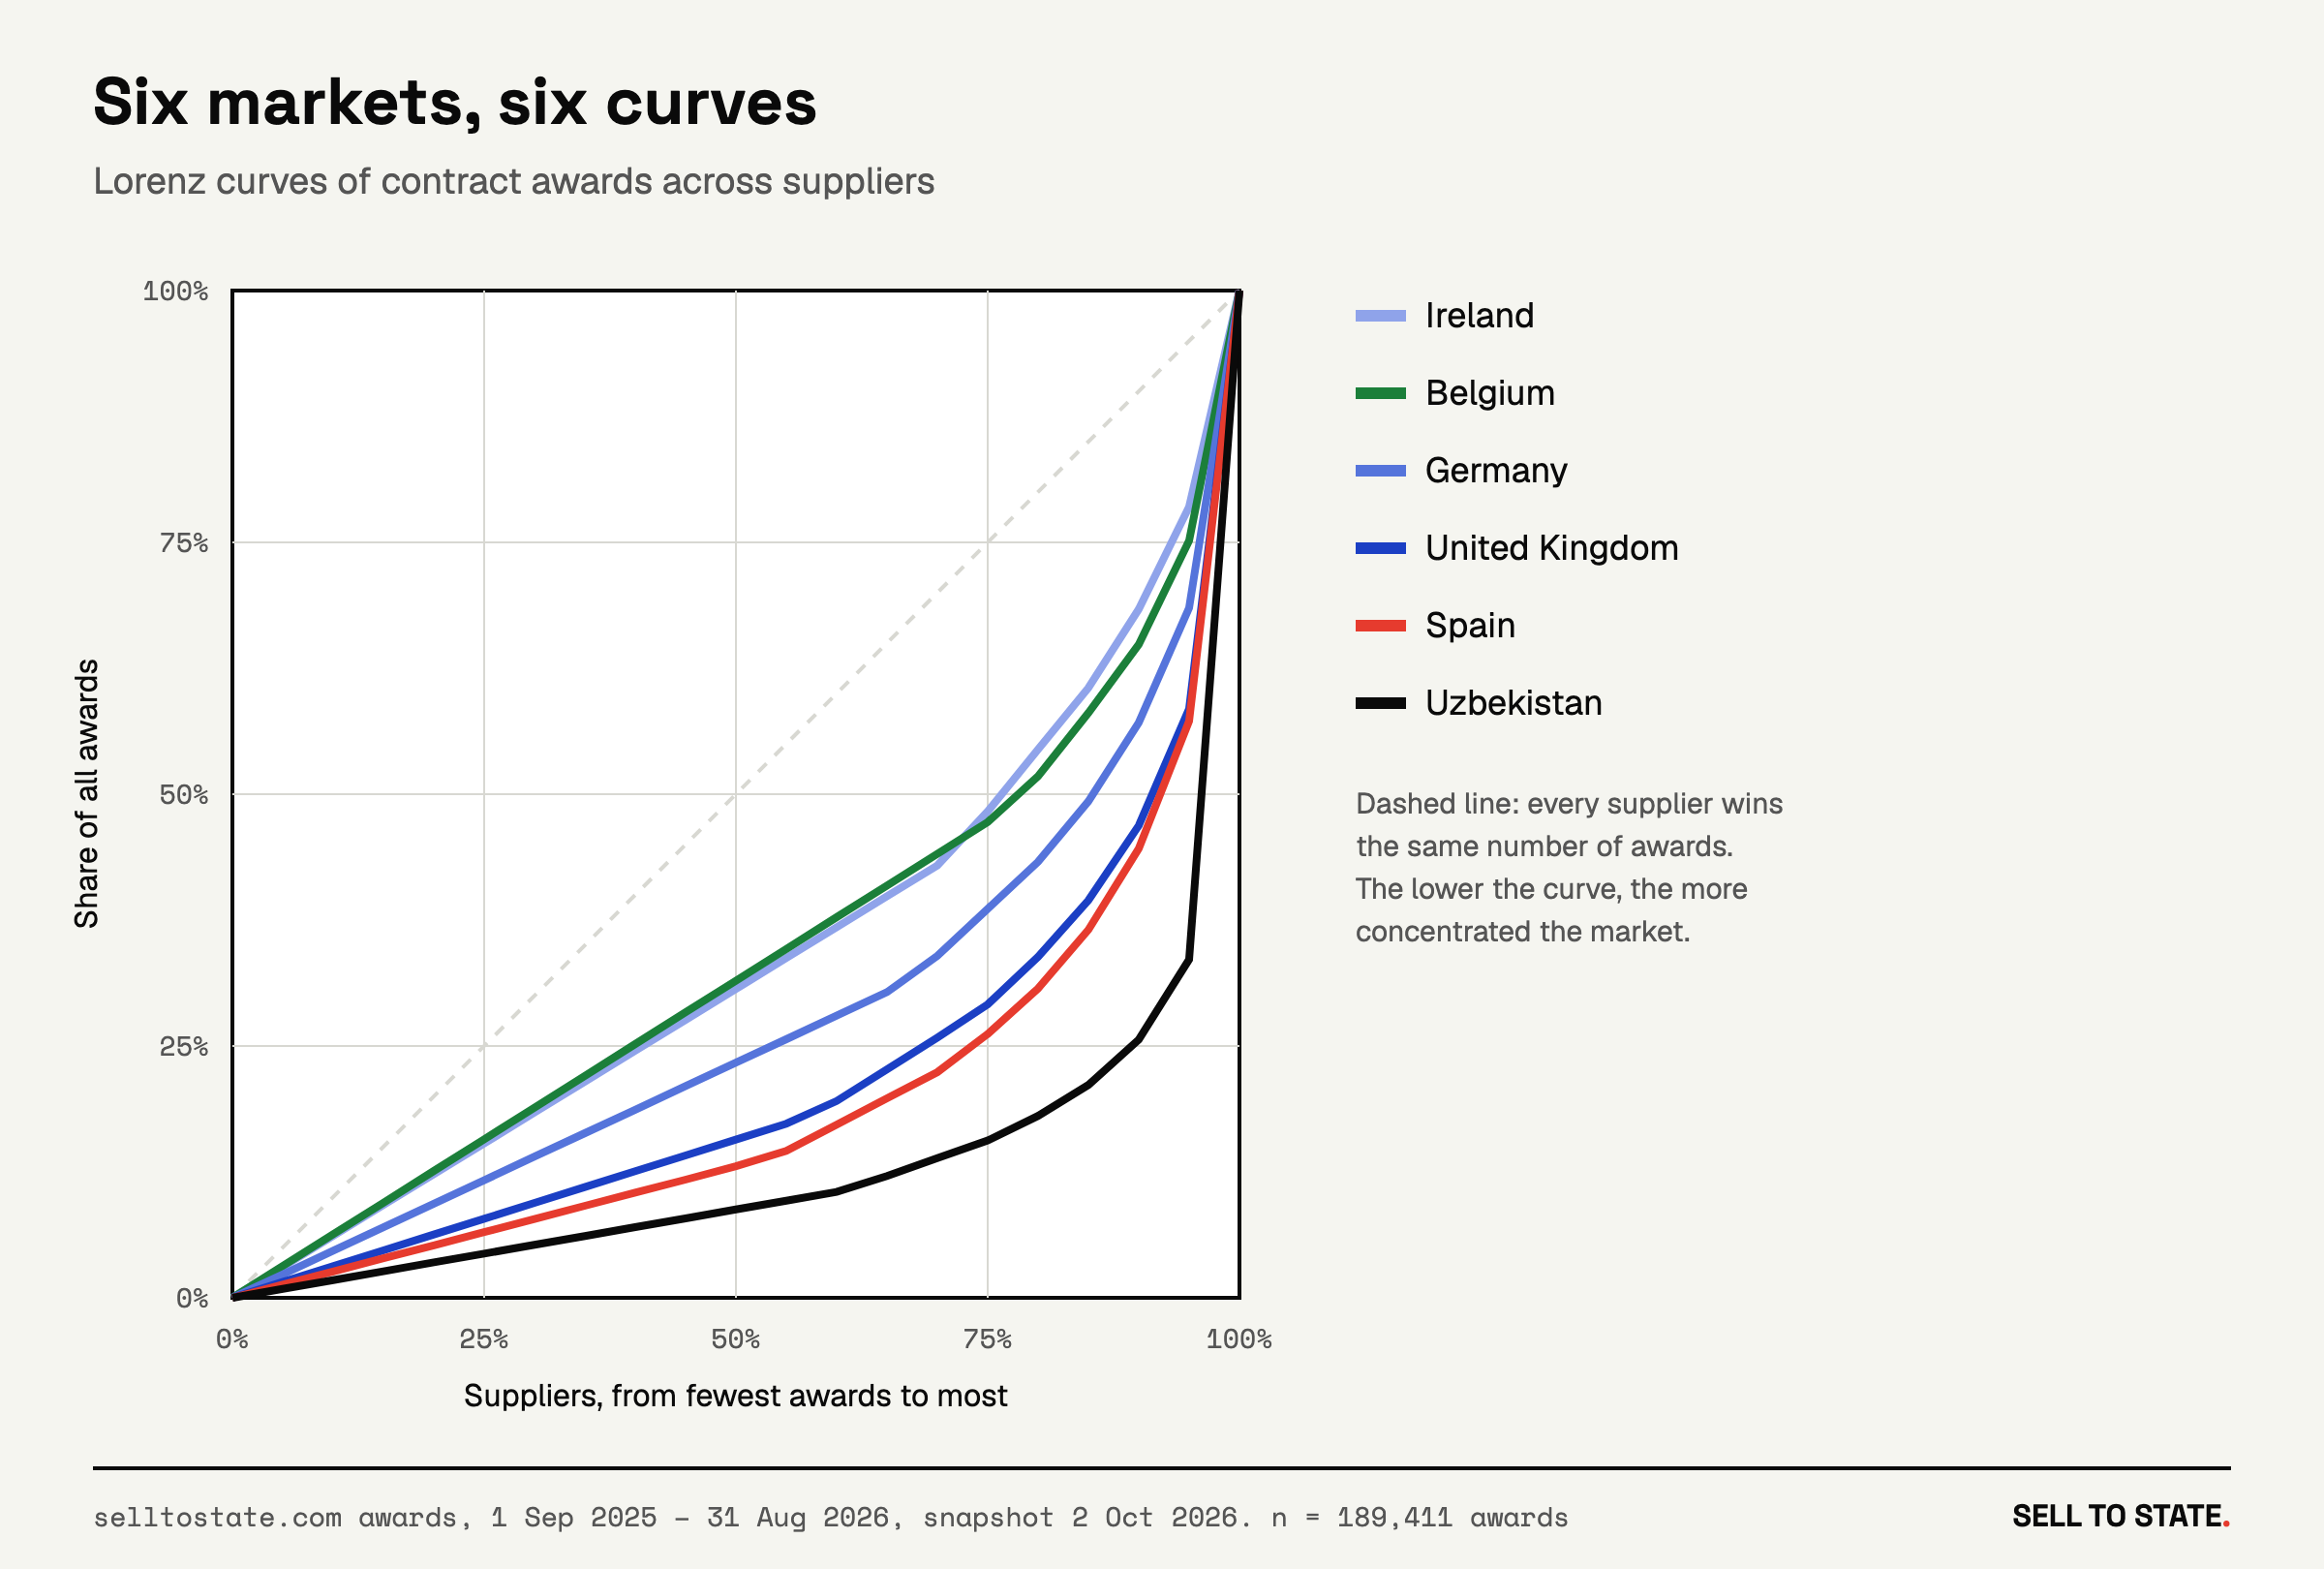
A Lorenz curve shows the whole distribution in one line. Sort the suppliers from the fewest awards to the most, then plot what share of all awards the bottom part holds. A market where every supplier wins equally sits on the dashed diagonal. The lower the curve, the more the awards gather at the top.
In Uzbekistan, the bottom 95% of winning suppliers hold 34% of the awards. In Ireland, the bottom 95% hold 79%.
Follow the money: government spending data by contract value
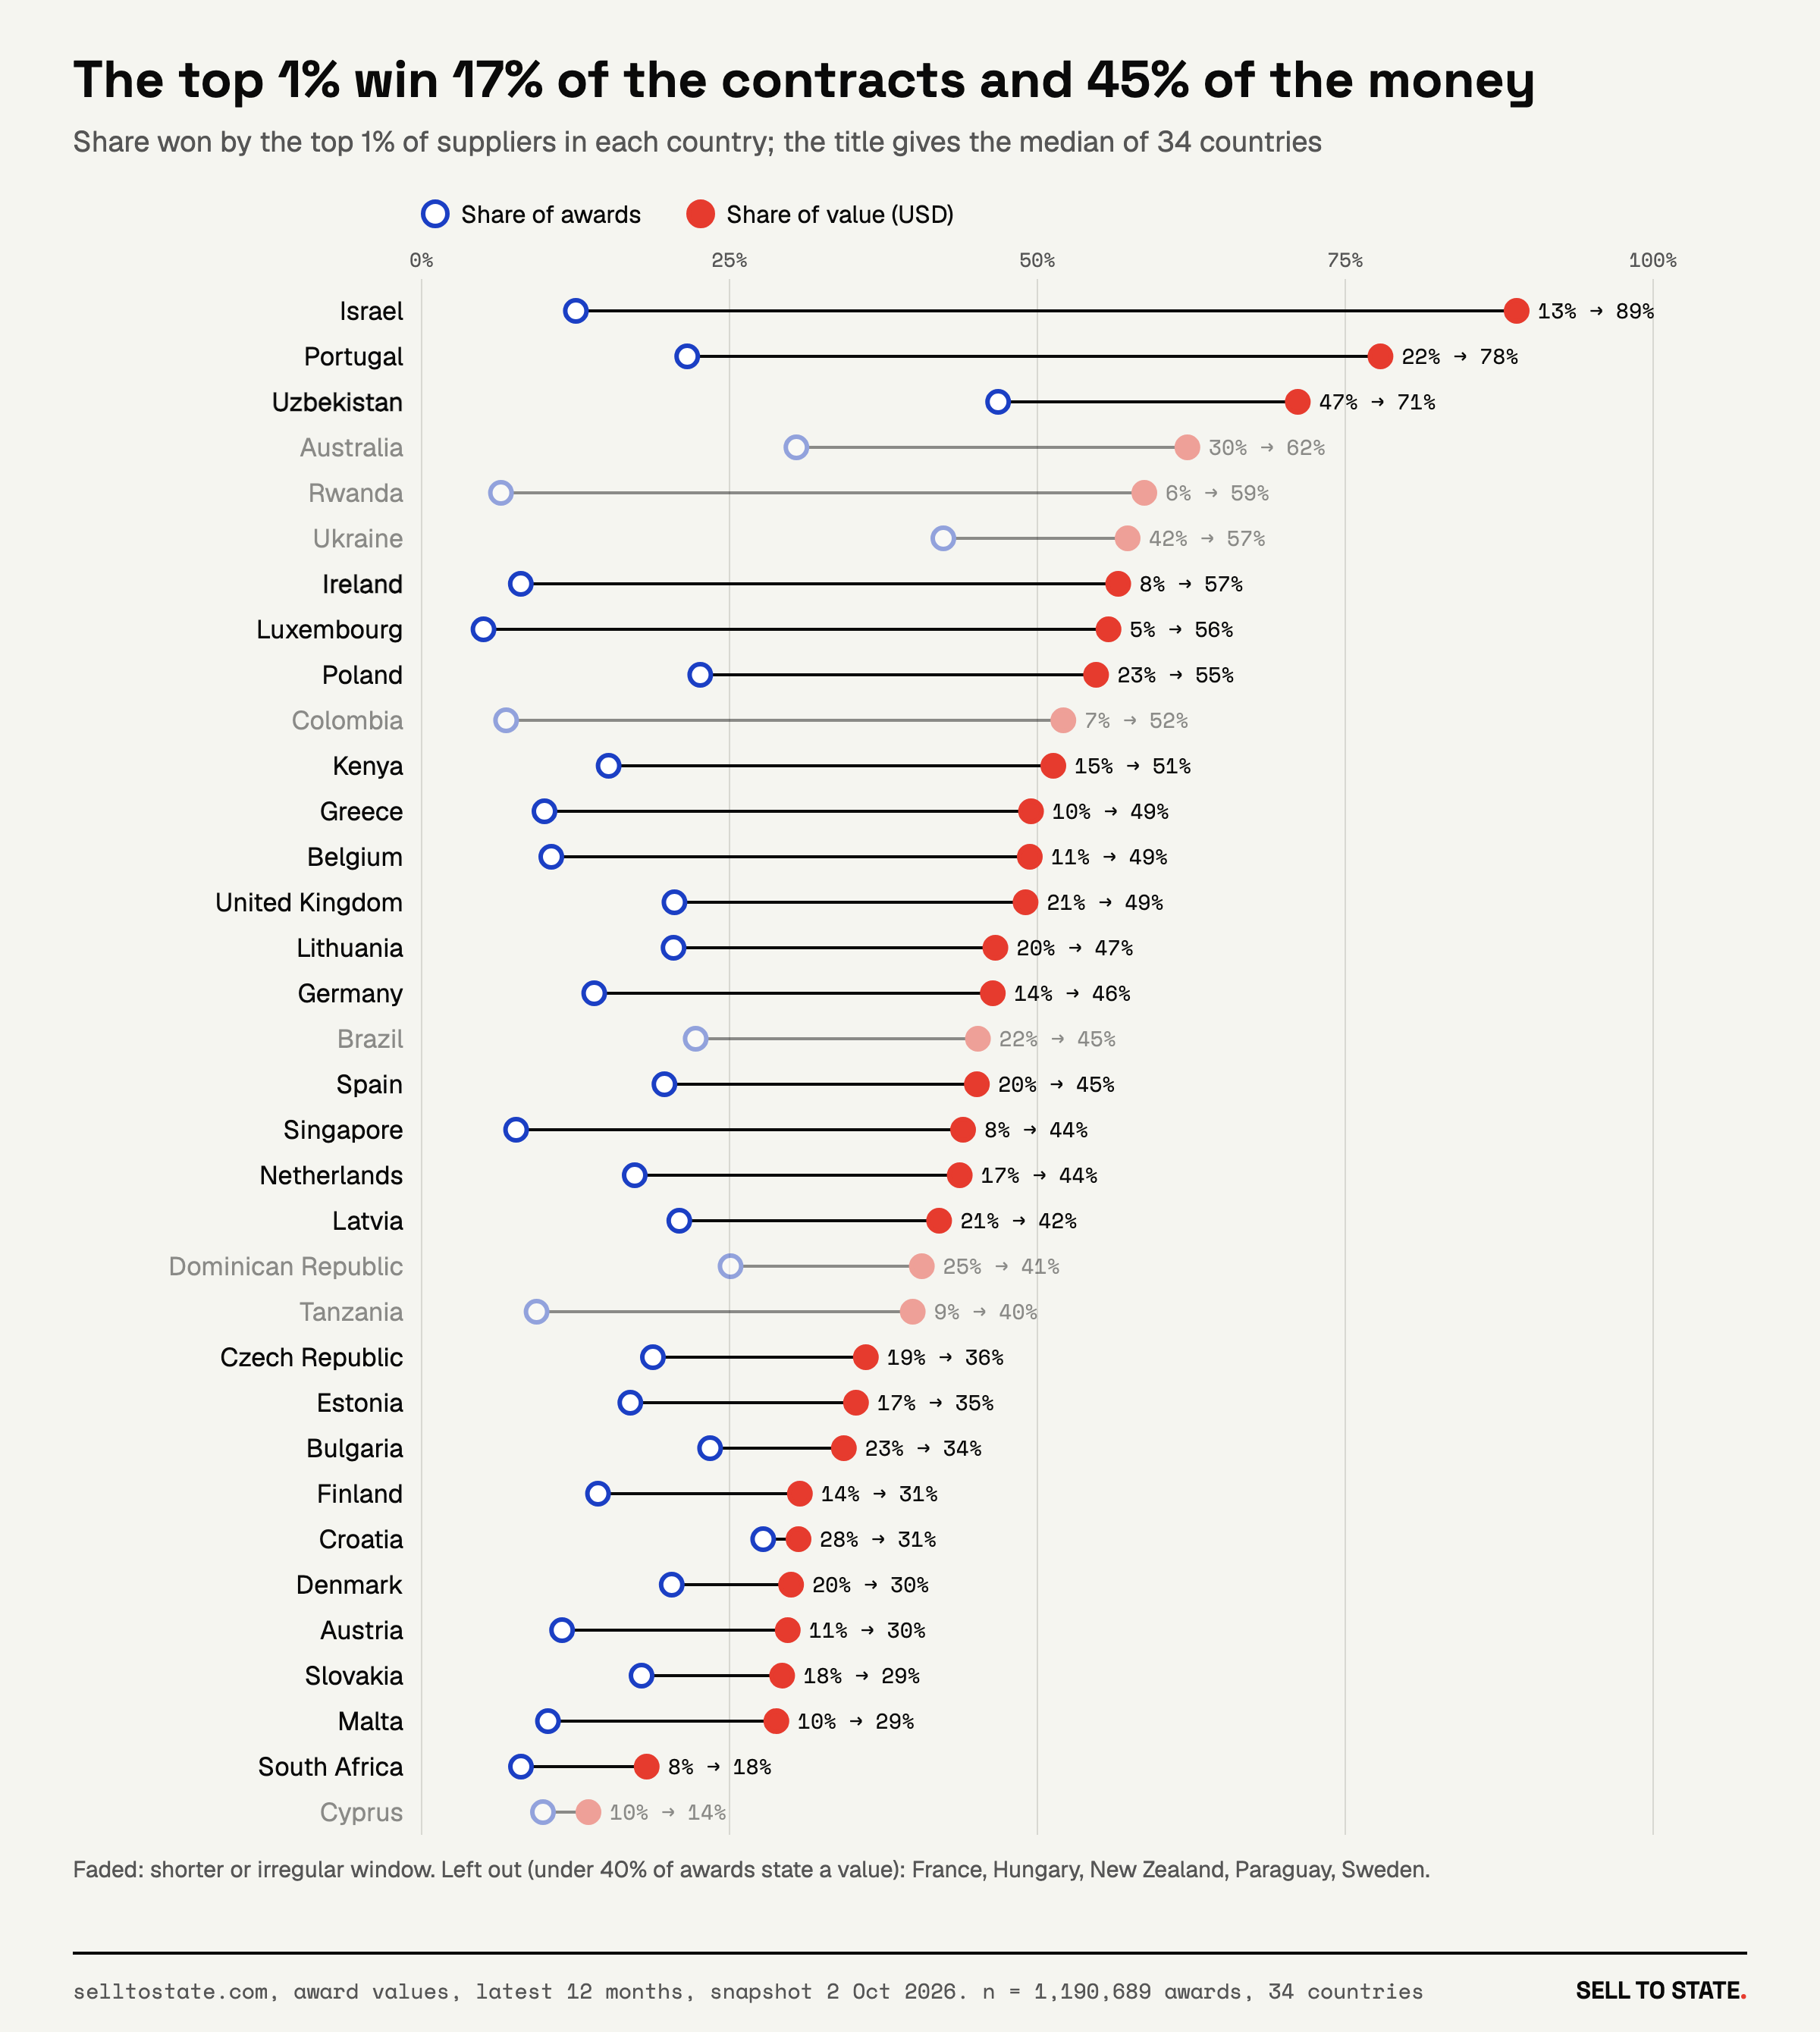
By number of contracts, the top 1% of suppliers win 17% in the median country. By stated value, they win 45%. We repeated the count with the amount of each award, in US dollars, in the 34 countries where at least 40% of awards state an amount. Every market is more concentrated by value. In Ireland, the top 1% of suppliers won 8% of the contracts and 57% of the stated value. In Luxembourg the jump is from 5% to 56%. South Africa has the least concentrated money: its top 1% won 18%.
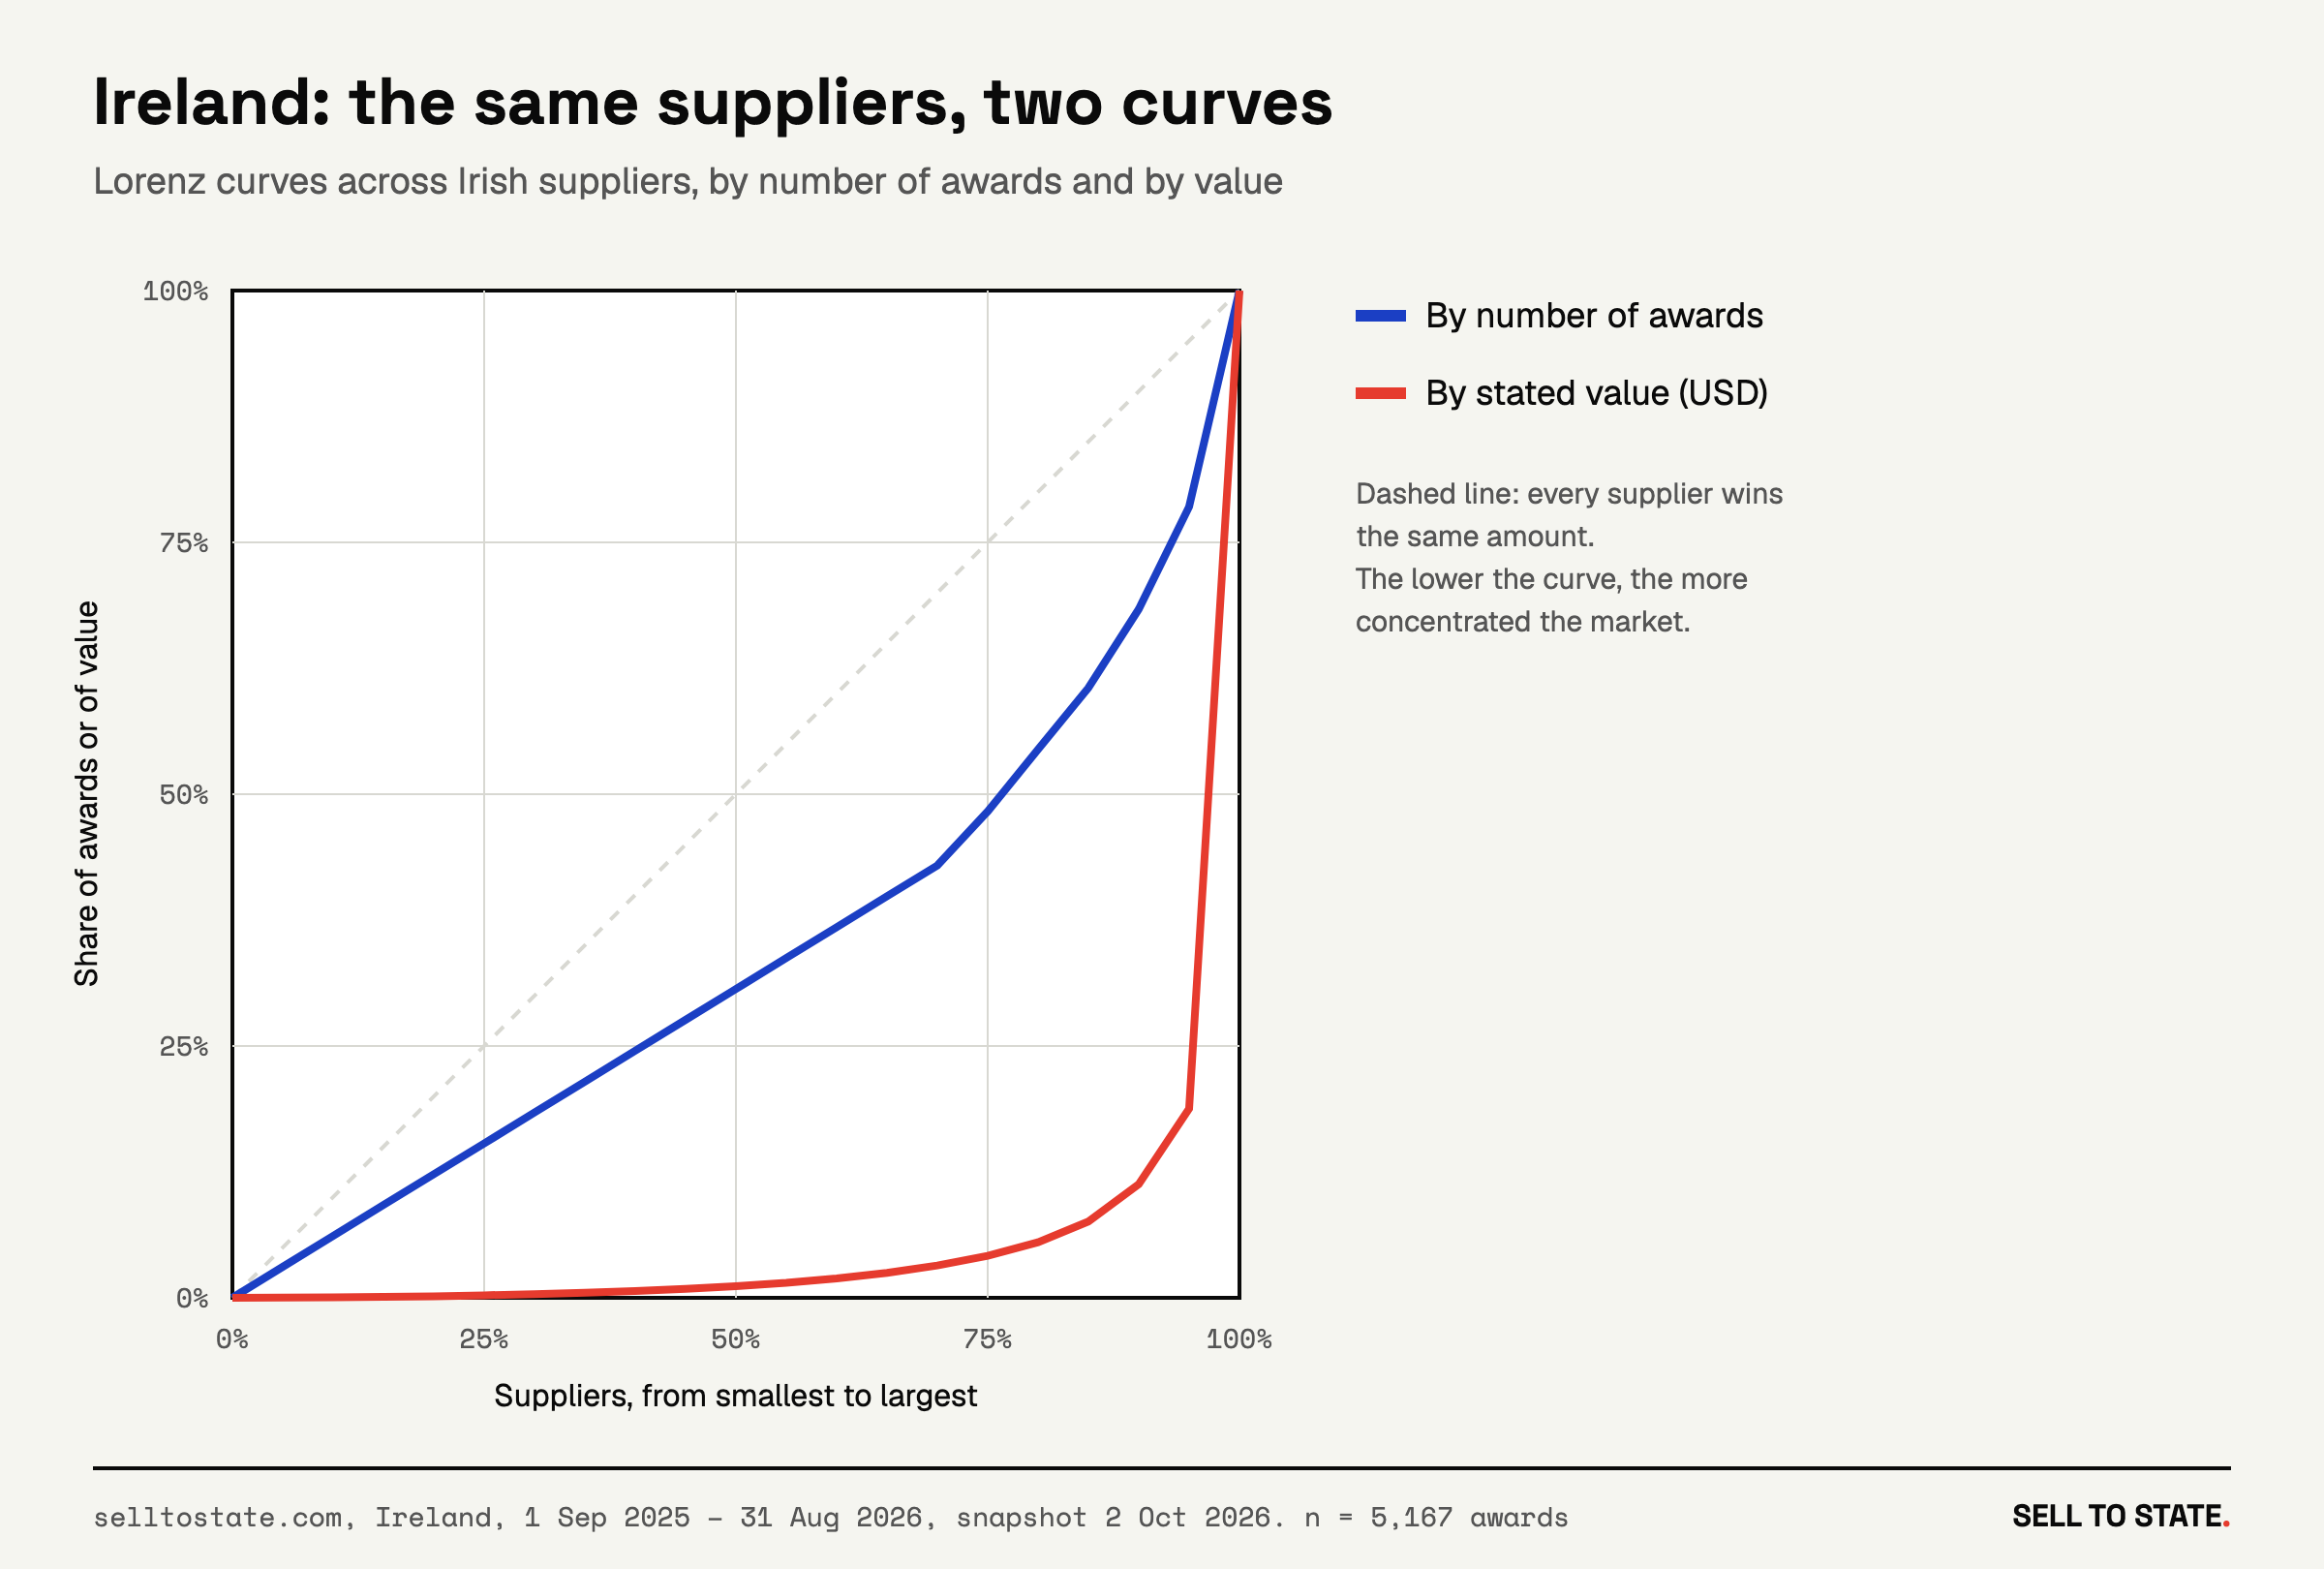
In Ireland, the half of suppliers with the smallest awards won 31% of the contracts and 1% of the value.
Large contracts
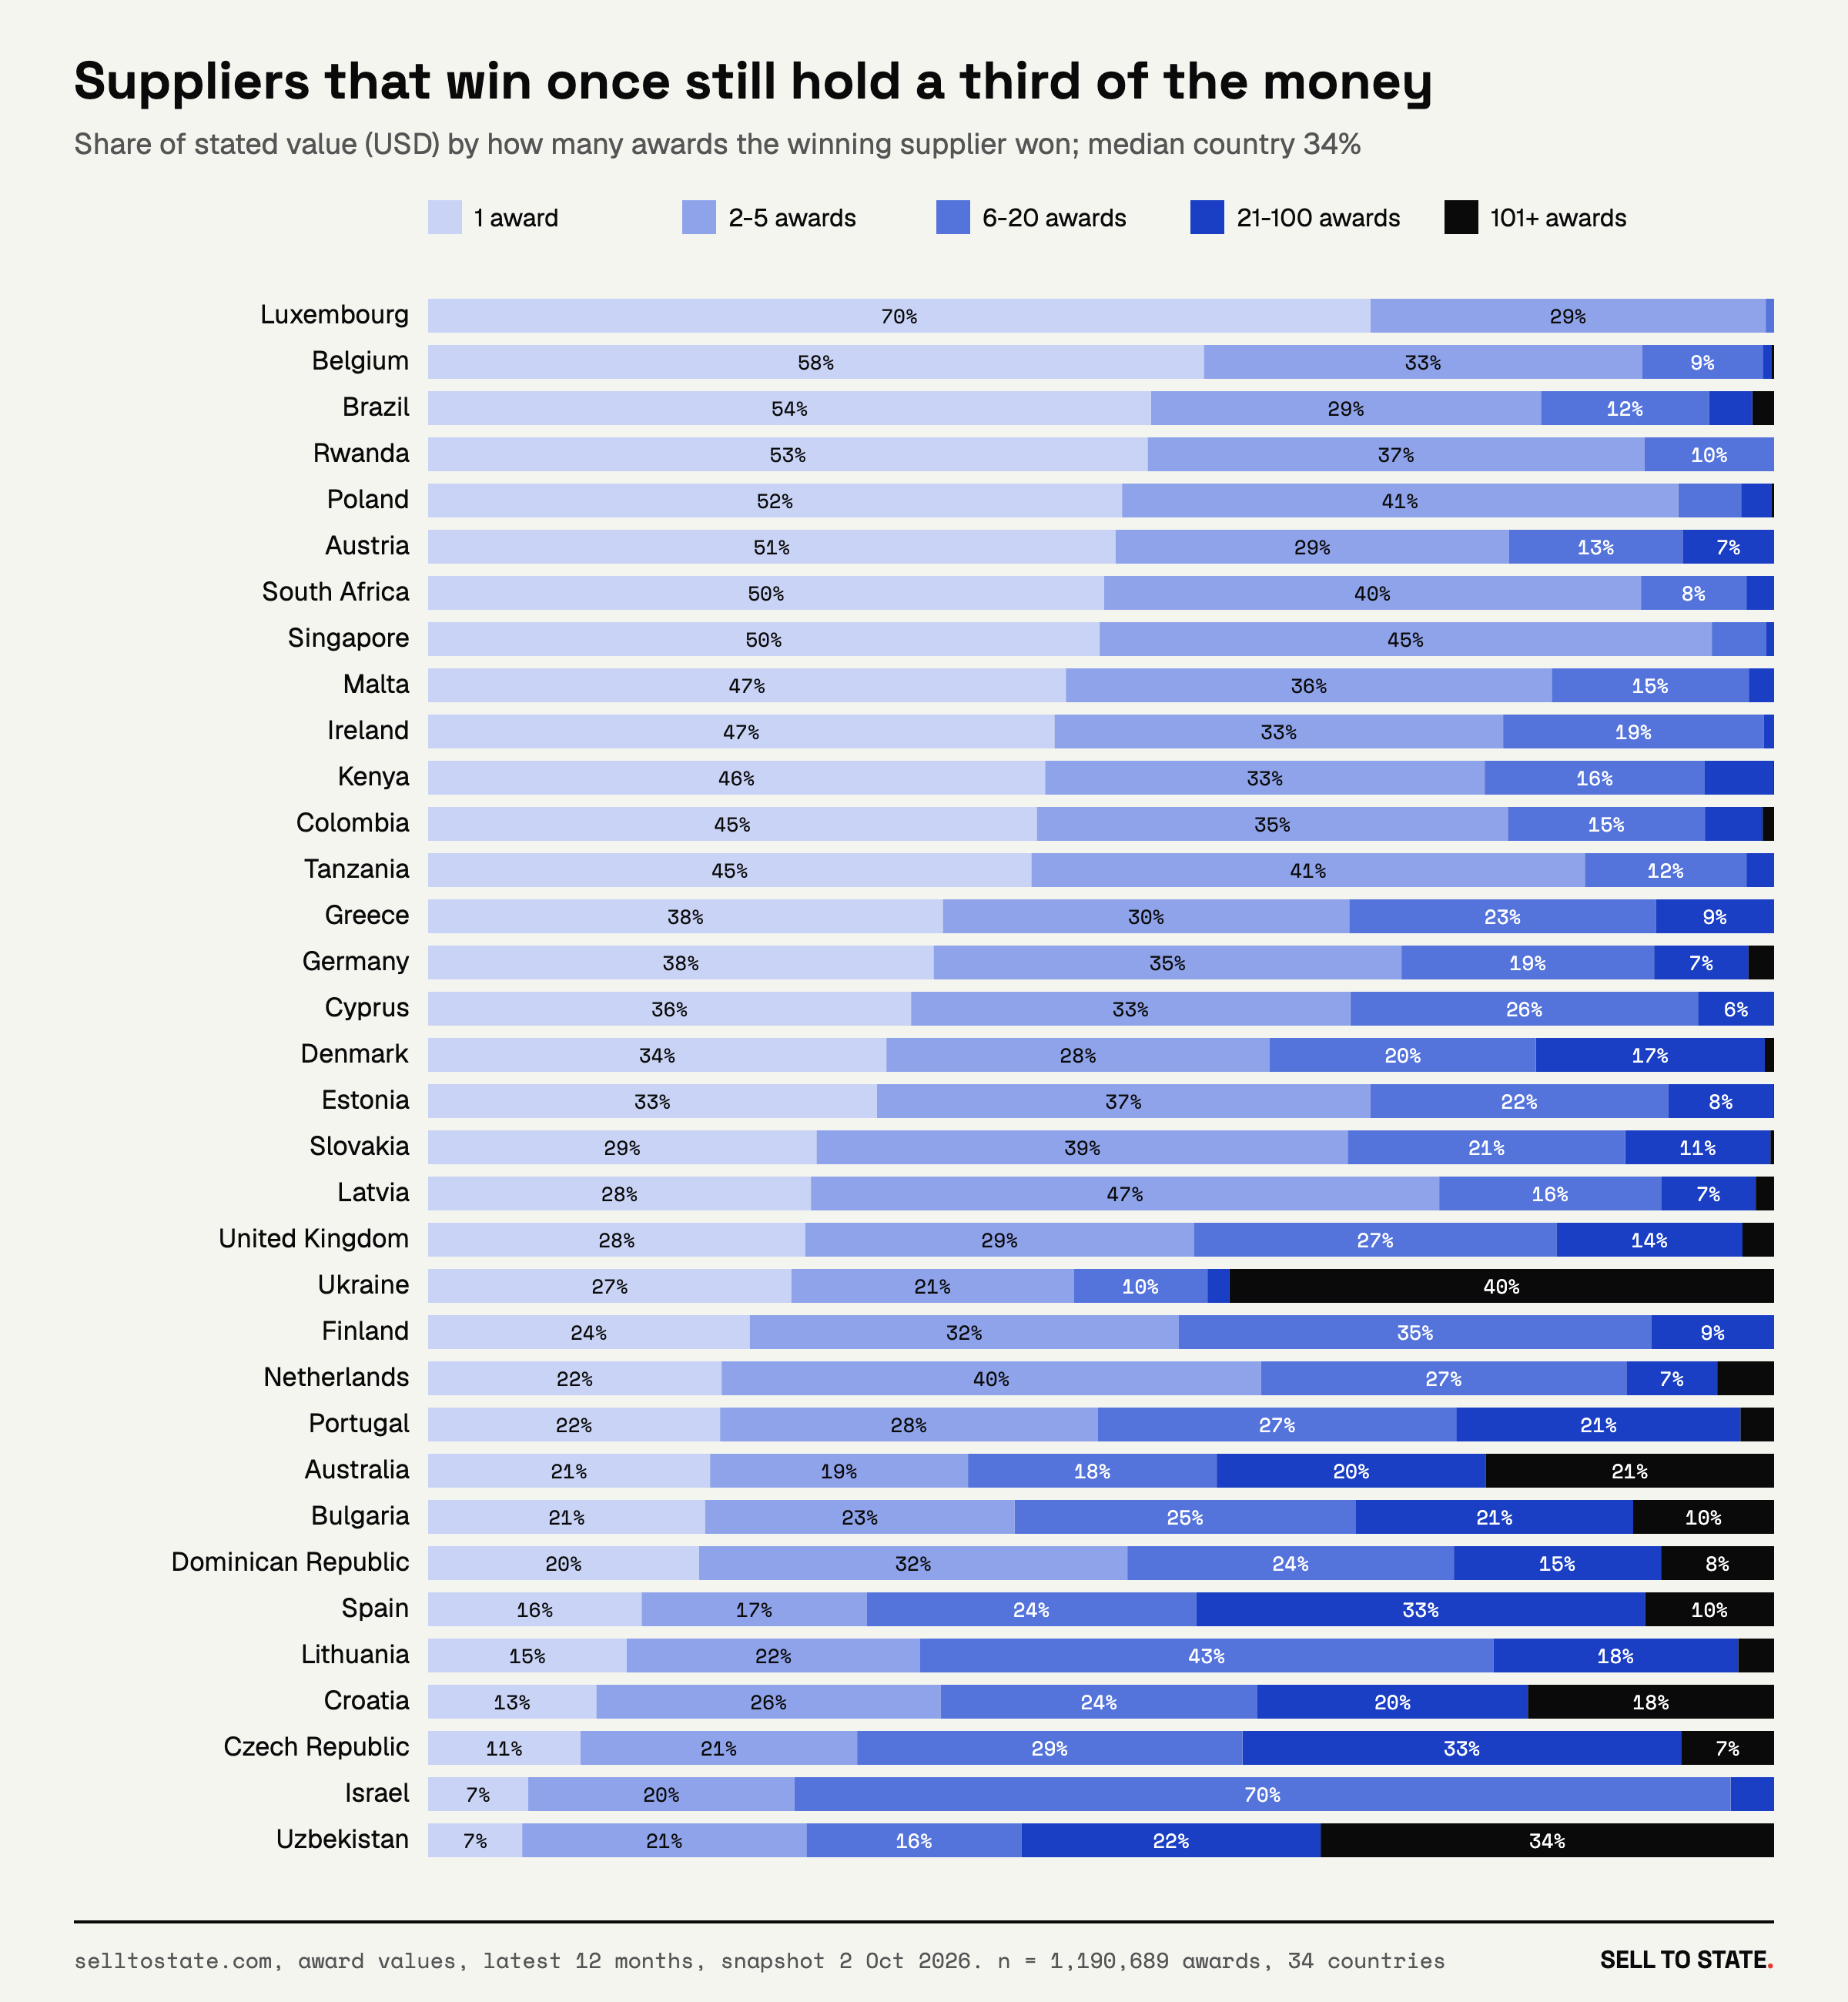
The money gathers in large contracts. Frequent winners do not hold most of it. In 26 of the 34 countries, suppliers that won once in the year hold a larger share of the value than of the contracts. In the median country they hold 34% of the value. And in the median country, 30% of the suppliers in the top 1% by value won exactly one contract in the year.
Israel and Uzbekistan
Israel and Uzbekistan are different. In Israel, the top 1% of suppliers hold 89% of the stated value. Two state-owned road companies, Netivei Israel and Netivei Ayalon, hold 64% between them through framework agreements with the government. In Uzbekistan, suppliers with six or more awards hold 72% of the value. The largest are state-owned oil, gas, power and rail companies.
Stated amounts
Kenya and Colombia need a second look
Kenya. The award notices we collect from Kenya's public procurement portal (PPIP) fell from 1,602 in June 2025 to 17 in July 2025. July 2025 is the month the National Treasury made its new e-procurement system (e-GP) mandatory. So Kenya's window here is August 2024 to July 2025: a Gini of 0.46, with the top 1% of suppliers holding 15% of the awards. Our guide to tenders in Kenya has the full story.
Colombia. Our Colombia data starts in January 2026, so its window has 8 months. Also, 569,593 of its 774,475 award records (74%) describe professional or support-service contracts ("prestación de servicios", "apoyo a la gestión"), many of them with individual people. Both facts put Colombia at the bottom of the ranking, at 0.25.
How we counted: what is in the procurement data
Records and countries
- One record is one contract award: a buyer, a supplier, a date and, where the source gives it, an amount. We use the award date, or the publication date when the award date is missing.
- The sources are the national procurement portals and, for 18 European countries, Tenders Electronic Daily (TED). The full list is on each country page.
- We include the 39 countries where we hold more than 2,000 award records. Slovenia also has more than 2,000, but we leave it out: its largest supplier names appear on contracts in 11 to 13 unrelated sectors, which shows a parsing error. The other 24 live countries have too few records for a fair number.
Windows
- Concentration grows with the length of the window, so every country gets 12 months: its latest 12 months with awards in at least 11 of them and no month below a fifth of the average. 30 countries have such a window. For 23 of them it ends in August 2026. The others end earlier, Kenya's in July 2025 and Poland's in November 2025.
- Nine countries have a shorter or irregular window, shown as light bars: Australia, Brazil, Colombia, Cyprus, the Dominican Republic, France, Rwanda, Tanzania and Ukraine. Their numbers are less certain.
Cleaning
- Our import stored some awards twice, under two spellings of the supplier's name. We count each award once: one award is one notice, amount and date. This removed 41,725 duplicate records.
- We leave out awards with no supplier name; placeholders such as "persona natural" in Colombia; names that are only a legal form, such as "Sabiedrība ar ierobežotu atbildību" (limited liability company) in Latvia; four supplier names in Spain that appear on thousands of unrelated contracts; one Israeli supplier record that looks like a data error (6,026 awards from 3 buyers); and dates after the snapshot.
- We do not compare sectors in this piece. Our sector labels come from keywords in each description, and a check by hand showed too many wrong labels for most sectors. Our sector stories use the official CPV codes instead.
Values and snapshot
- For the value charts we use the amount stated in each award, converted to US dollars at the exchange rates of 2 October 2026. When several winners share one notice and one amount, we split the amount between them. We leave out France, Hungary, New Zealand, Paraguay and Sweden, where fewer than 40% of awards state an amount. TED lists only contracts above the EU thresholds, so in TED countries the value numbers describe the larger contracts.
- The snapshot date is 2 October 2026. The numbers will move as new awards arrive. This research is based on the award data behind Sell to State.
Procurement analytics you can run yourself
Pick the market you sell into and check four numbers before you bid. How many suppliers won there last year? What share won only once? What share of the contracts went to the top 1%, and what share of the money? This is basic procurement data analytics, and each number takes one query. You can see the winners of every buyer on its page, for example in Ireland or Uzbekistan. To run the numbers for a whole country or sector, export the awards to CSV or pull them through the API. Our guides to Germany's e-Vergabe and Uzbekistan's xarid explain where each country's data comes from. Plans are on the pricing page.
The sector pages hold the same research for each country-sector pair with enough data: 144 country-sector pairs in 23 countries, each with 300 or more awards and 50 or more suppliers in a 24-month window. Each country with 2,000 or more awards has its own data story: who wins, country by country.
Who wins government contracts: the short version
In most countries, most suppliers that win a government contract win only one. The work itself still gathers at the top, and how much it gathers depends on where you sell. The money gathers even more: in the median country, the top 1% of suppliers win 17% of the contracts and 45% of the stated value. The top 1% of suppliers won 8% of Ireland's public contracts last year. In Uzbekistan, they won 47%.
Download the charts
Free to reuse. Give a link to this article.
- V1 — How concentrated is public buying? 39 countries ranked. (PNG, 2400 px)
- V2 — Most winning suppliers win one or a few contracts. (PNG, 2400 px)
- V3 — Repeat winners take most of the contracts. (PNG, 2400 px)
- V4 — Six markets, six curves. (PNG, 2400 px)
- V7 — In 33 of 39 countries, most winning suppliers won only once. (PNG, 2400 px)
- V8 — The top 1% win 17% of the contracts and 45% of the money. (PNG, 2400 px)
- V10 — Suppliers that win once still hold a third of the money. (PNG, 2400 px)
- V11 — Ireland: the same suppliers, two curves. (PNG, 2400 px)